
We will be introducing new workflows to replace the tri-chart and its alerting features. As a result, they will soon no longer be supported. Instead, use unified dashboards and alerts.
You create dashboards as a collection of Streams on a single page, making it easy to monitor connected parts of a system. This can be especially useful in targeting connected issues and observing the relationship between certain operations.
For example, say you’ve decided to monitor API requests incoming from a Web server. You might create a dashboard that shows the Web server’s performance, request performance, handler traffic, SQL queries, and page activity.
Here are some other great use cases for a dashboard:
- Viewing all operations on the path of authorizing a customer
- Tracking the latency of various database interactions
- Comparing operations per second for several related operations running on the same service
Use our Grafana plugin to view Cloud Observability dashboards in Grafana. Once in Grafana, clicking on a dashboard takes you back to Cloud Observability where you can view sample traces.
View a dashboard
To view a dashboard, click Dashboards from the navigation bar.
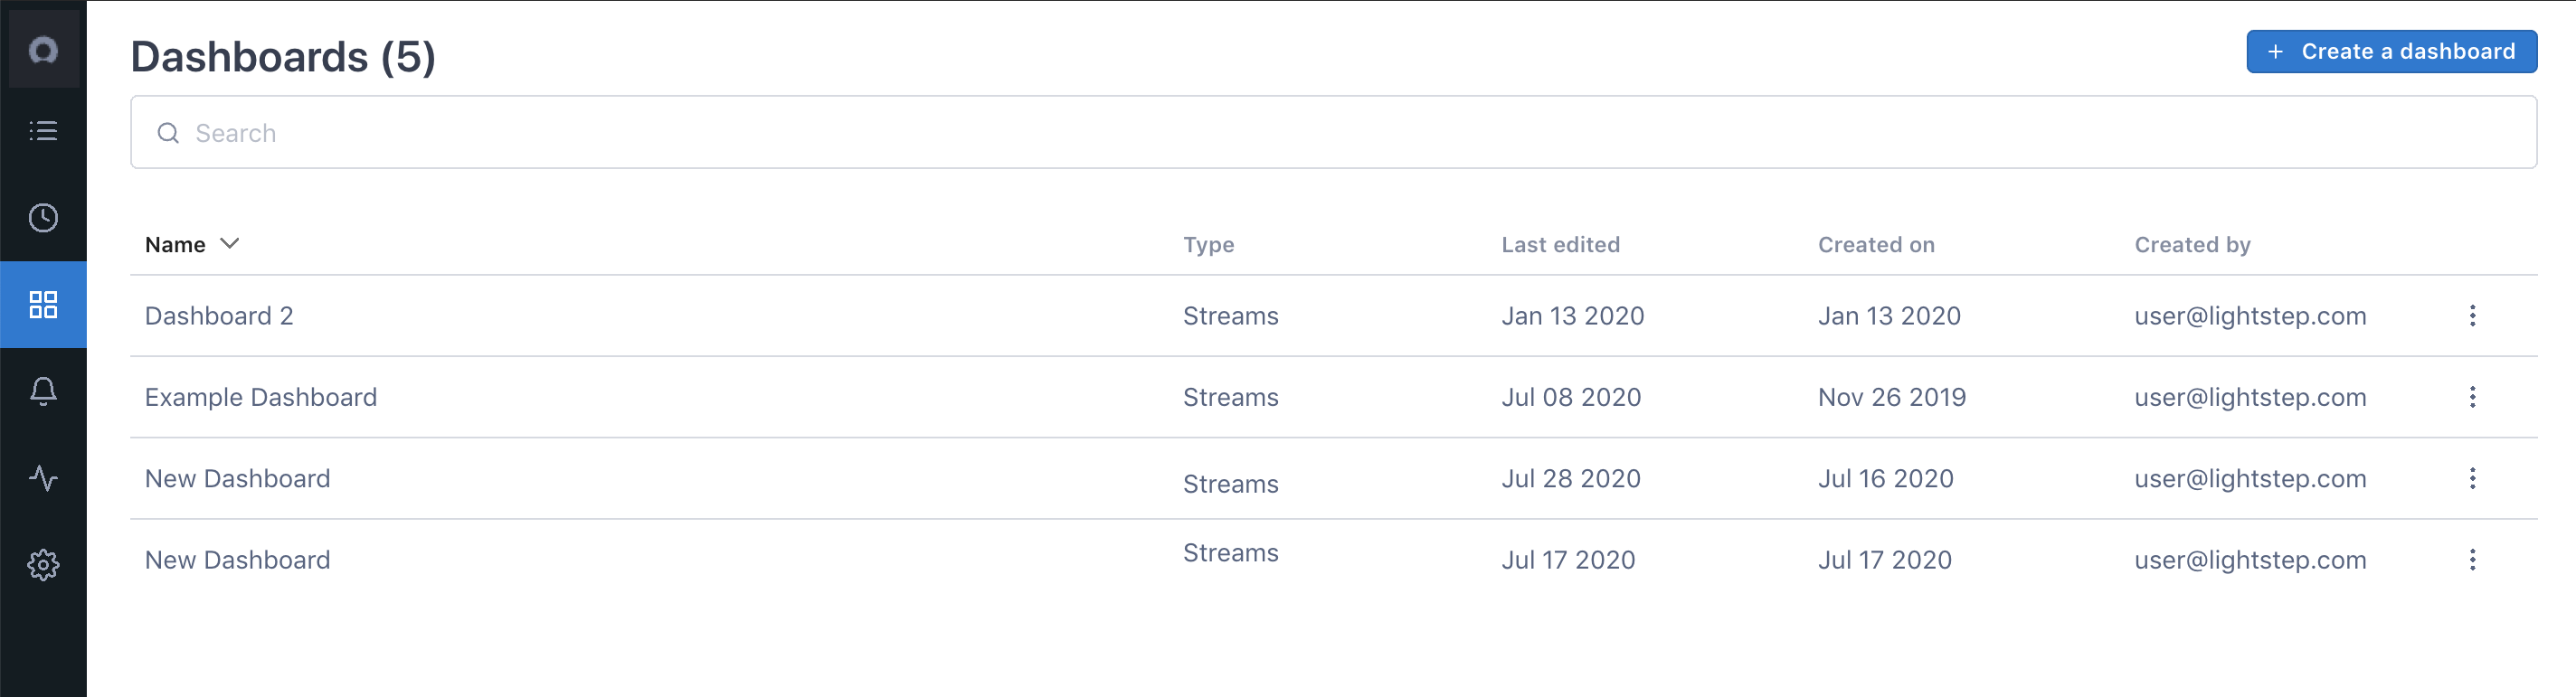
All existing dashboards are listed. Click a dashboard to open it.
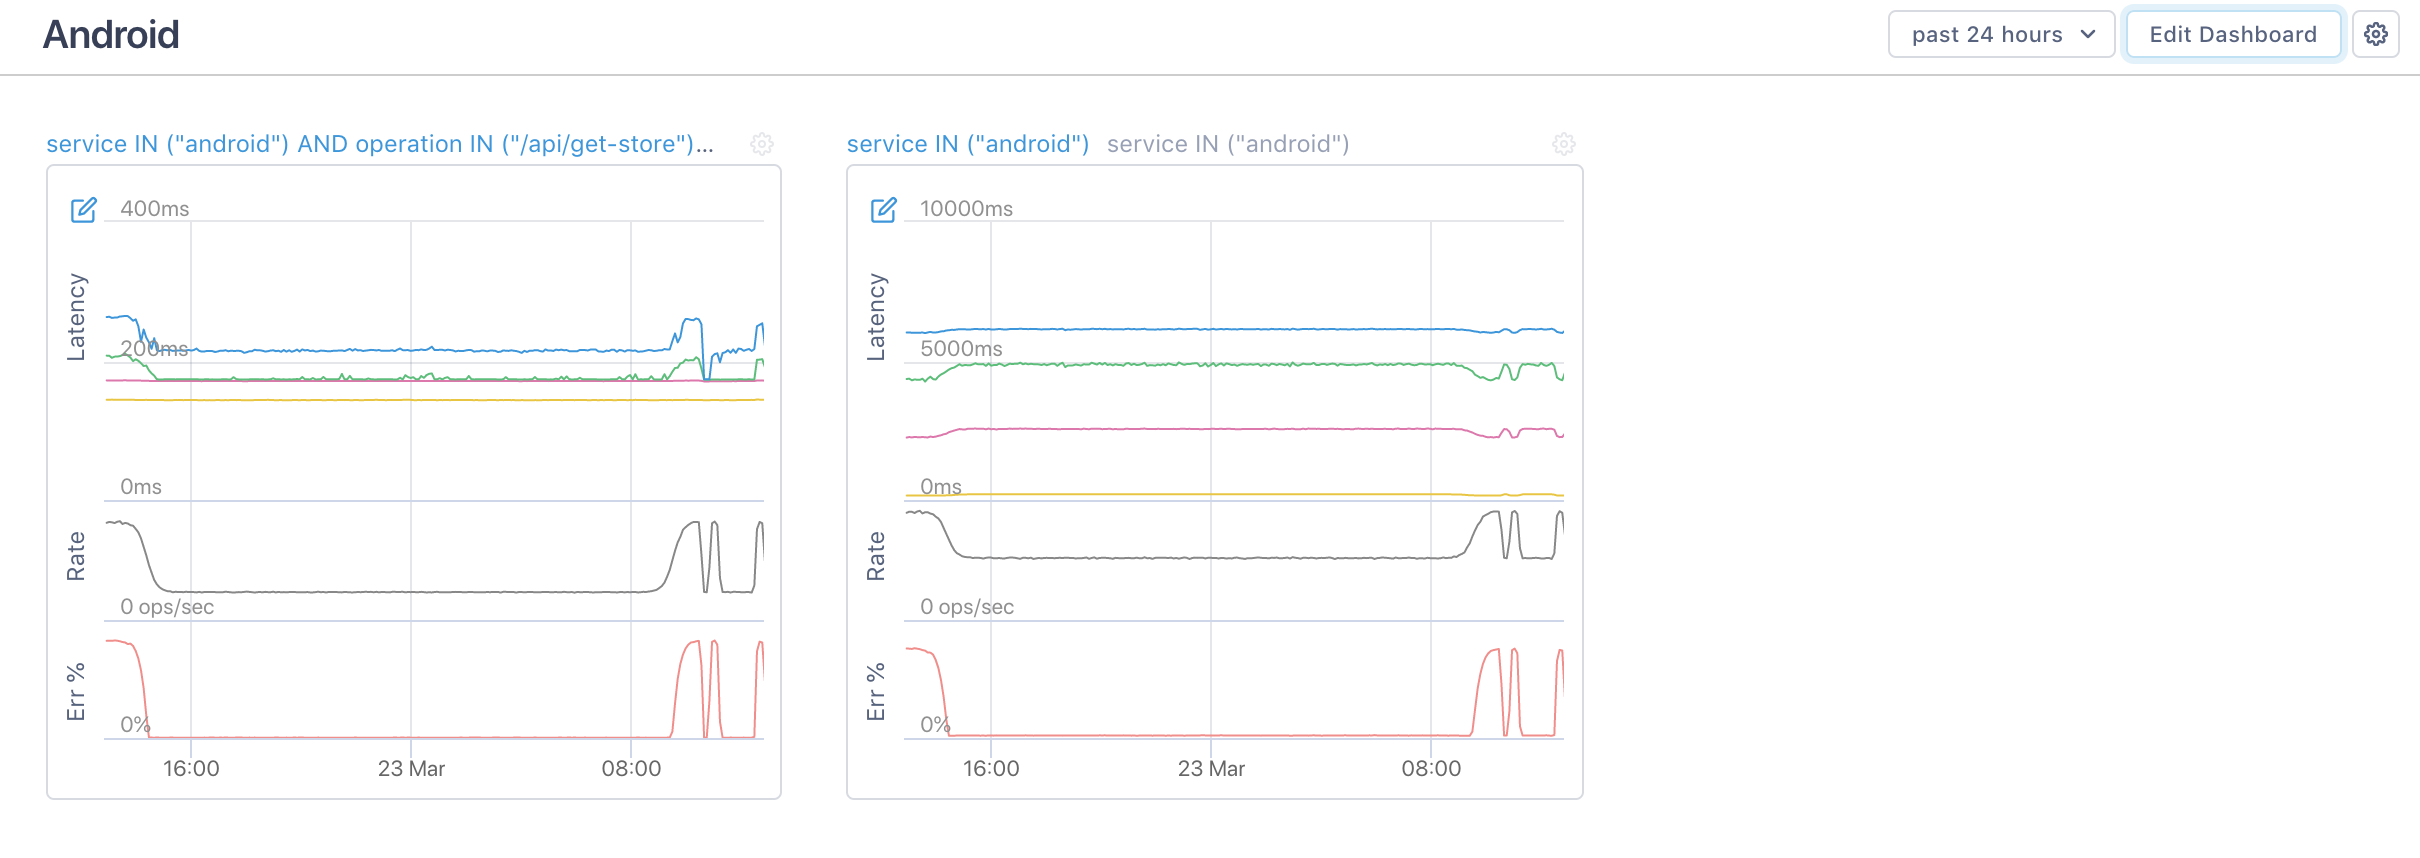
Use the time period dropdown to change the time series graphs for all Streams on the dashboard. Enter a custom time, select a pre-configured time, or click Pick Time Range to choose a time period from a calendar. 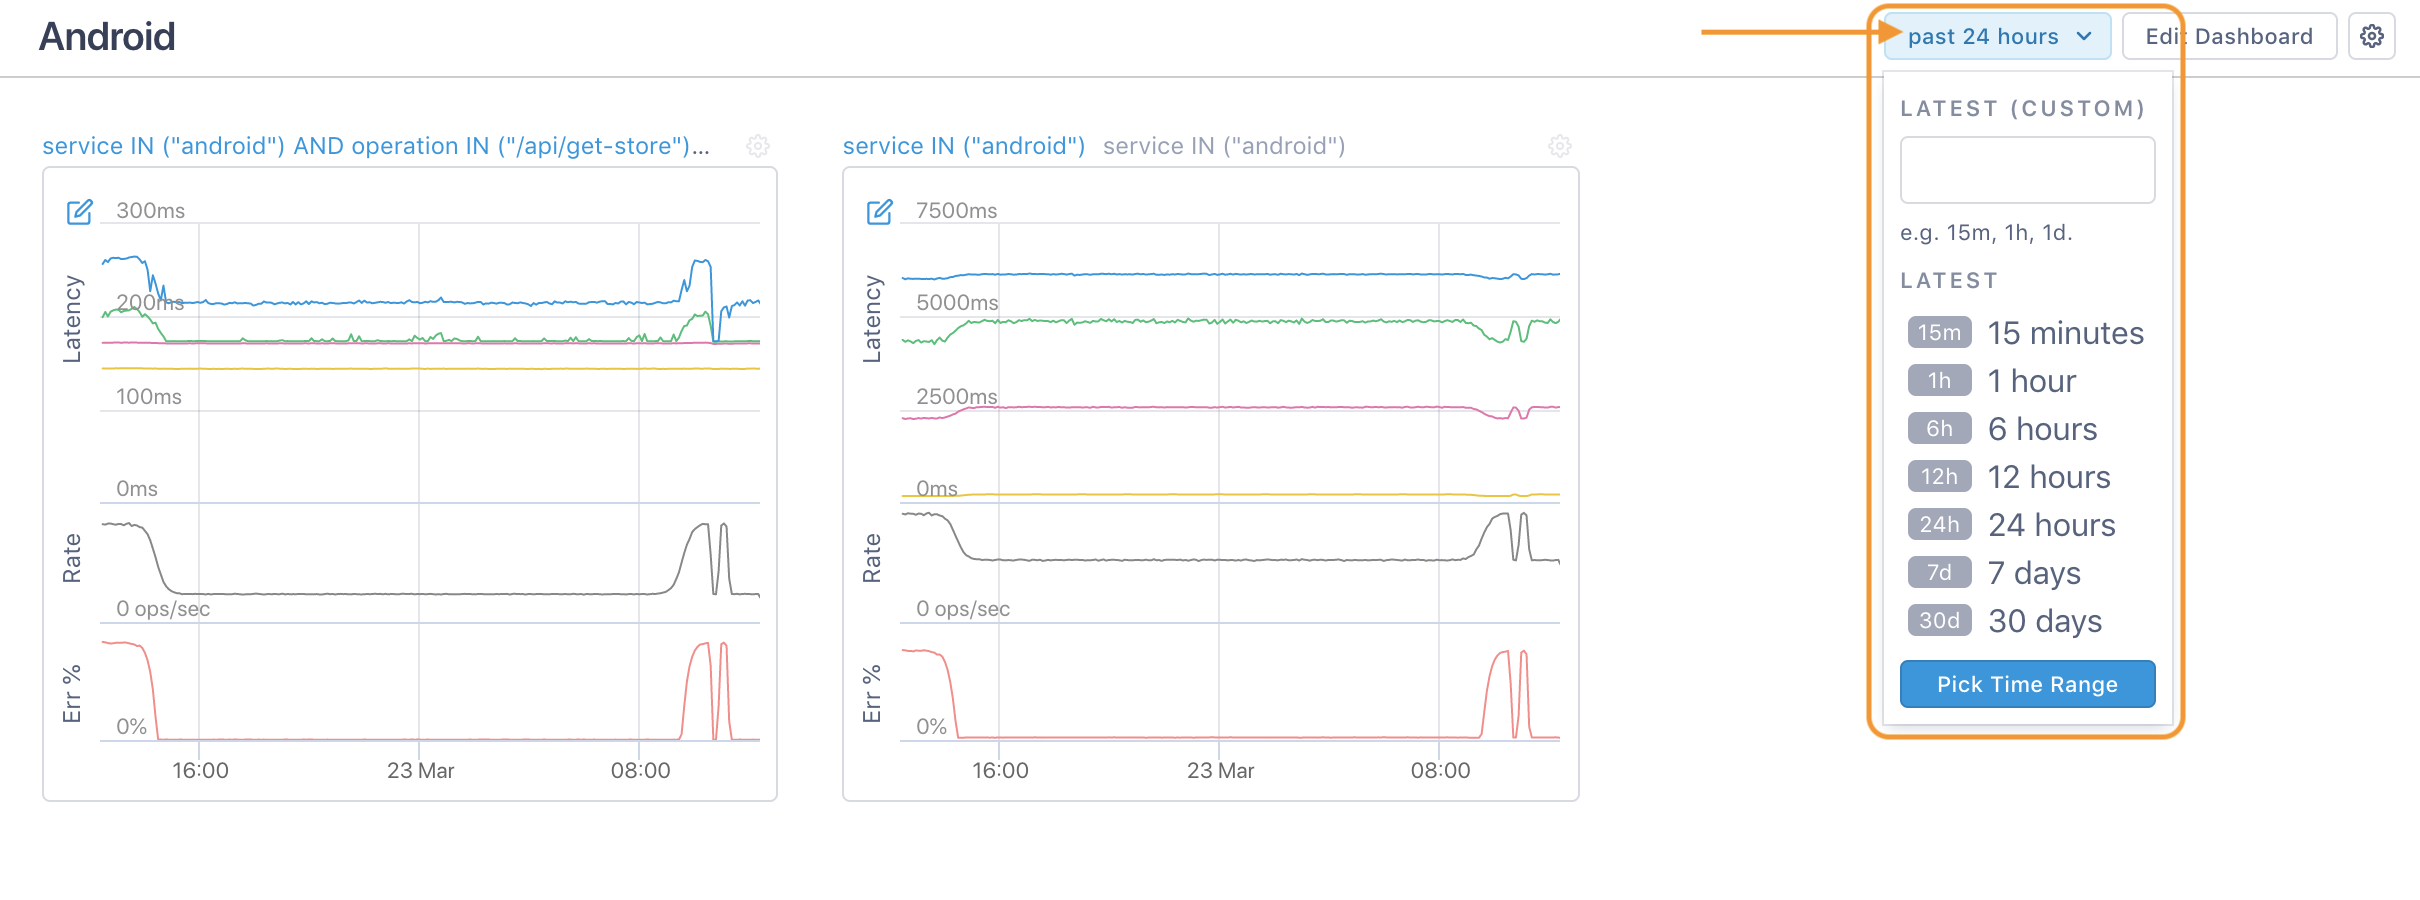
To view a Stream more closely, click the Stream’s title.
Create a dashboard
You can use existing Streams or create a new one as you create a dashboard.
To create a dashboard:
-
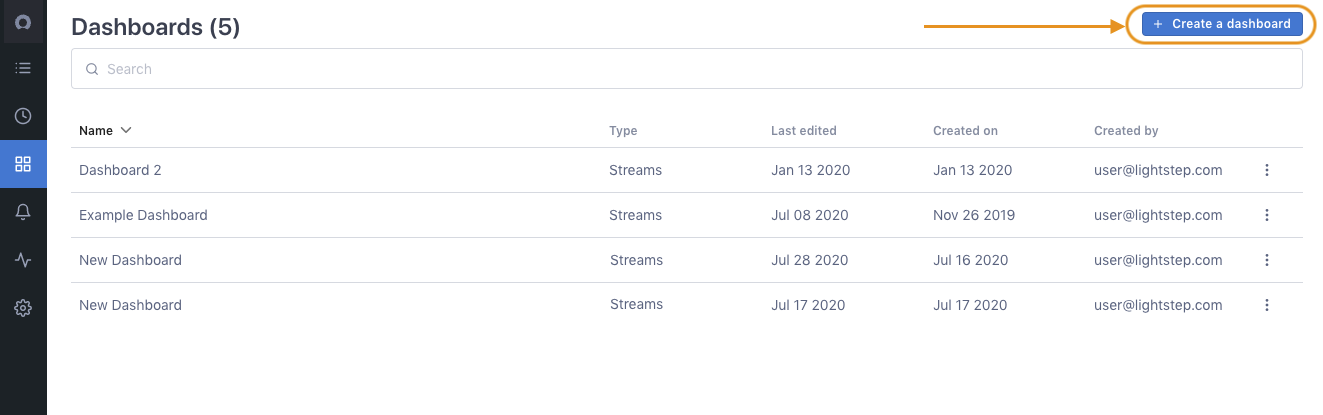
From the navigation bar, click Dashboards. All existing dashboards are listed.
-
Click Create Dashboard.
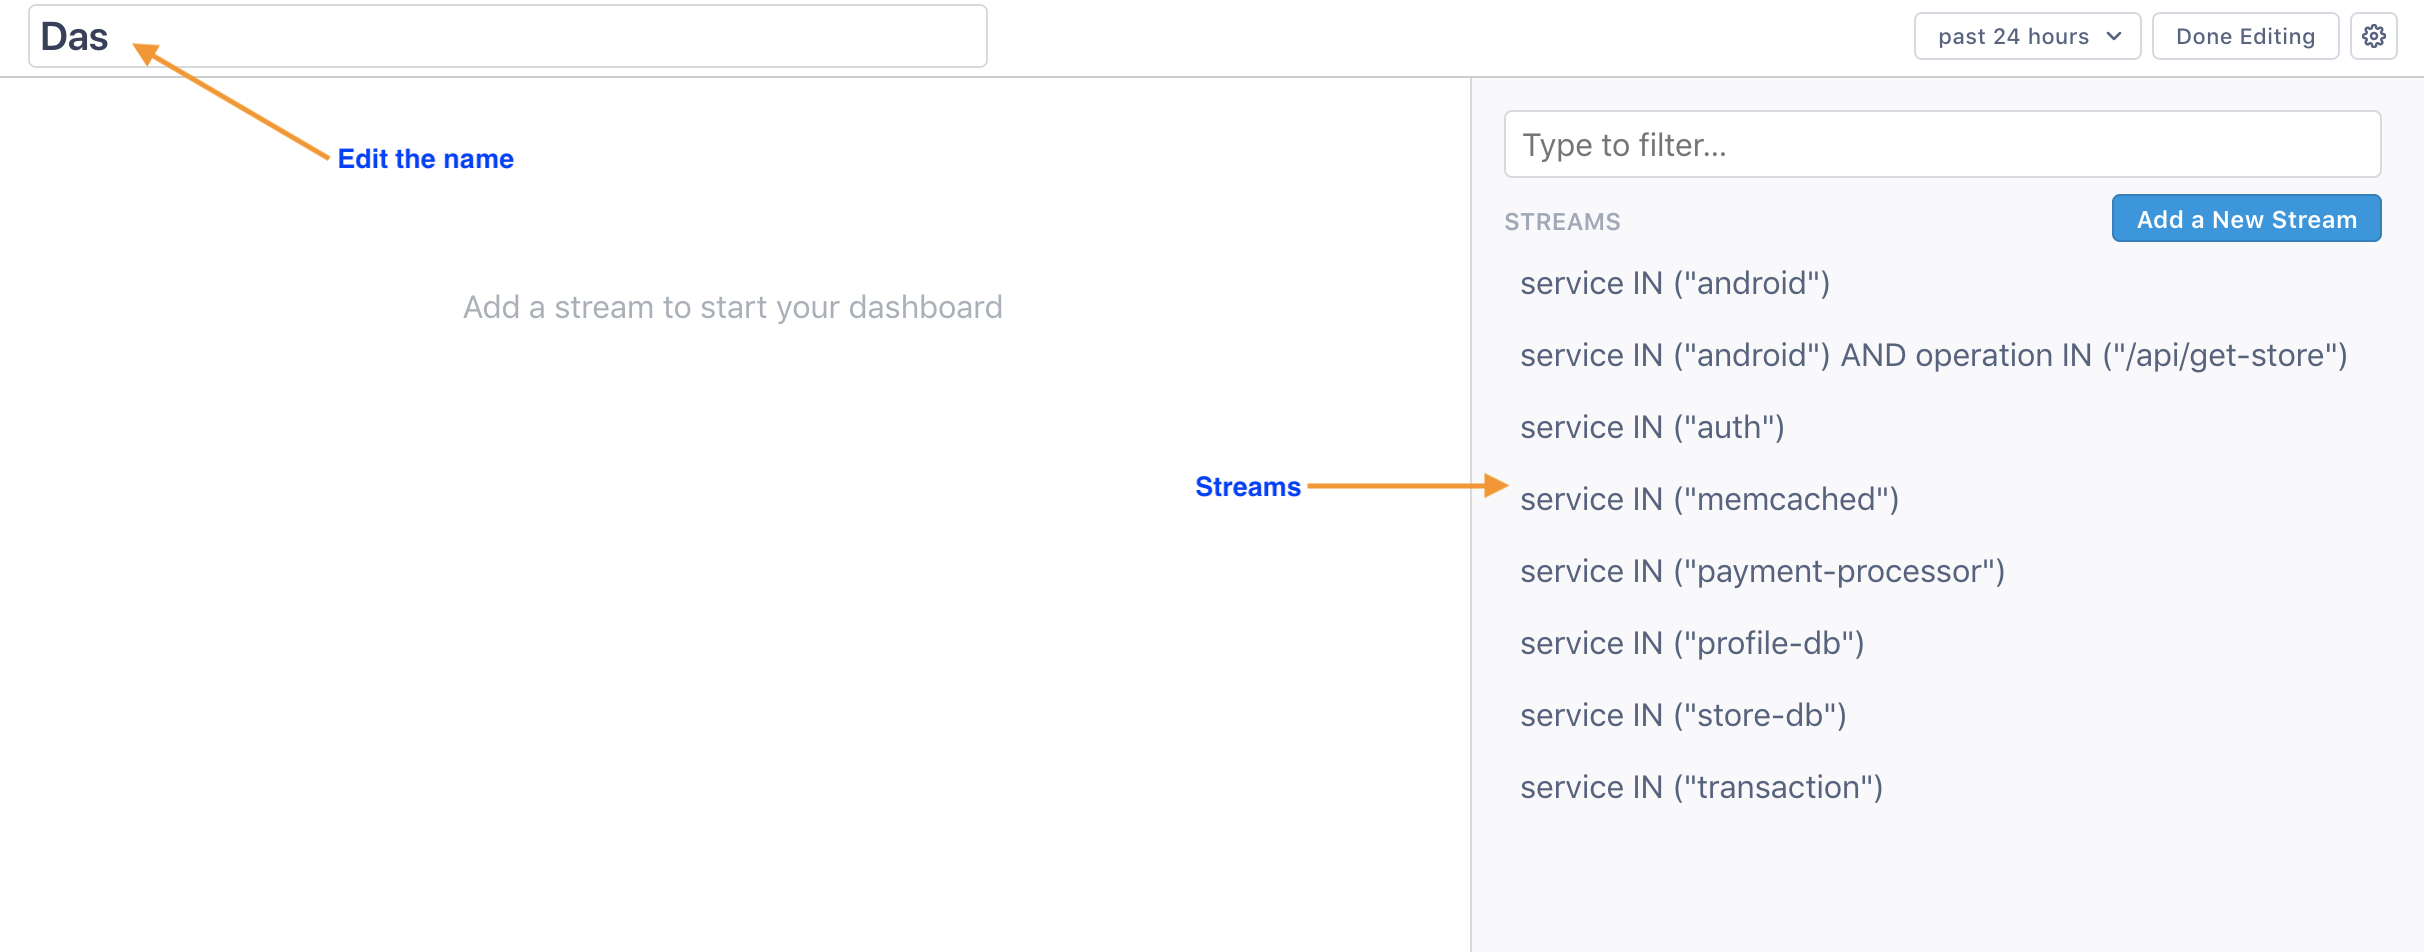
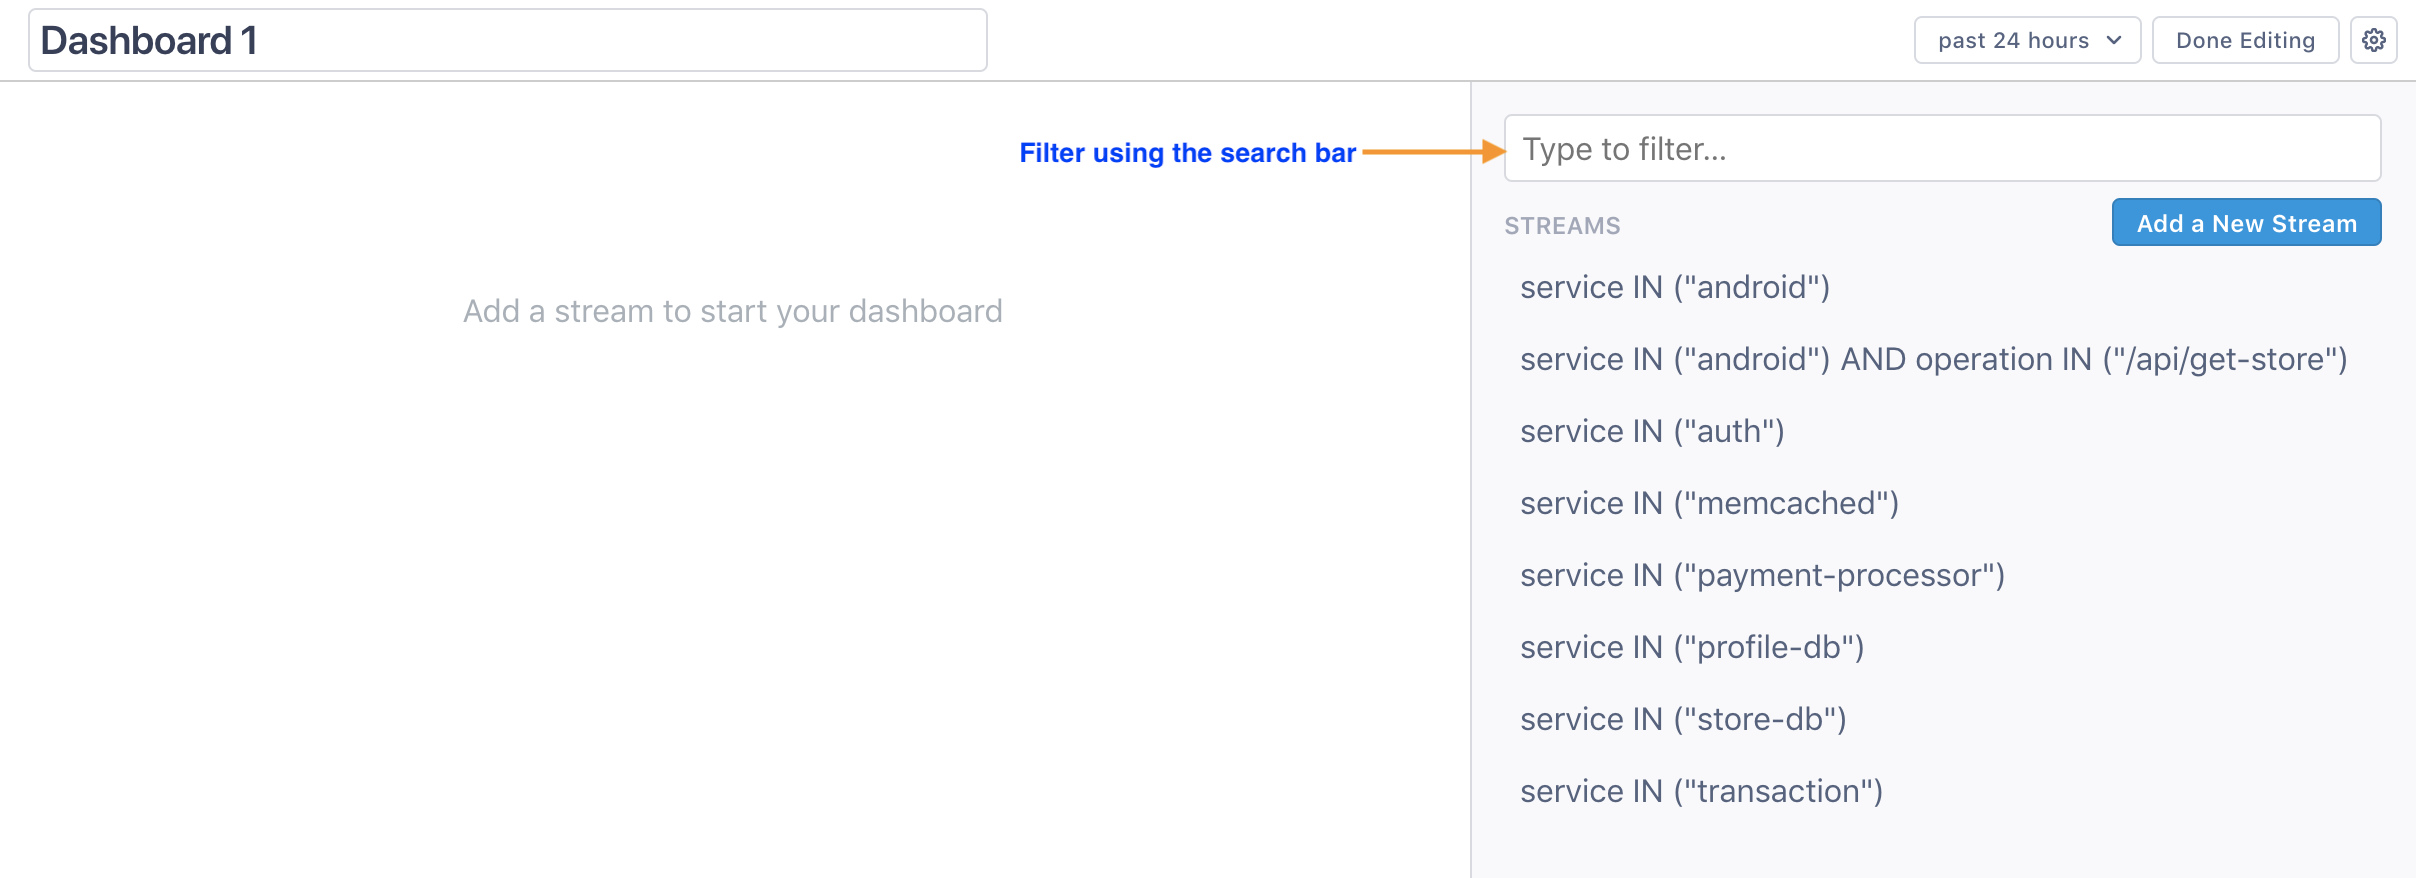
A dashboard workspace opens, listing all available Streams on the right. It’s given a default name, but you can click into the name to change it.
-
Click a Stream to add it to the dashboard. You can use the search bar at the top to search for a specific Stream. You can also create a new Stream by clicking Add a New Stream and running a query.
To run a query using the Query Builder:
Click into the search bar to open the Query Builder. You can build queries for services, operations, and attributes. UseINorNOT INto build the query. When you click into the Service or Operation field, the builder displays valid values.
When you add multiple values to the Operation field, spans that match either value (ORoperation) are returned.
Learn more about running queries
Supported query keys
Query multiple keys and values
Cloud Observability starts collecting data for a Stream immediately after you create it, so it may take some time for the data to populate.
-
Rename or remove a Stream using the gear icon at the top right of the Stream.
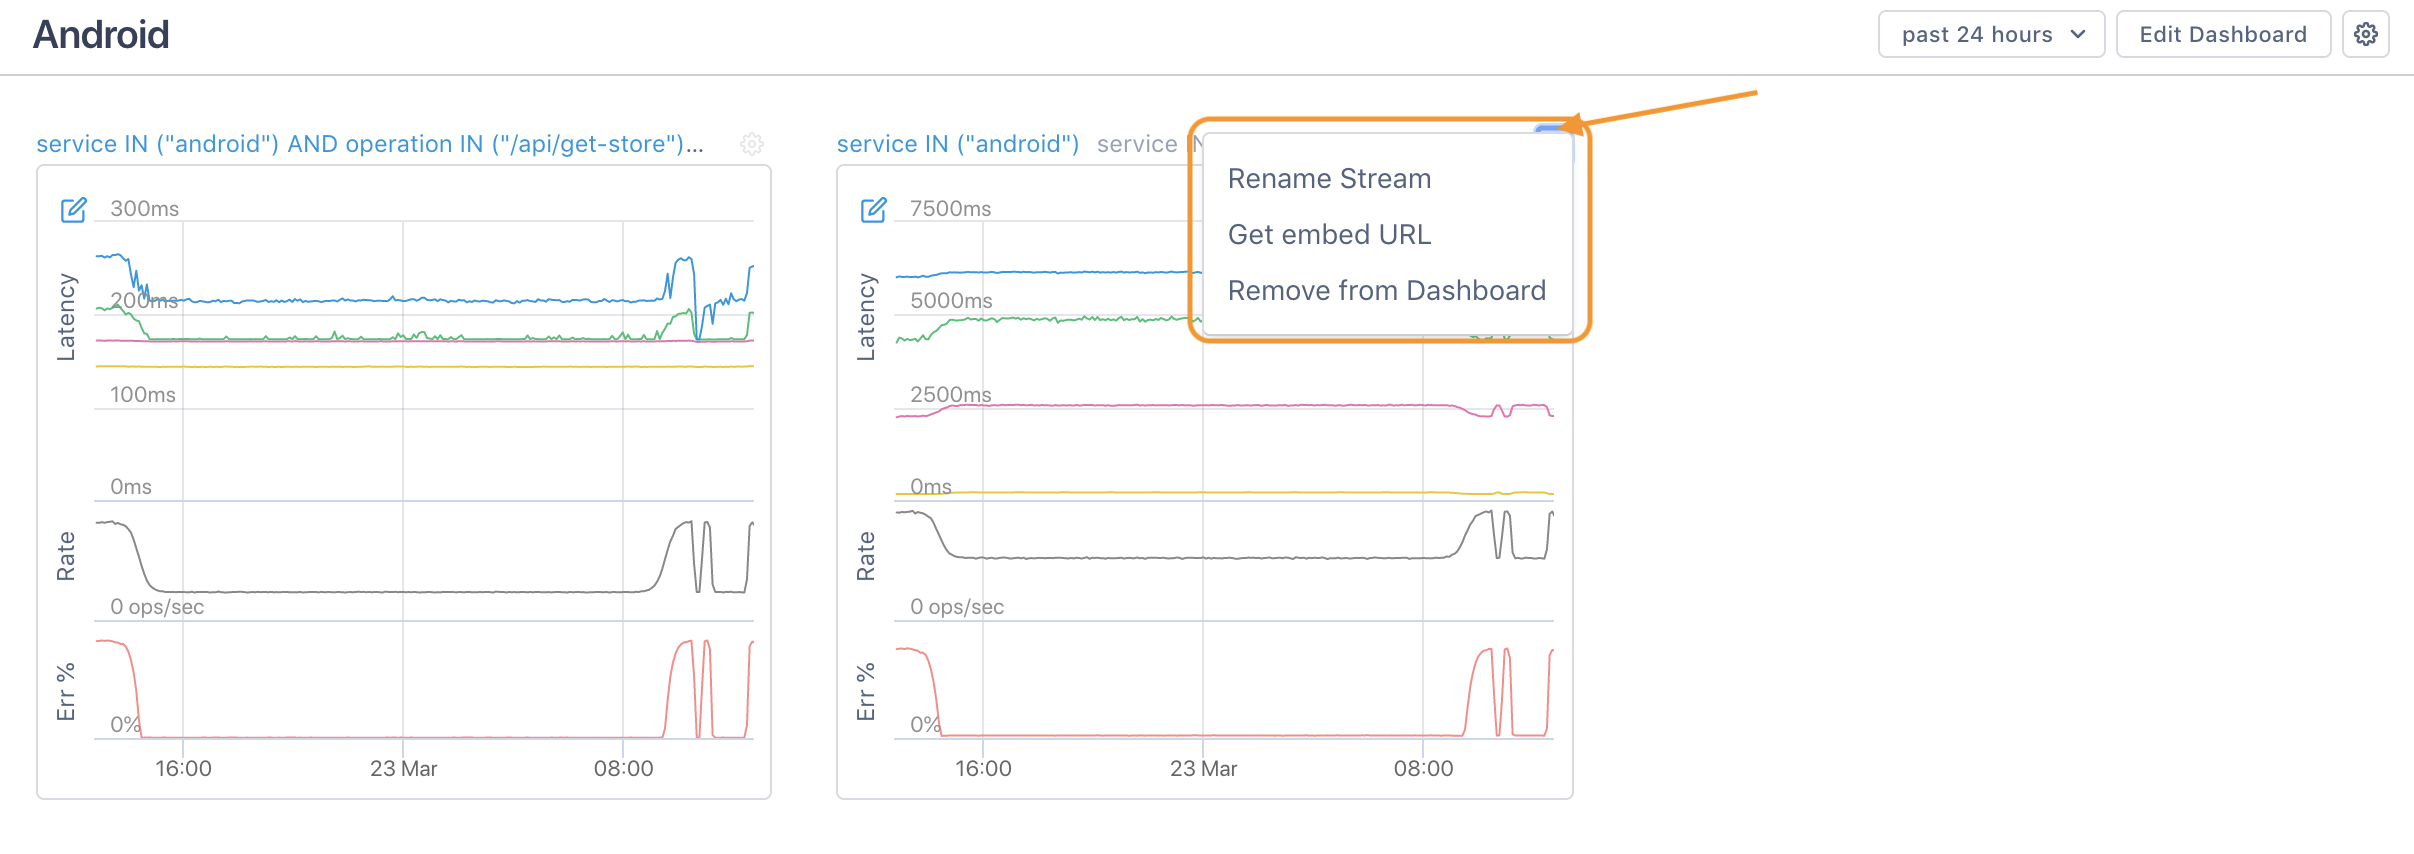
Renaming a Stream from here renames it everywhere in Cloud Observability.
-
Continue adding Streams as needed. You can rearrange Streams by dragging and dropping them.
-
When you’re done creating the dashboard, click Done Editing.
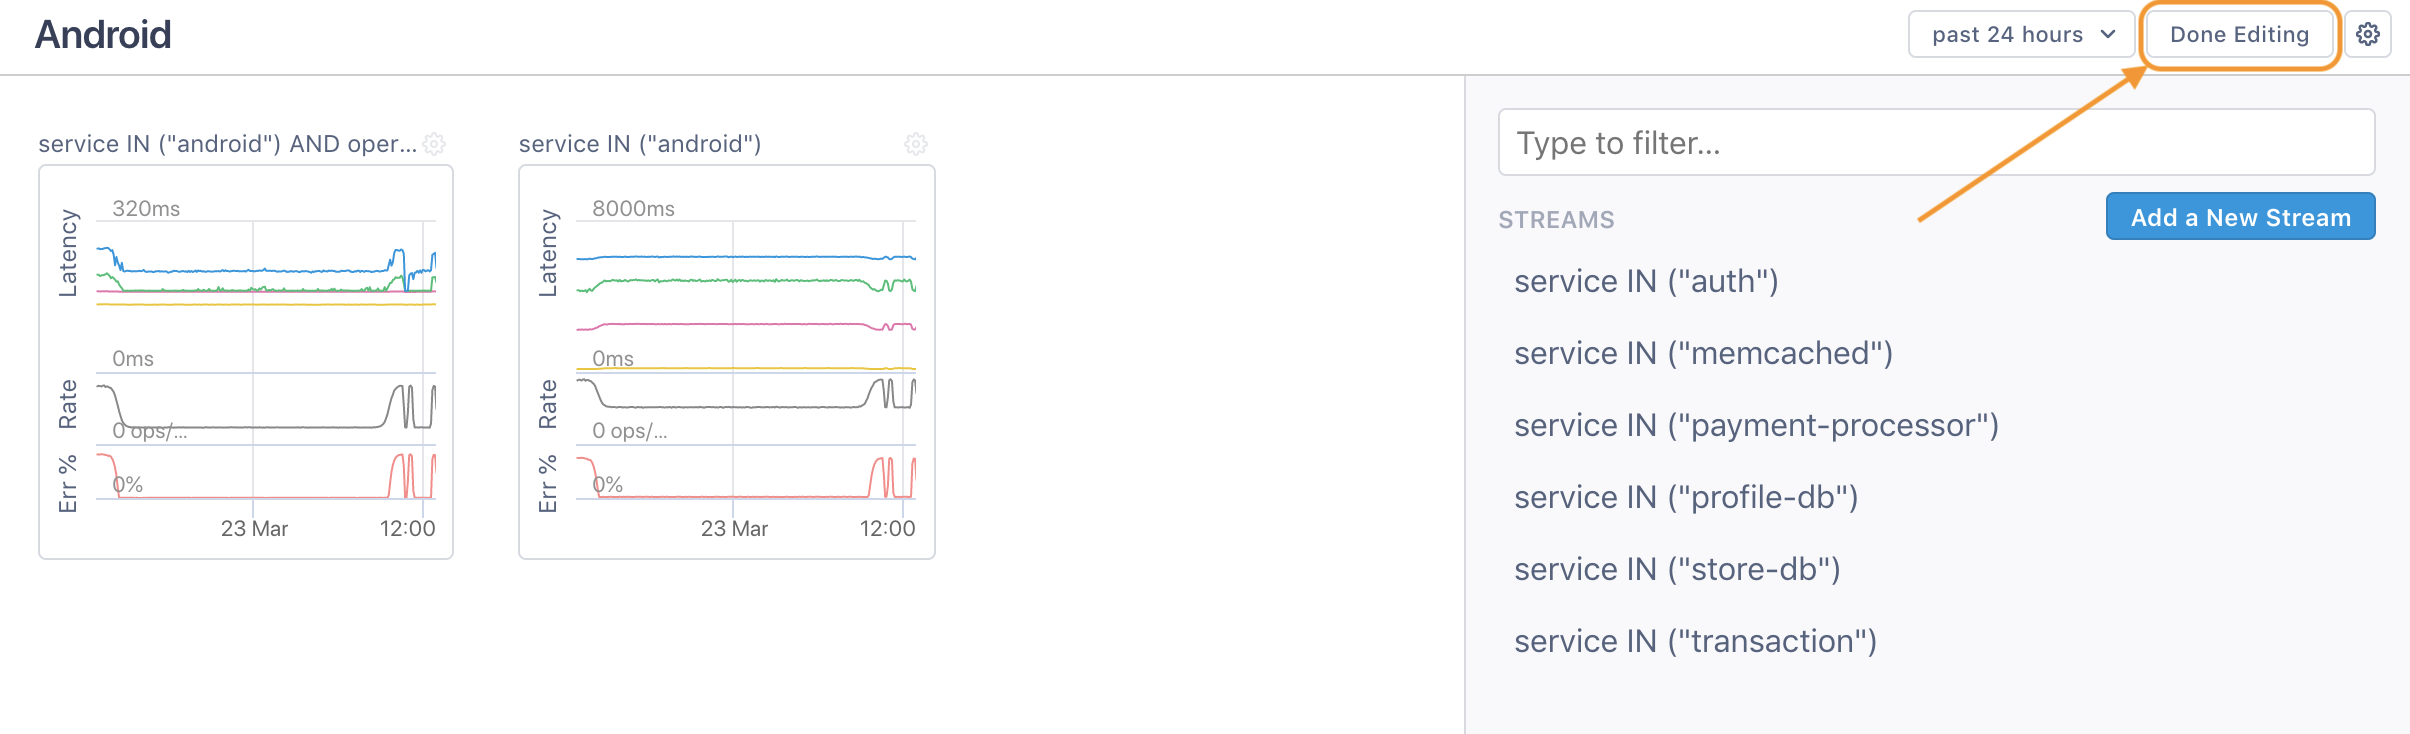
The workspace closes and the dashboard displays.
Edit a dashboard
You can add, remove, and rearrange Streams in a dashboard.
To edit a dashboard:
-
From the navigation bar, click Dashboards and choose the dashboard to edit.
-
At the top right, click Edit Dashboard.
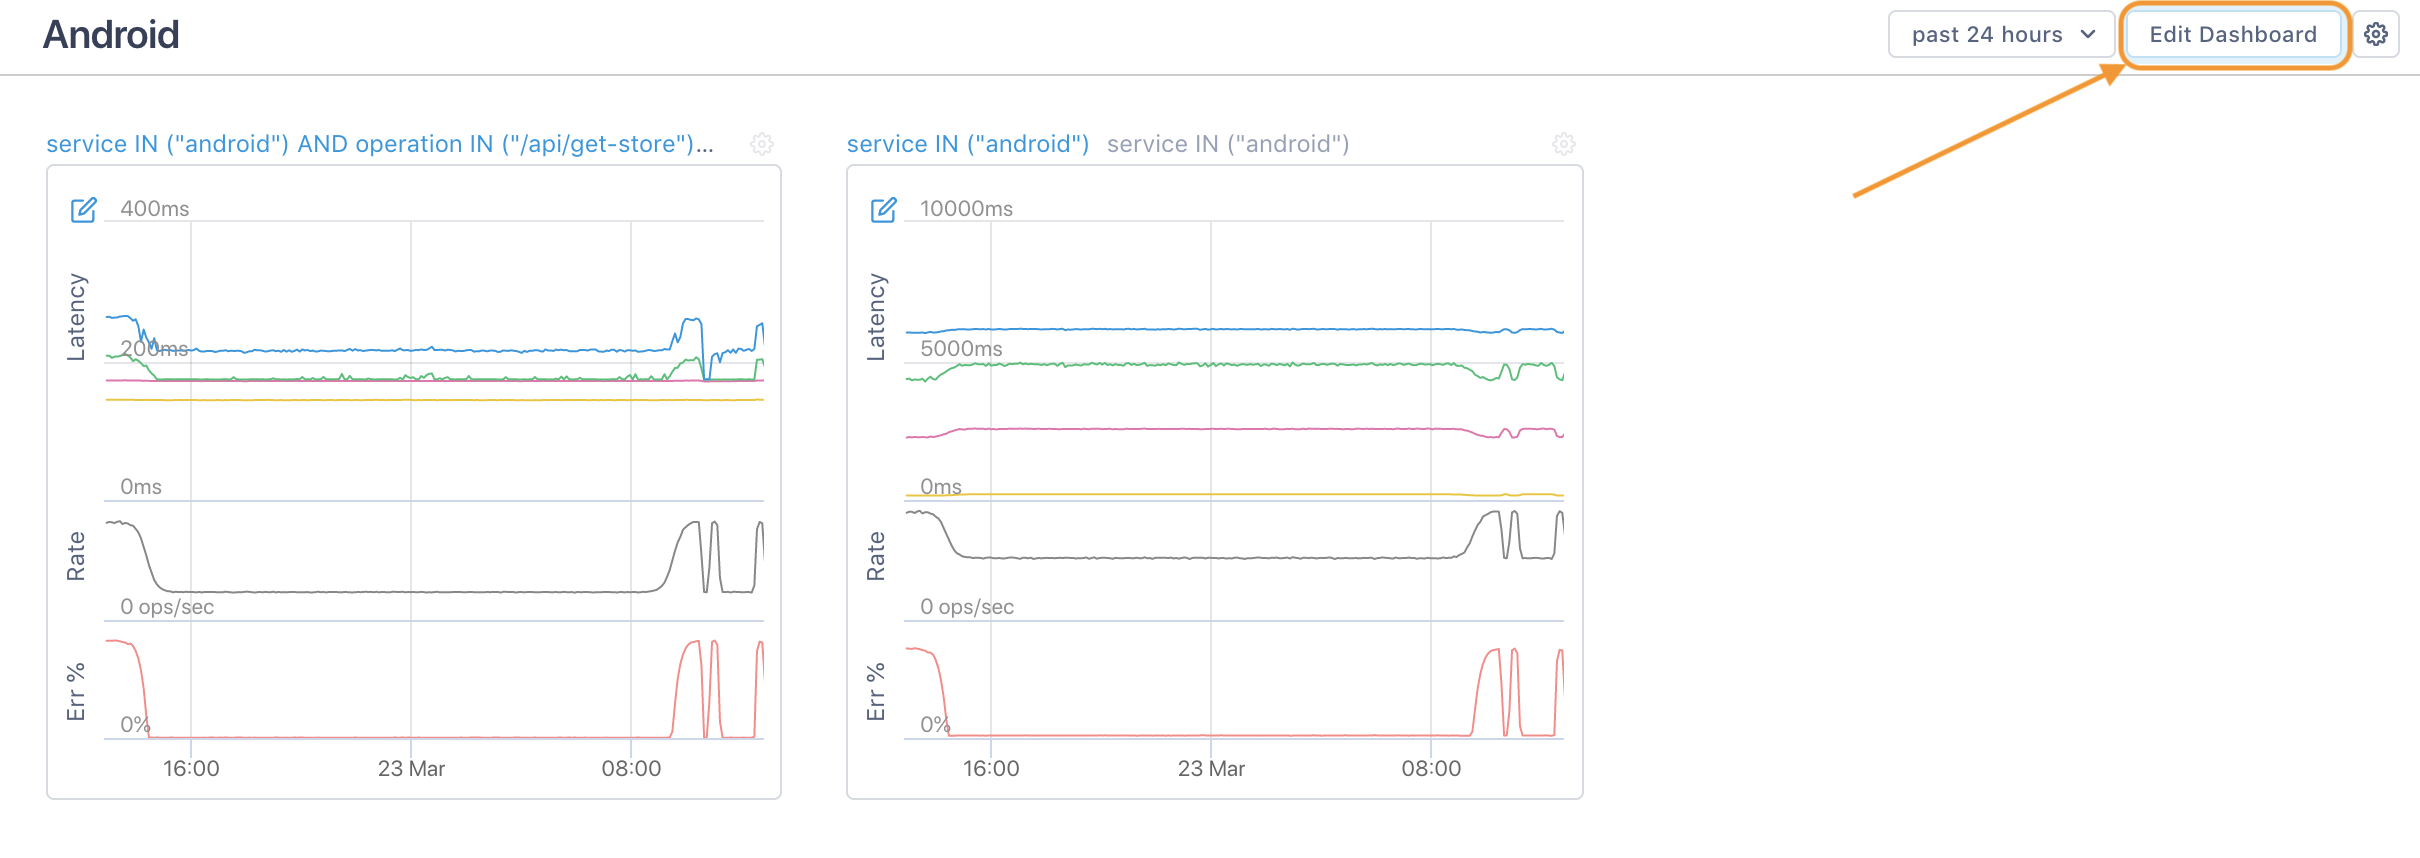
- The dashboard opens in the workspace.
You can:- Add Streams by selecting them from the right.
- Rearrange Streams by dragging and dropping them.
- Remove or rename Streams using the gear icon in the Stream’s upper right corner.
- Rename the dashboard by editing the name directly.
- When finished, click Done Editing to save your changes.
Clone a dashboard
You can copy a dashboard to start another.
To clone a dashboard:
-
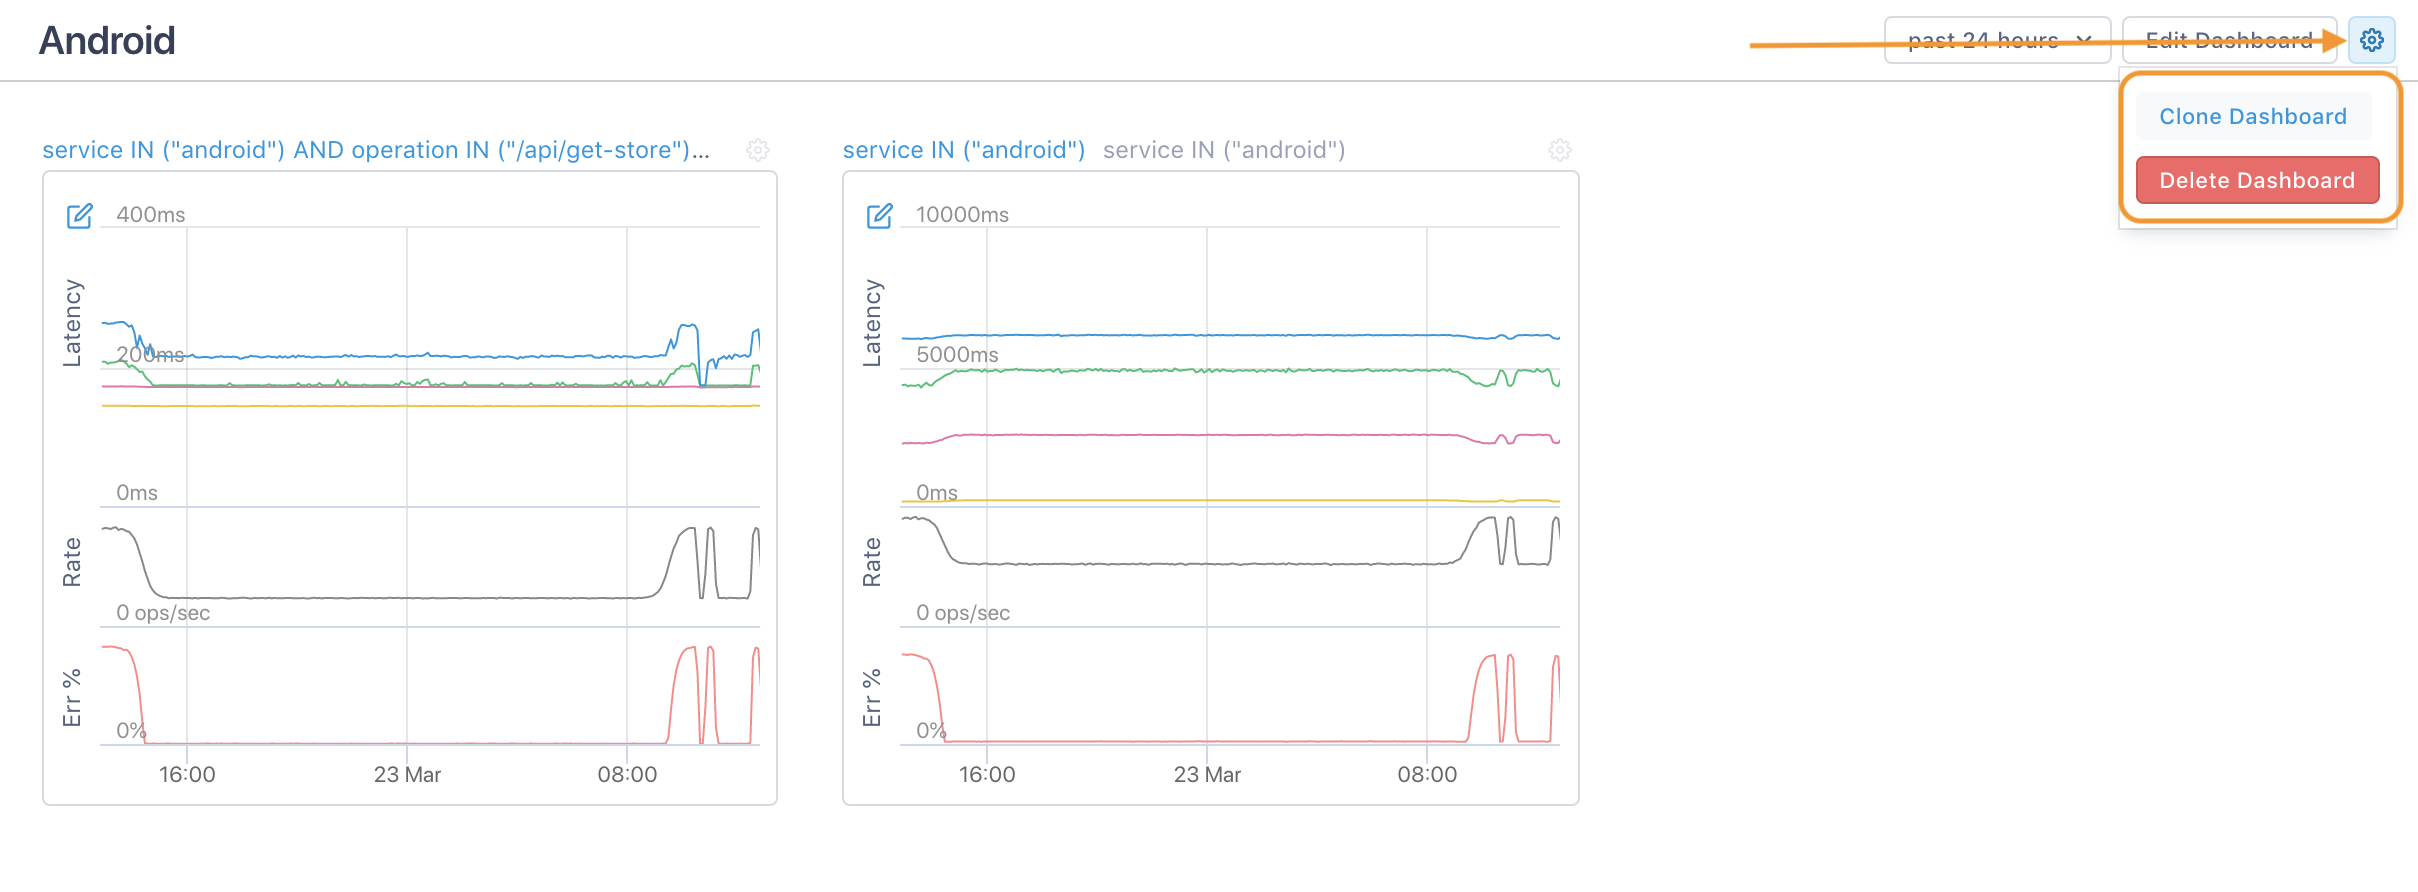
Open a dashboard and use the gear icon at the top right to select Clone Dashboard.
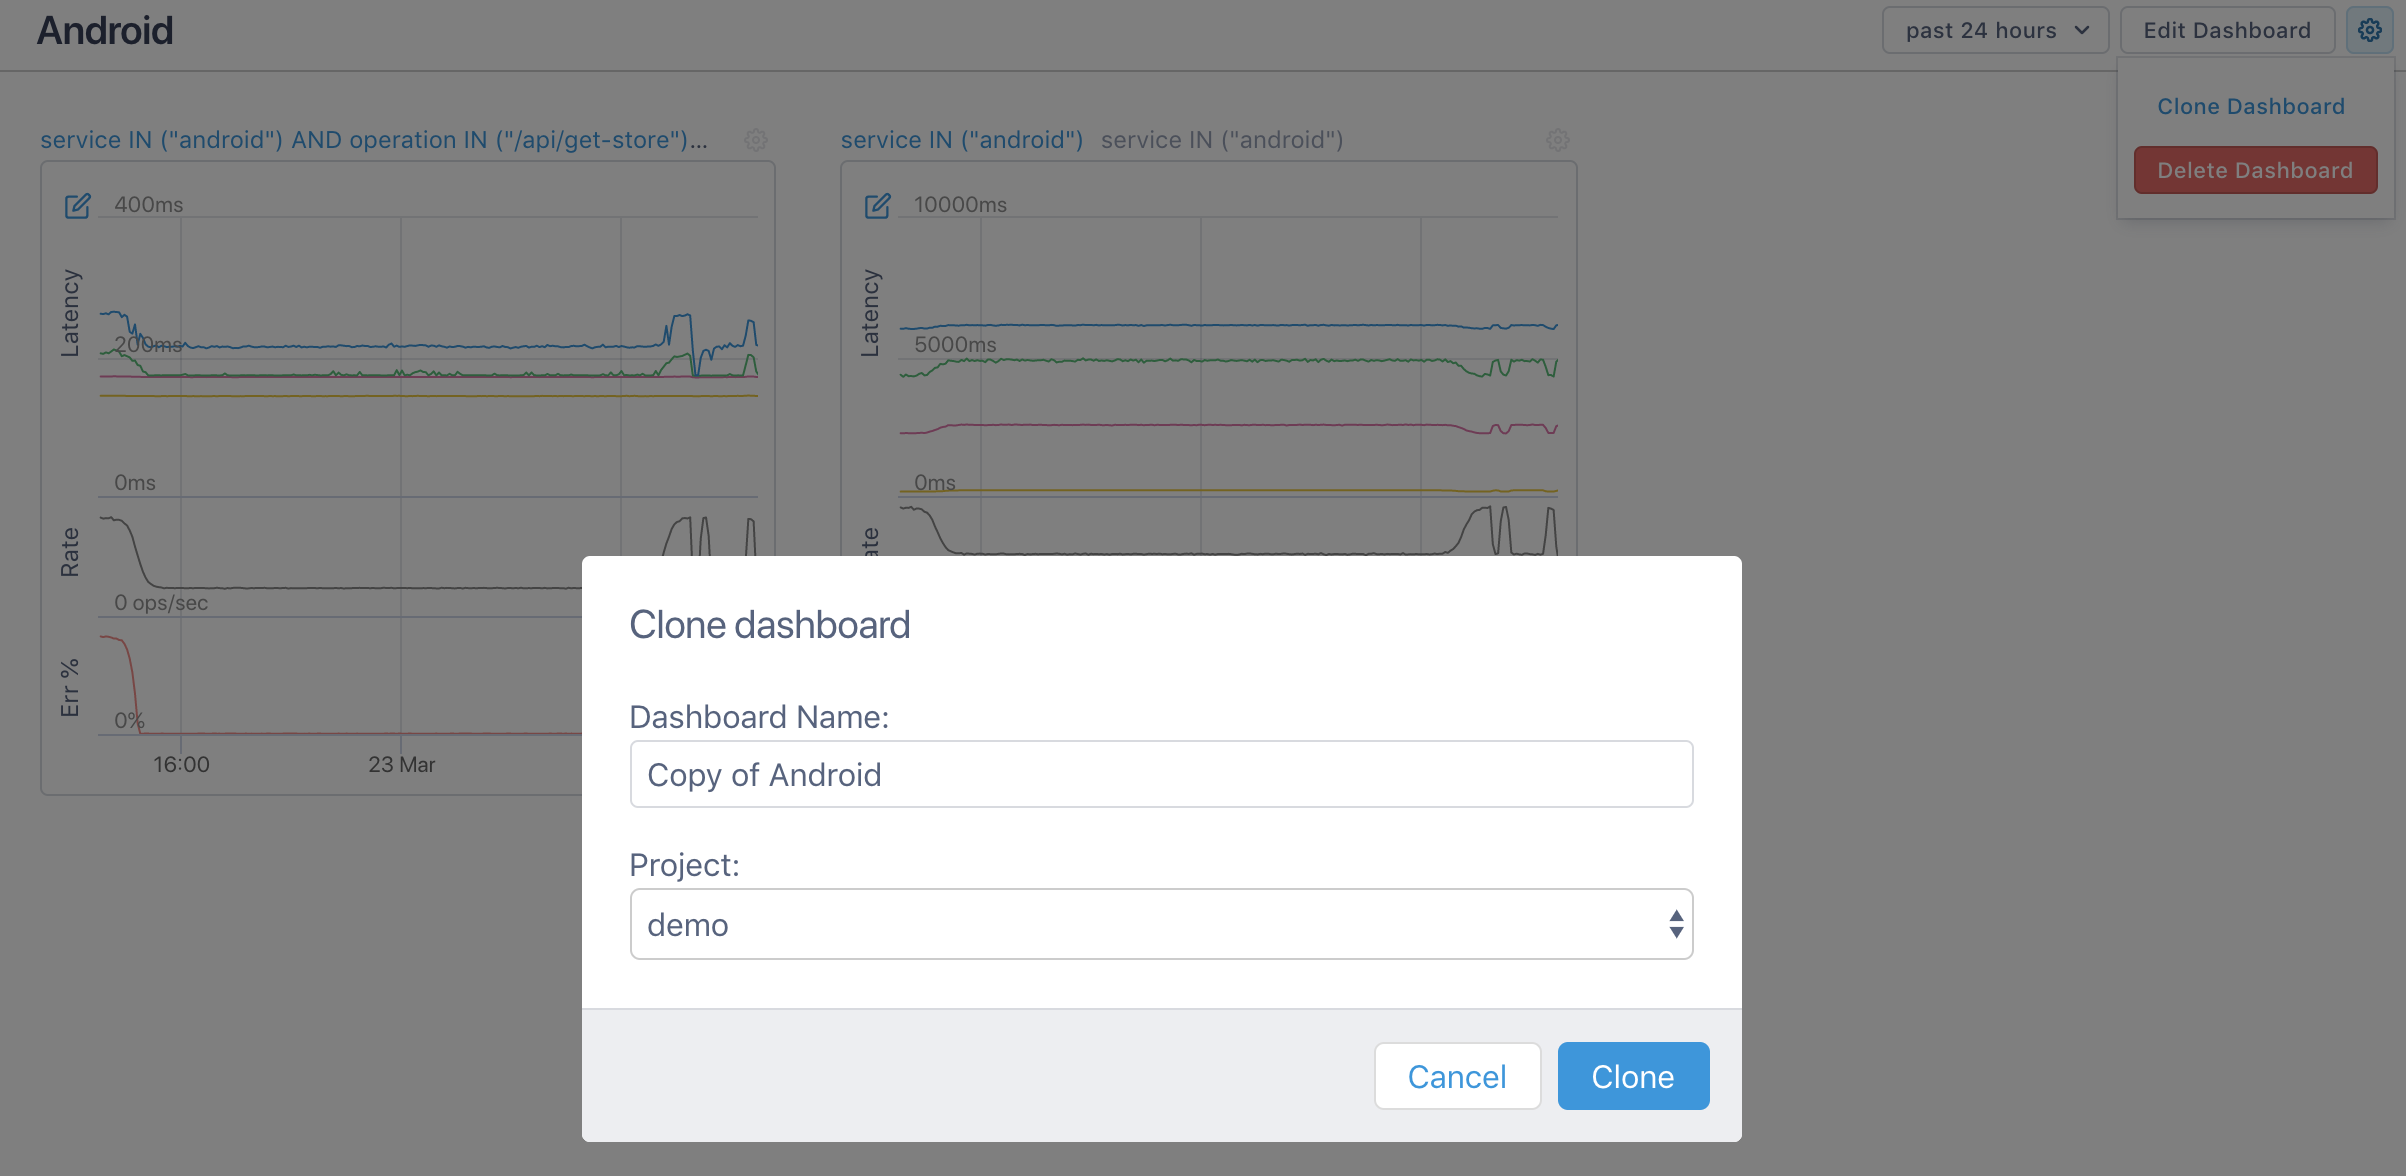
-
Enter a new name for the dashboard, select the project to include the dashboard in, and click Clone.
If you select a project that the Streams are not currently included in, they will be created for that project.
-
Edit the dashboard as needed and save.
Delete a dashboard
Deleting a dashboard only deletes the dashboard. The Streams are still available.
You can delete a dashboard from the Dashboard list view.
Click the More ( ⋮ ) icon, select Delete, and click Yes, delete in the dialog.
You can’t delete and then restore dashboards created from tri-charts.
If you delete a dashboard from the dashboard view (and not the list view), Cloud Observability auto-generates a new dashboard for you. This can result in an infinite loop of deleting then creating dashboards.
Updated Oct 20, 2020