
A standard method of identifying the root cause of a performance regression is to manually comb through traces and search for common system attributes associated with that regression. With Correlations, Cloud Observability helps you find attributes correlated with latency and errors automatically.
Correlations search over all the span data in all traces that the current query participates in and finds patterns in that data for latency and error contribution, looking at service/operation pairs and attributes. This analysis allows you to identify services, operations, and attributes that are meaningfully associated with observed regressions. By surfacing statistical relationships between these system attributes, you can quickly generate and validate hypotheses during a root cause investigation.
View correlations
Correlations are shown to the right of the Trace Analysis table and reflect the current data returned by the query. If you select a range in the histogram, correlations are redetermined based on that range. There are separate tabs for latency and error correlations.
The correlations are sorted in descending order based on the absolute value of the correlation score. 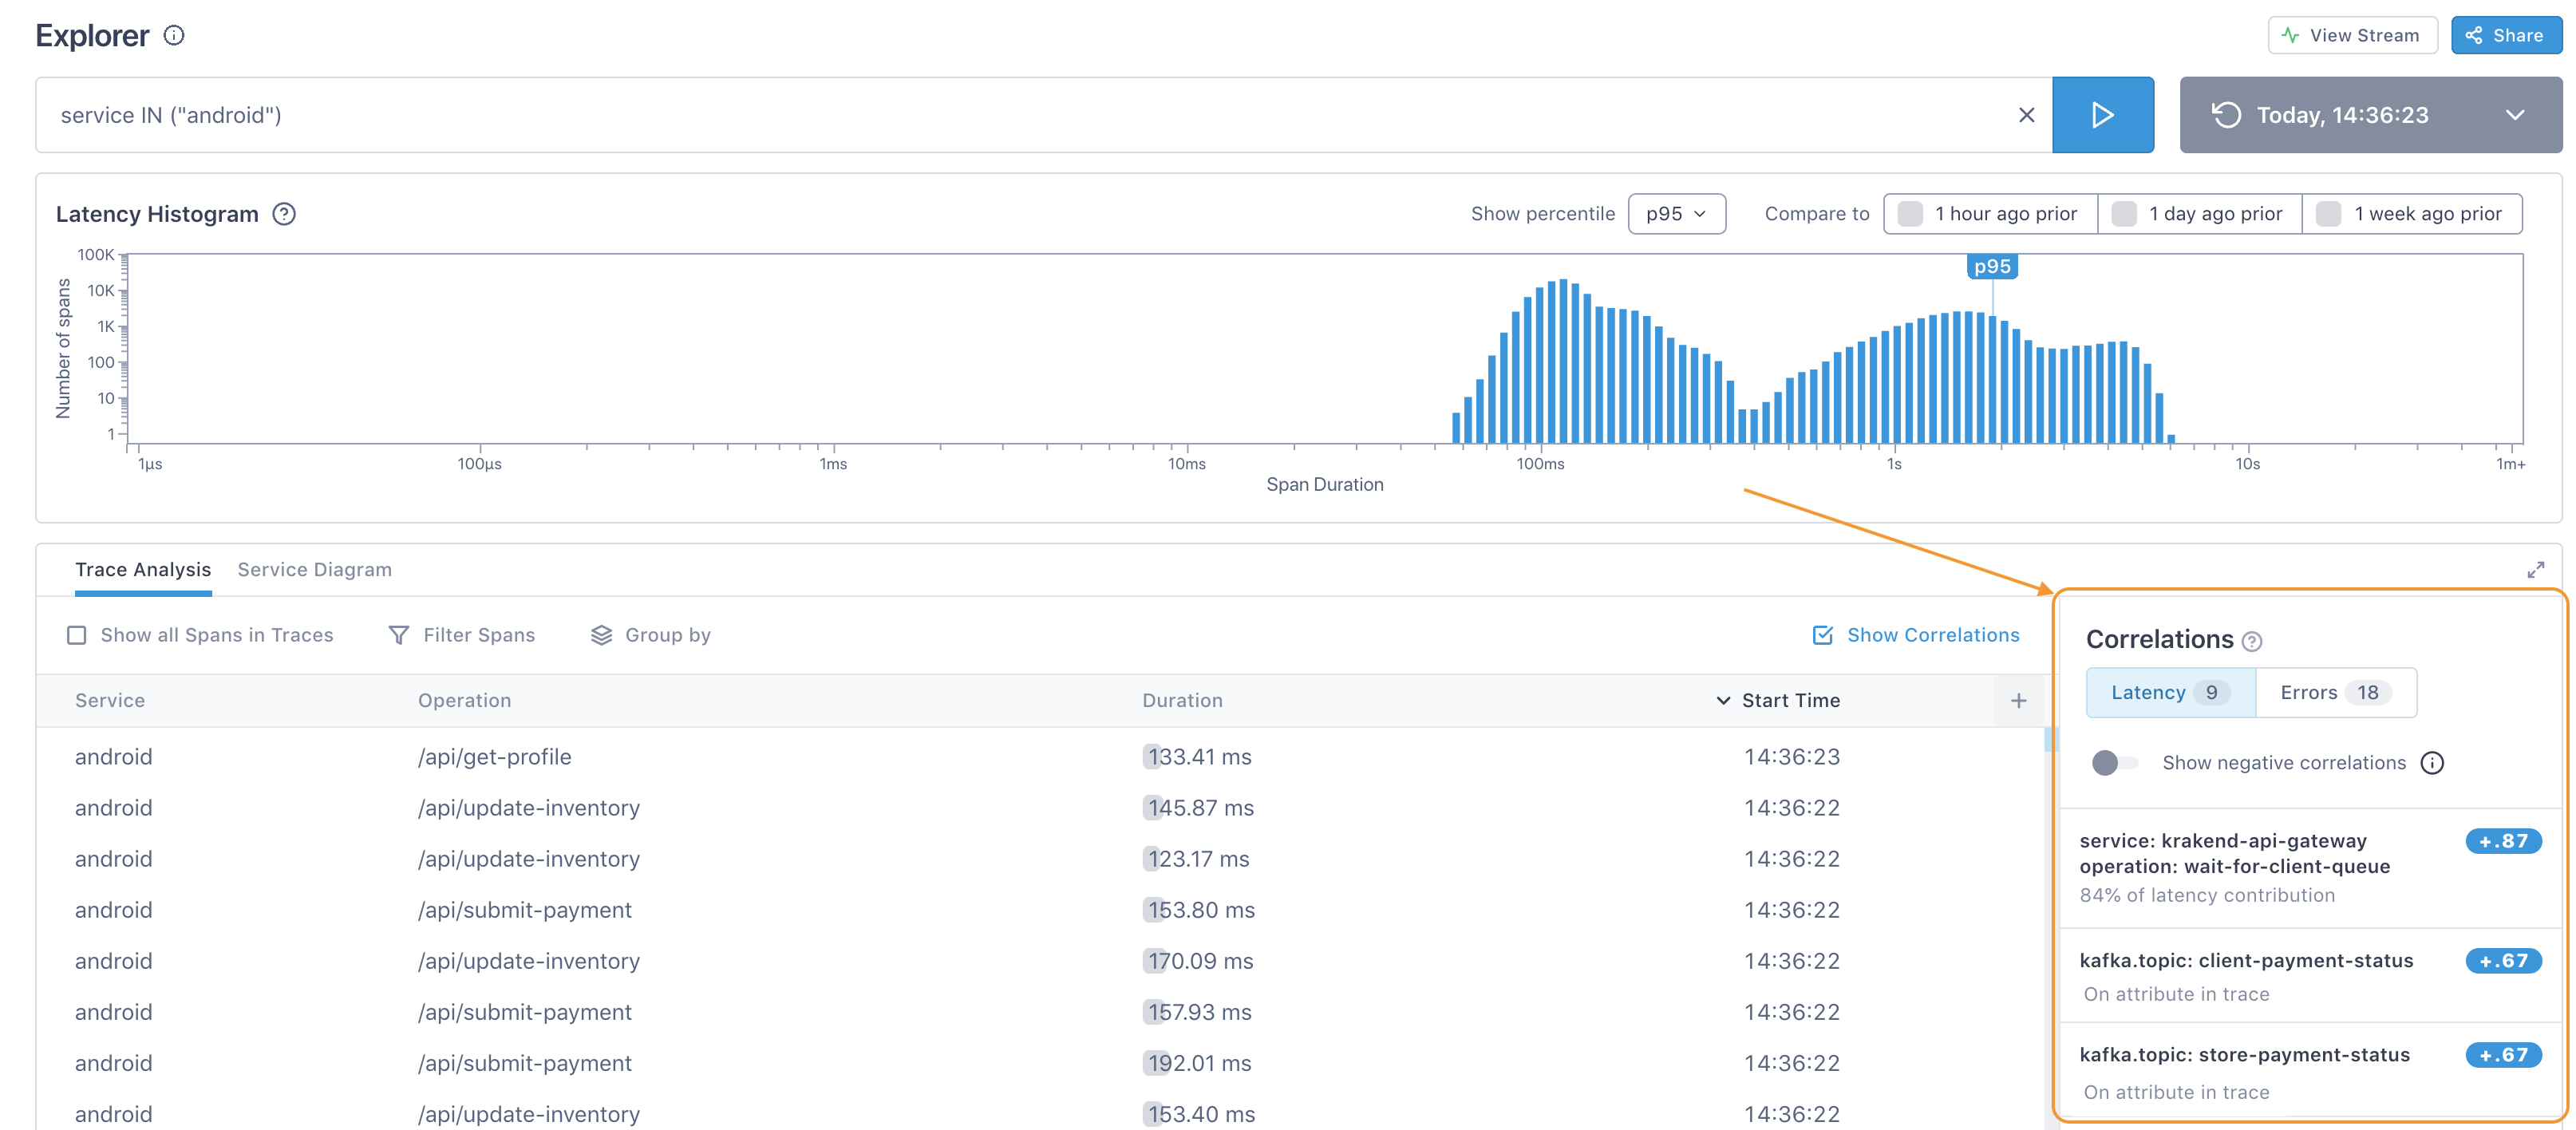
There are three types of correlations:
- Service/operation pair (latency only): Shows the percentage of latency contribution to the critical path.
- Attribute in the trace: The attribute appears on a span in the trace (but not currently in the results because it did not match the query).
- Attribute in the result: The attribute appears on a span that is in the result set.
Correlation scores fall between -1 and +1 and are determined as follows:
- +1: The attribute is only found in the selected latency range. So the closer to +1, the higher the chance that the attribute is causing latency in the currently selected range in the histogram.
- -1: The attribute is never found in the selected latency range. So the closer to -1, the less chance that attribute has anything to do with latency.
- 0: The attribute is equally likely to be found inside and outside of the selected latency range and thus has no statistical relationship to the latency.
Increase correlation accuracy
By default, the Trace Analysis table shows only spans that match the query. To get greater accuracy with correlations, you need a more holistic view to find a downstream issue. Click Show all Spans in Traces in the Trace Analysis table to include all spans that contribute to the trace.
Find latency using correlations
Correlations allow you to quickly find attributes that are contributing to latency.
View correlations in the histogram to determine impact
Hover over a correlation to see the latency for that attribute overlayed in the histogram. For example, in this histogram, the operation wait-for-client-queue on the krakend-api-gateway service shows a high correlation for spans in the p95 and above range. It does not seem to have much of a correlation with lower latency. 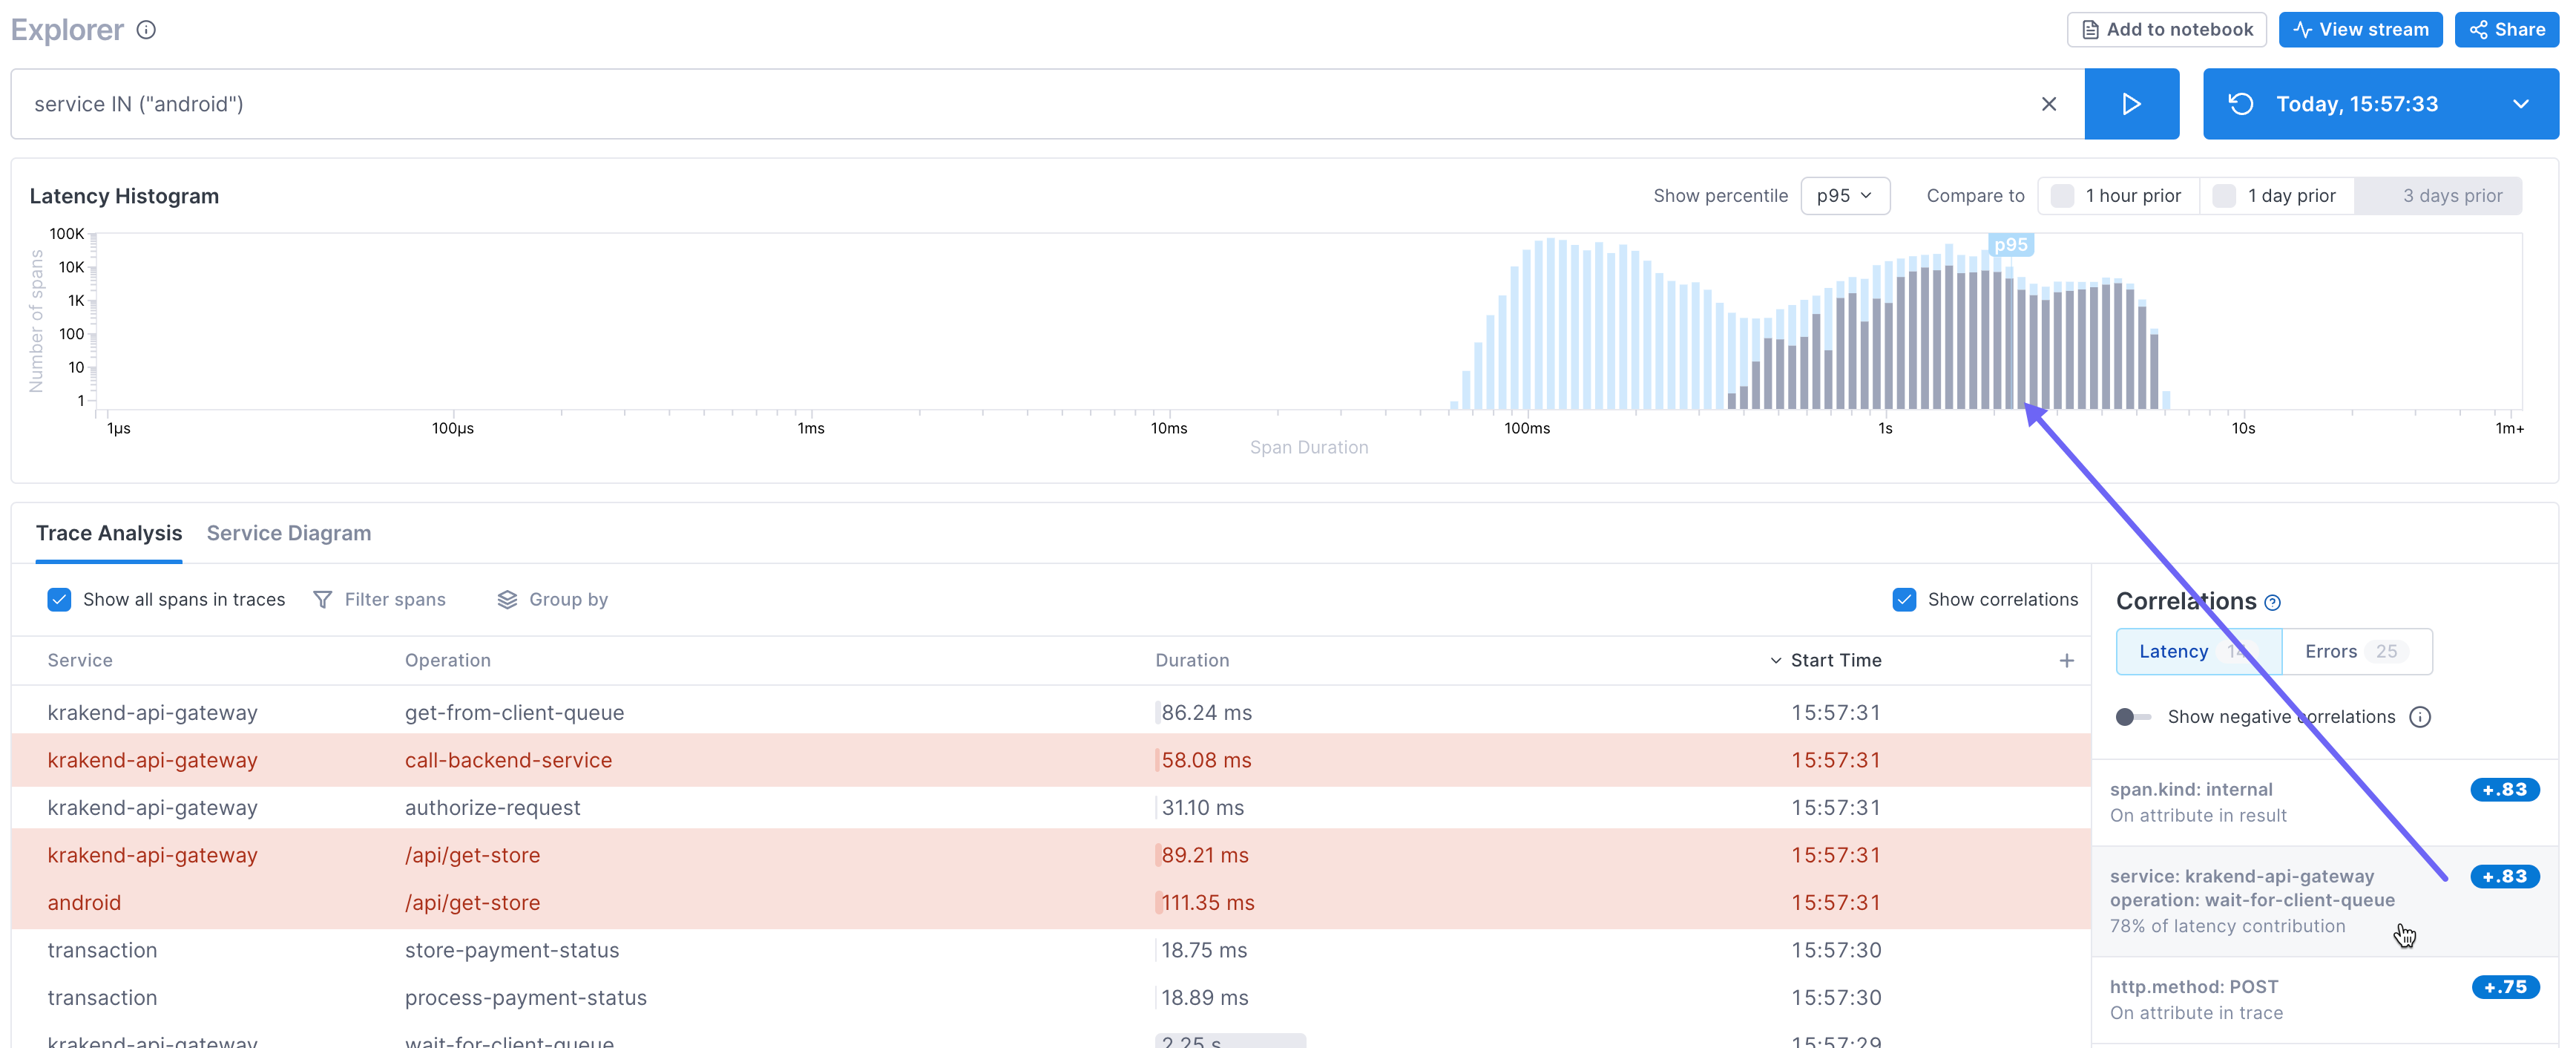
Selecting the correlation allows you to easily refine the results in the Trace Analysis table to quickly reach hypothetical causes for latency. For example, you may want to group by the correlated attribute to see if there are a number of services impacted.
Filter the Trace Analysis table
Click on a correlation and choose Filter by to show only results that match that criteria.
Group the Trace Analysis table
To get a comparison of how different values for a service, operation, or attribute might contribute to latency or errors, you can group results.
Click Group by to group by the attribute in the Correlations panel.
Click on a group to see span data just for that group. Cloud Observability shows you the average latency, the error percentage, and the number of spans in that group.
Troubleshoot correlations
Cloud Observability needs significant data to create correlations. You may see errors when there is not enough data to determine correlations.
No correlations
If no correlations are returned, then there are no strong correlations found in the selected region.
This indicates that there are no system attributes that correlate strongly inside of the selected latency region (in comparison with the region outside the selection). To see strong enough correlations, try adjusting your query or histogram selection.
Less than 50 traces
Cloud Observability needs at least 50 traces to compile meaningful correlations. If your query results set or if the range you selected in the histogram has less than 50, you get a warning.
Adjust your query or increase the selected area in the histogram to include more traces.
Based on low data
The Correlations panel displays a warning when the amount of data from the query was not enough to determine true correlations. You have over 50 traces, so correlations can be compiled, but they may not provide a good signal.
Expand your selection to allow Cloud Observability to analyze a larger data set.
See also
Use Explorer to view span data
Use attributes and log events to find issues fast
Updated Apr 22, 2024