
Often events outside of what your telemetry data sends can affect the performance of your system. For example, commits and merges to an environment might introduce errors or latency. Or the deployment of a feature flag might cause changes up or downstream. By displaying markers on your dashboards, you can see when an event occurred around the same time as performance changes. 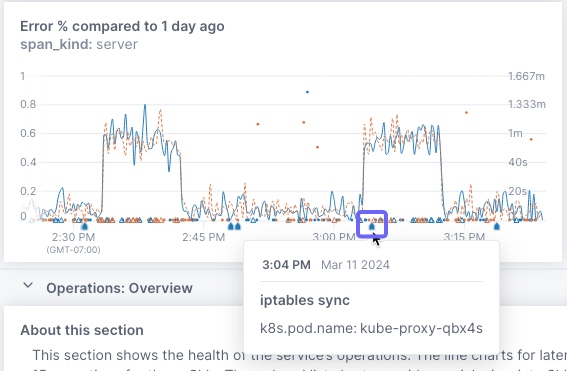
About event markers
You send events to Cloud Observability using a webhook from the source of the event (like GitHub or a feature flag app). Cloud Observability ingests these events as logs and retains them for 13 months.
Event logs are separate from and treated differently than ingested telemetry logs.
Once the webhook is sending data, you create a query on that data to determine when to display the marker. For example, you might create a webhook for a feature flag app and then create separate queries for the different environments flags are deployed to. Or, you might want to base the event marker on specific values returned by the data.
Cloud Observability provides a pre-configured webhook and query for GitHub and you can also create your own custom webhook and query.
If you’re sending telemetry logs to Cloud Observability, you can query those to create events. However, these logs are retained only for the length of your hot storage retention period (default is 3 days). When you use logs for events, you don’t need to create a source.
About event webhooks
You can use most third-party webhooks or you can create a custom webhook. All languages are supported, and the content has no enforced schema.
When creating an event webhook, note the following:
- Use POST to send the request
- Format the payload as JSON
- Don’t include any sensitive data in the payload
- Ensure the third-party can send requests to our inbound IP addresses
Use the pre-built GitHub event marker
When you use the pre-built webhook for GitHub, two queries are created for you. One is for commits to your main branch and the other is for commits to any other branch you choose.
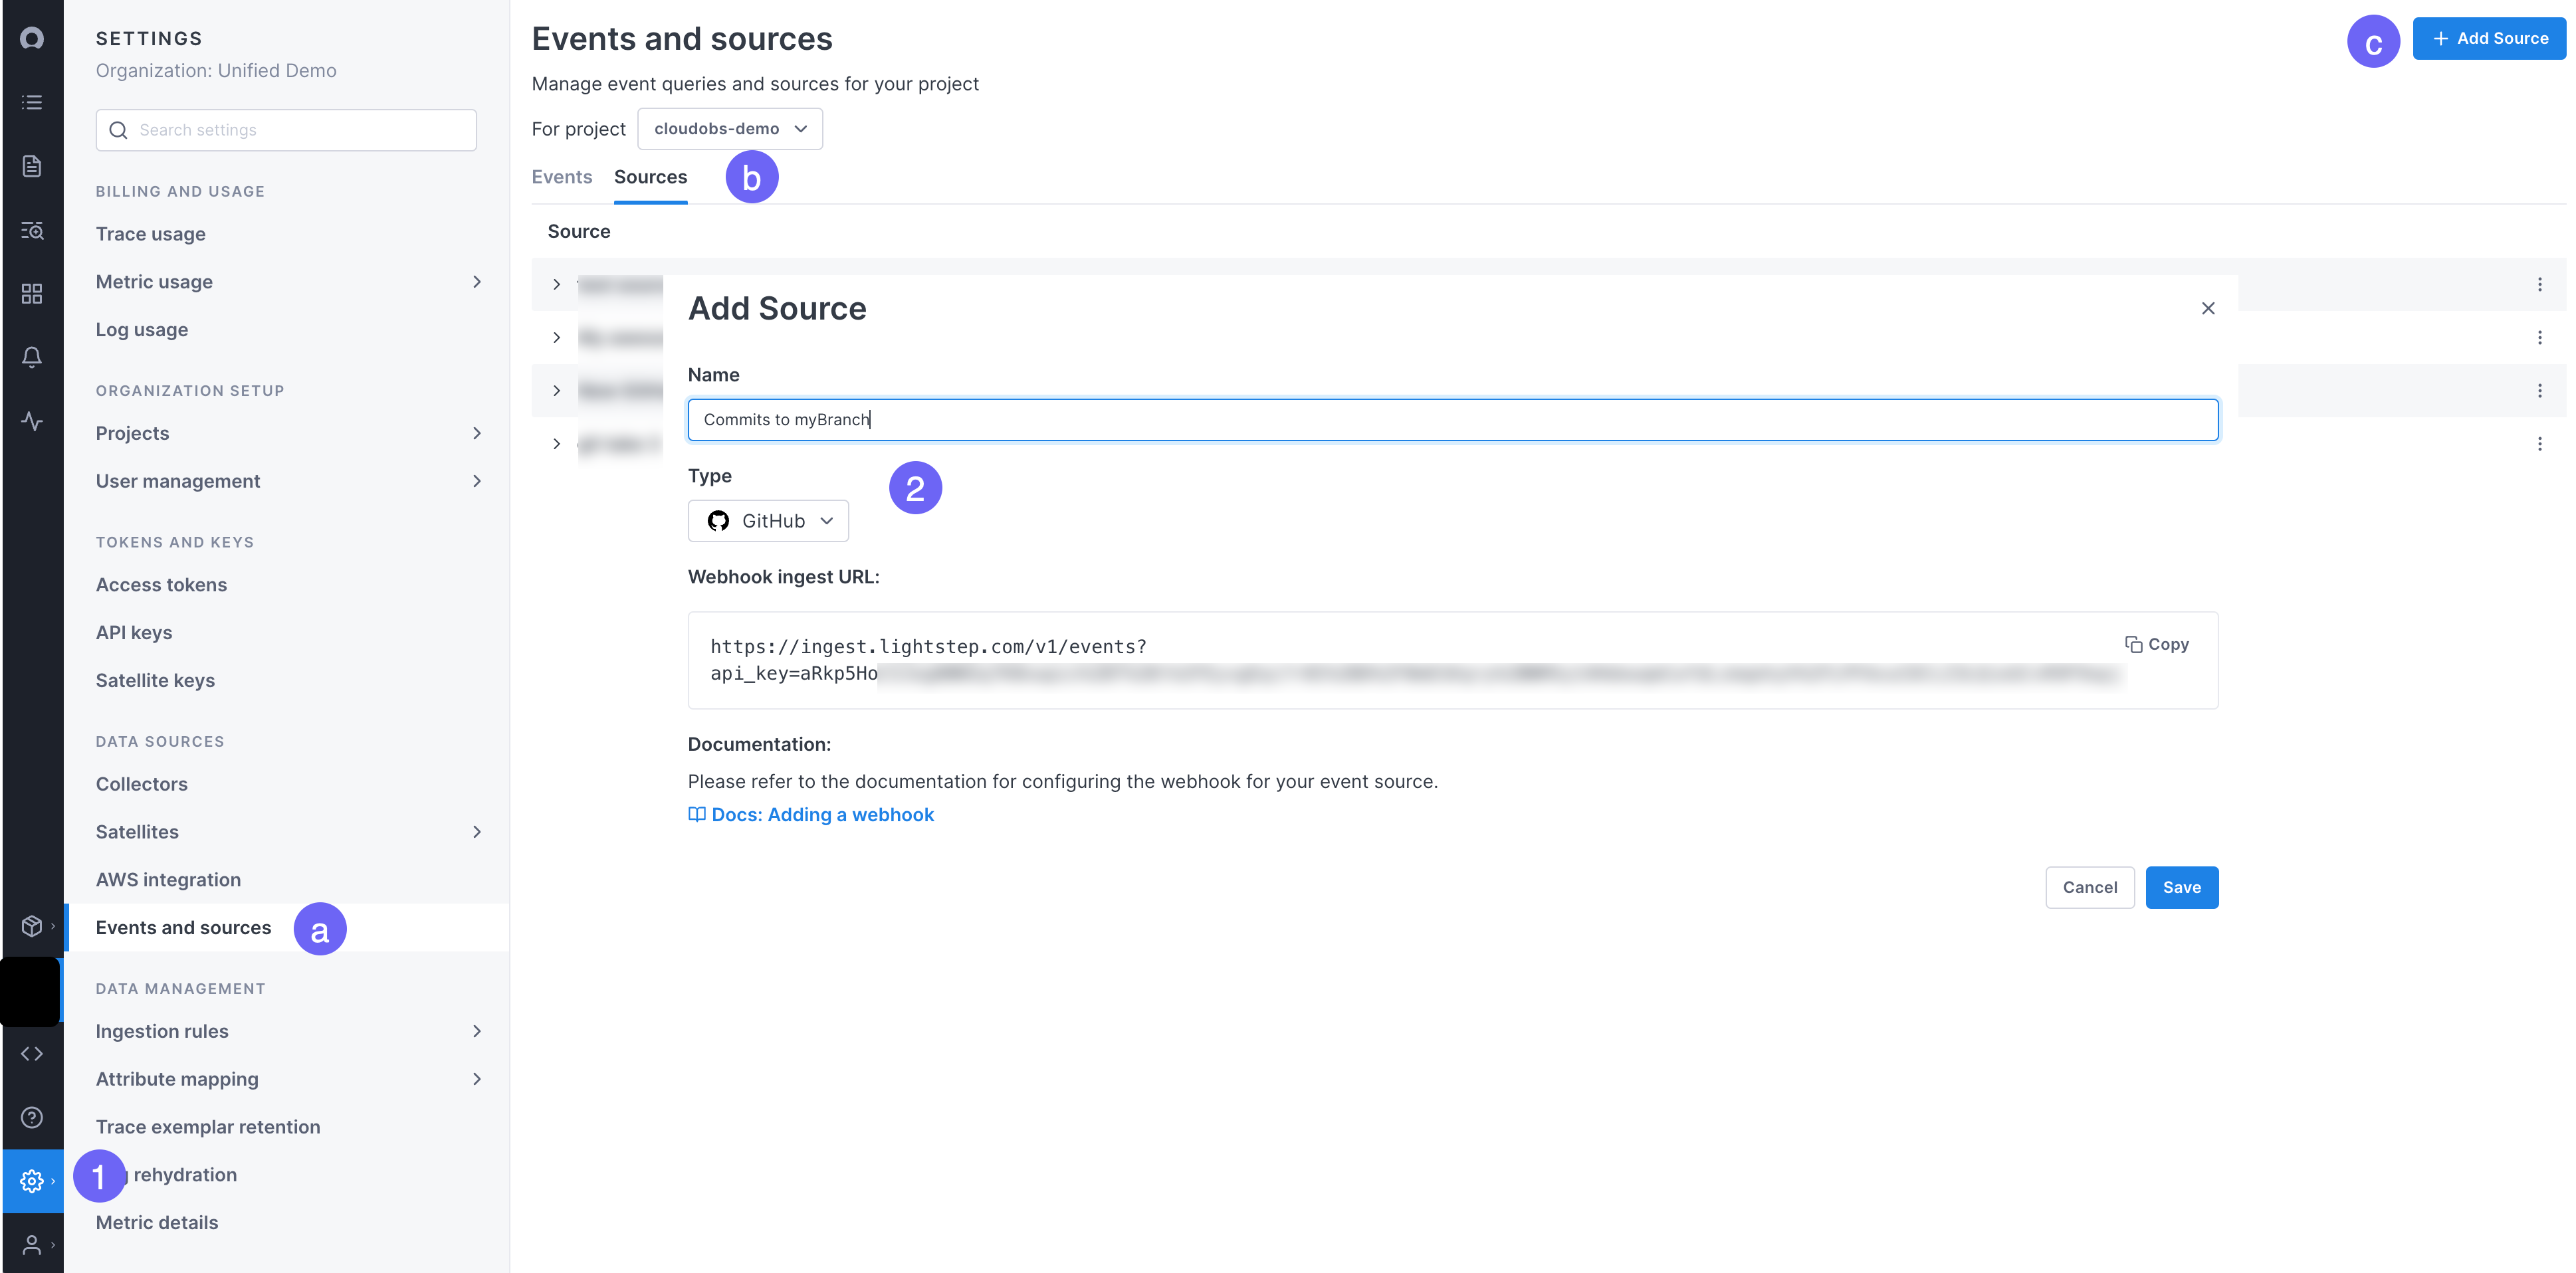
- From the Settings page, select:
- Events and sources
- Then click the Sources tab
- Then click Add source
-
Enter a name for the source and choose GitHub for the type.
The Webhook ingest URL provides the ingest URL, including the access token. Copy that to use in the GitHub webhook creation. Visit the GitHub documentation to learn how to create the webhook using the ingest URL.
Cloud Observability creates an access token for each event source you create. You can manage the tokens from the Access tokens page in Settings.
-
Click the Events tab. Two new event queries named
Commitsnow display. Use the More ( ⋮ ) icon and choose Edit to view the query. Events received in the last hour from the webhook display at the bottom. You can adjust the queries as needed. See Create an event query below for descriptions of each field in the panel.Be sure to edit the
Commits to REPO_NAMEquery to reflect the branch you want to use.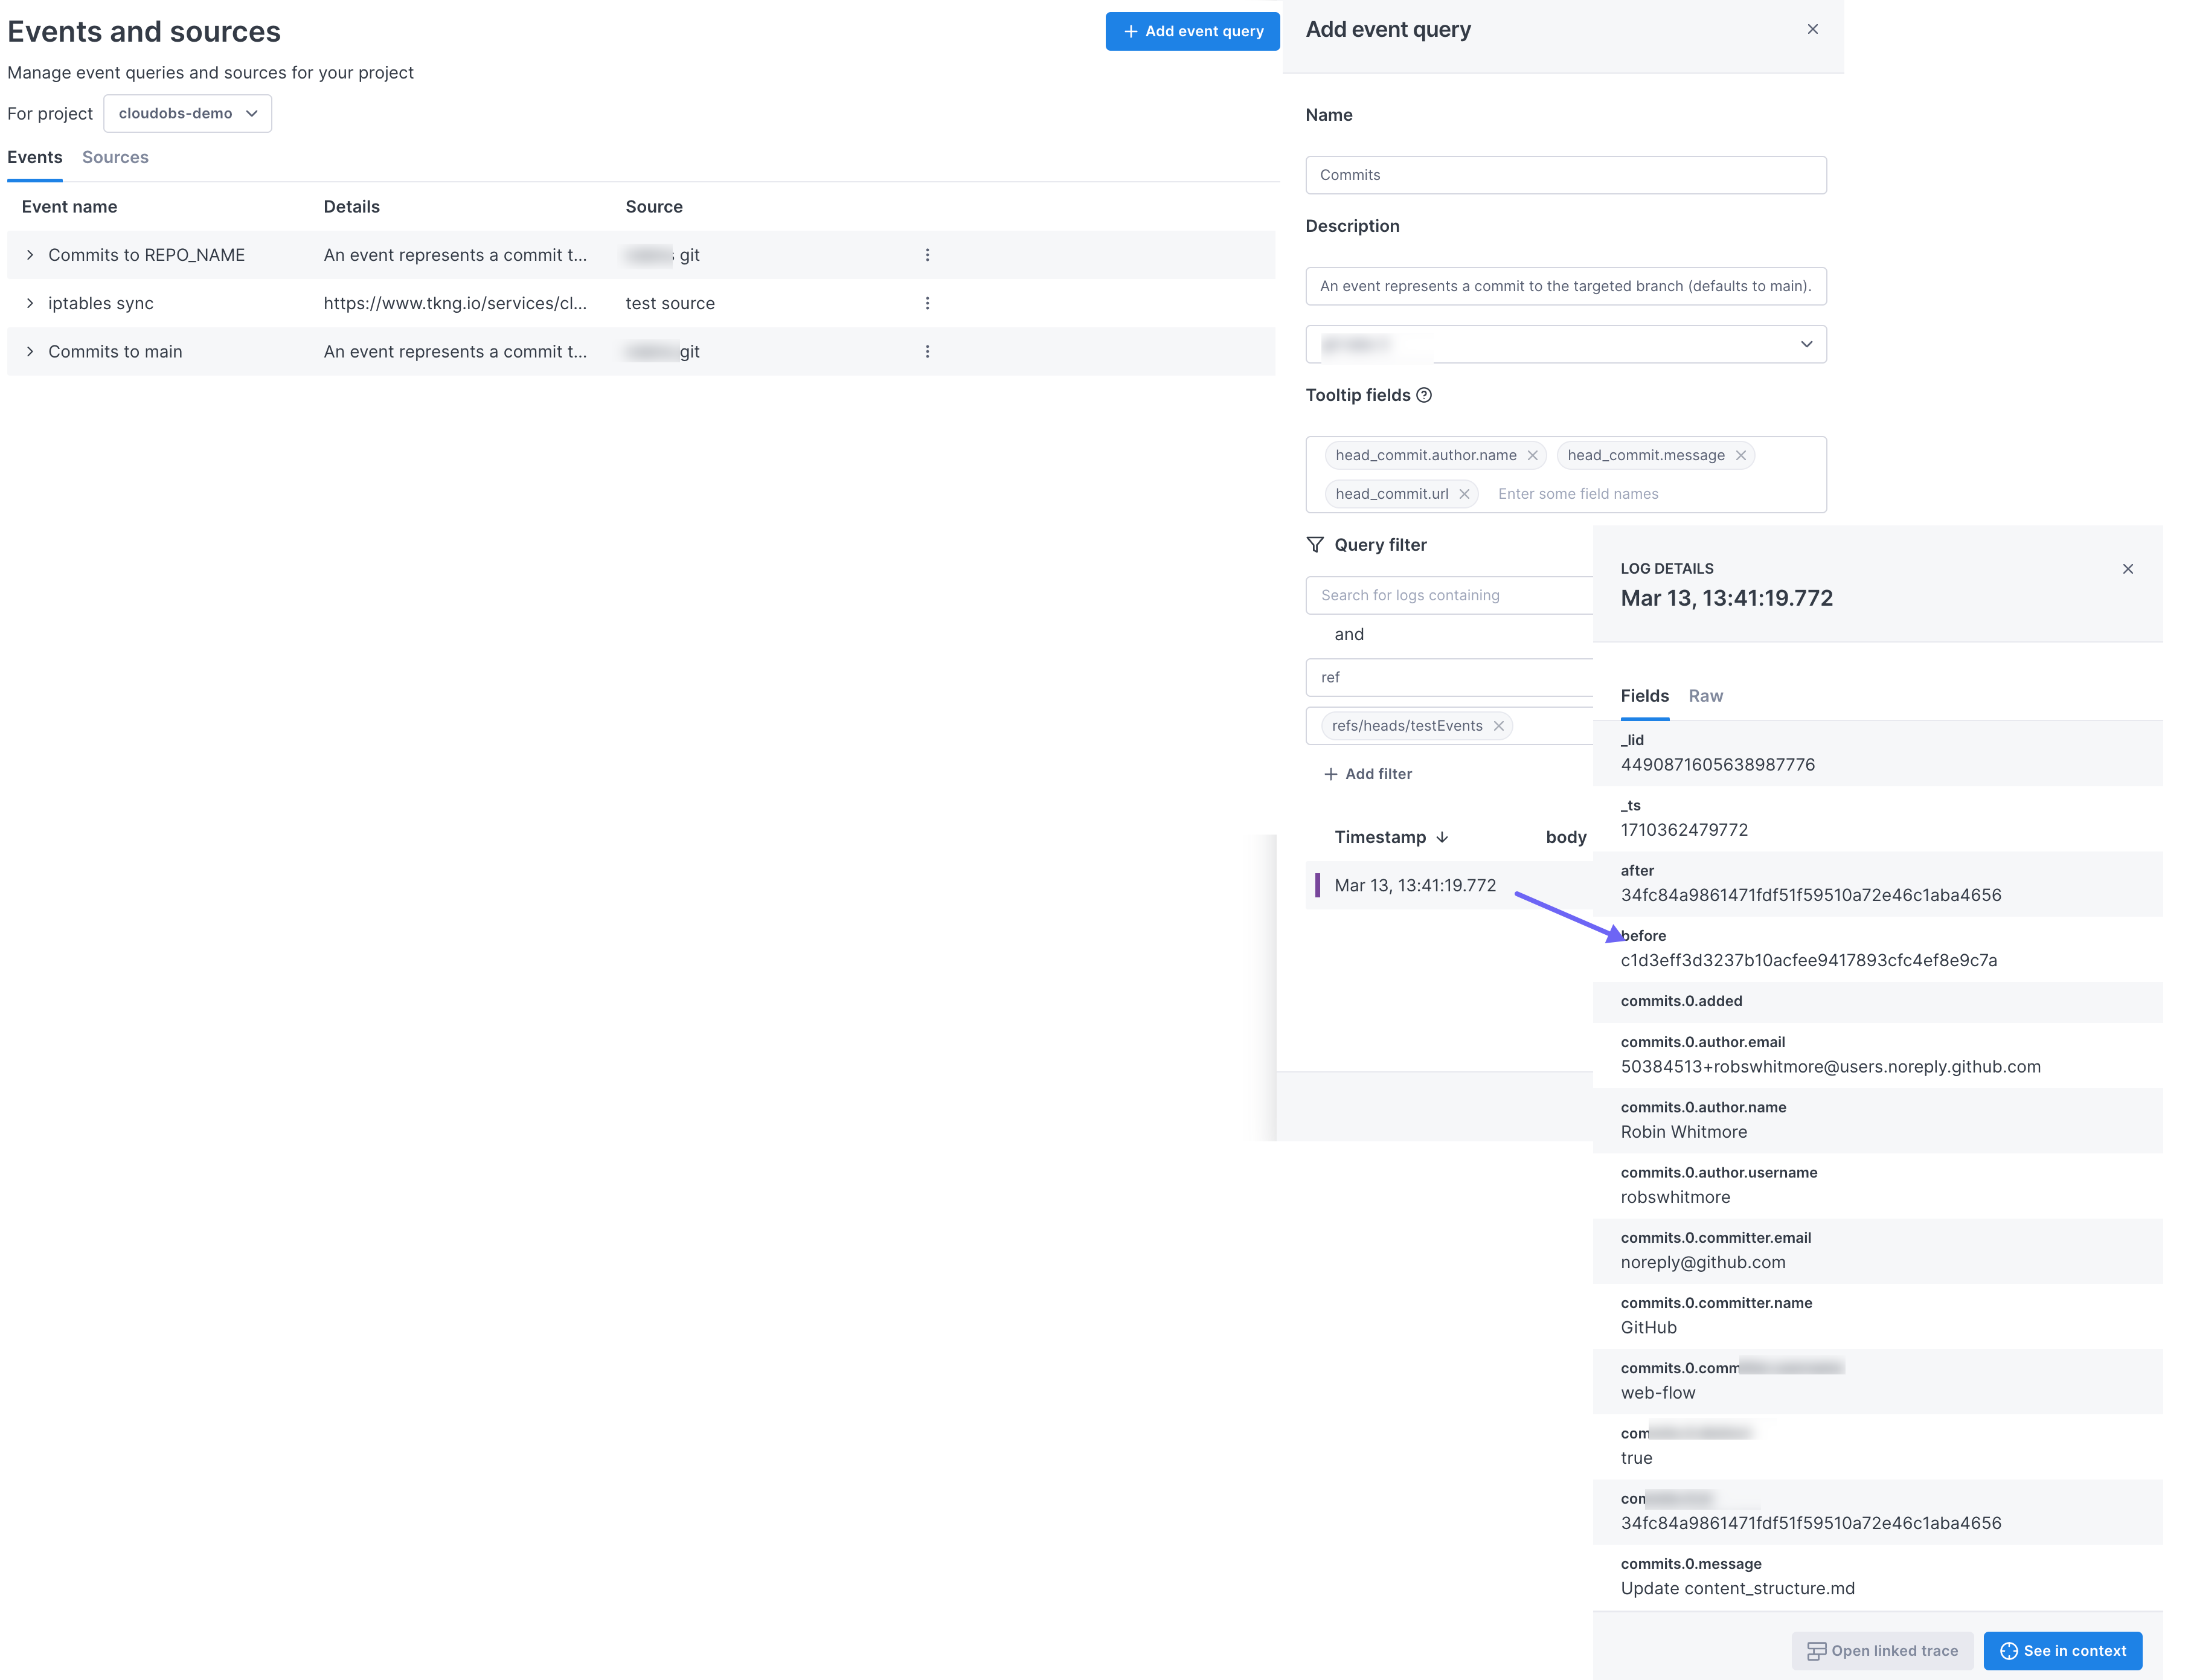
Create custom event markers
To create a custom event marker, you need to create a webhook from the source of the event and a query to determine when and how to display the marker.
Add a source webhook
You can skip this step if you’re using telemetry logs to create event markers.
This image shows how to add a source. The steps below describe the procedure in more detail.

- From the Settings page, select:
- Events and sources
- Then click the Sources tab
- Then click Add Source
- Enter a name for the source and choose Custom for the type.
The Webhook ingest URL provides the ingest URL, including the access token. Copy that to use in the third-party webhook creation.
Cloud Observability creates an access token for each event source you create. You can manage the tokens from the Access tokens page in Settings.
Create an event query
The event query tells Cloud Observability when to display the marker. You can query on anything in the payload and also filter by attributes on the data.
This image shows how to add an event query. The steps below describe the procedure in more detail.
-
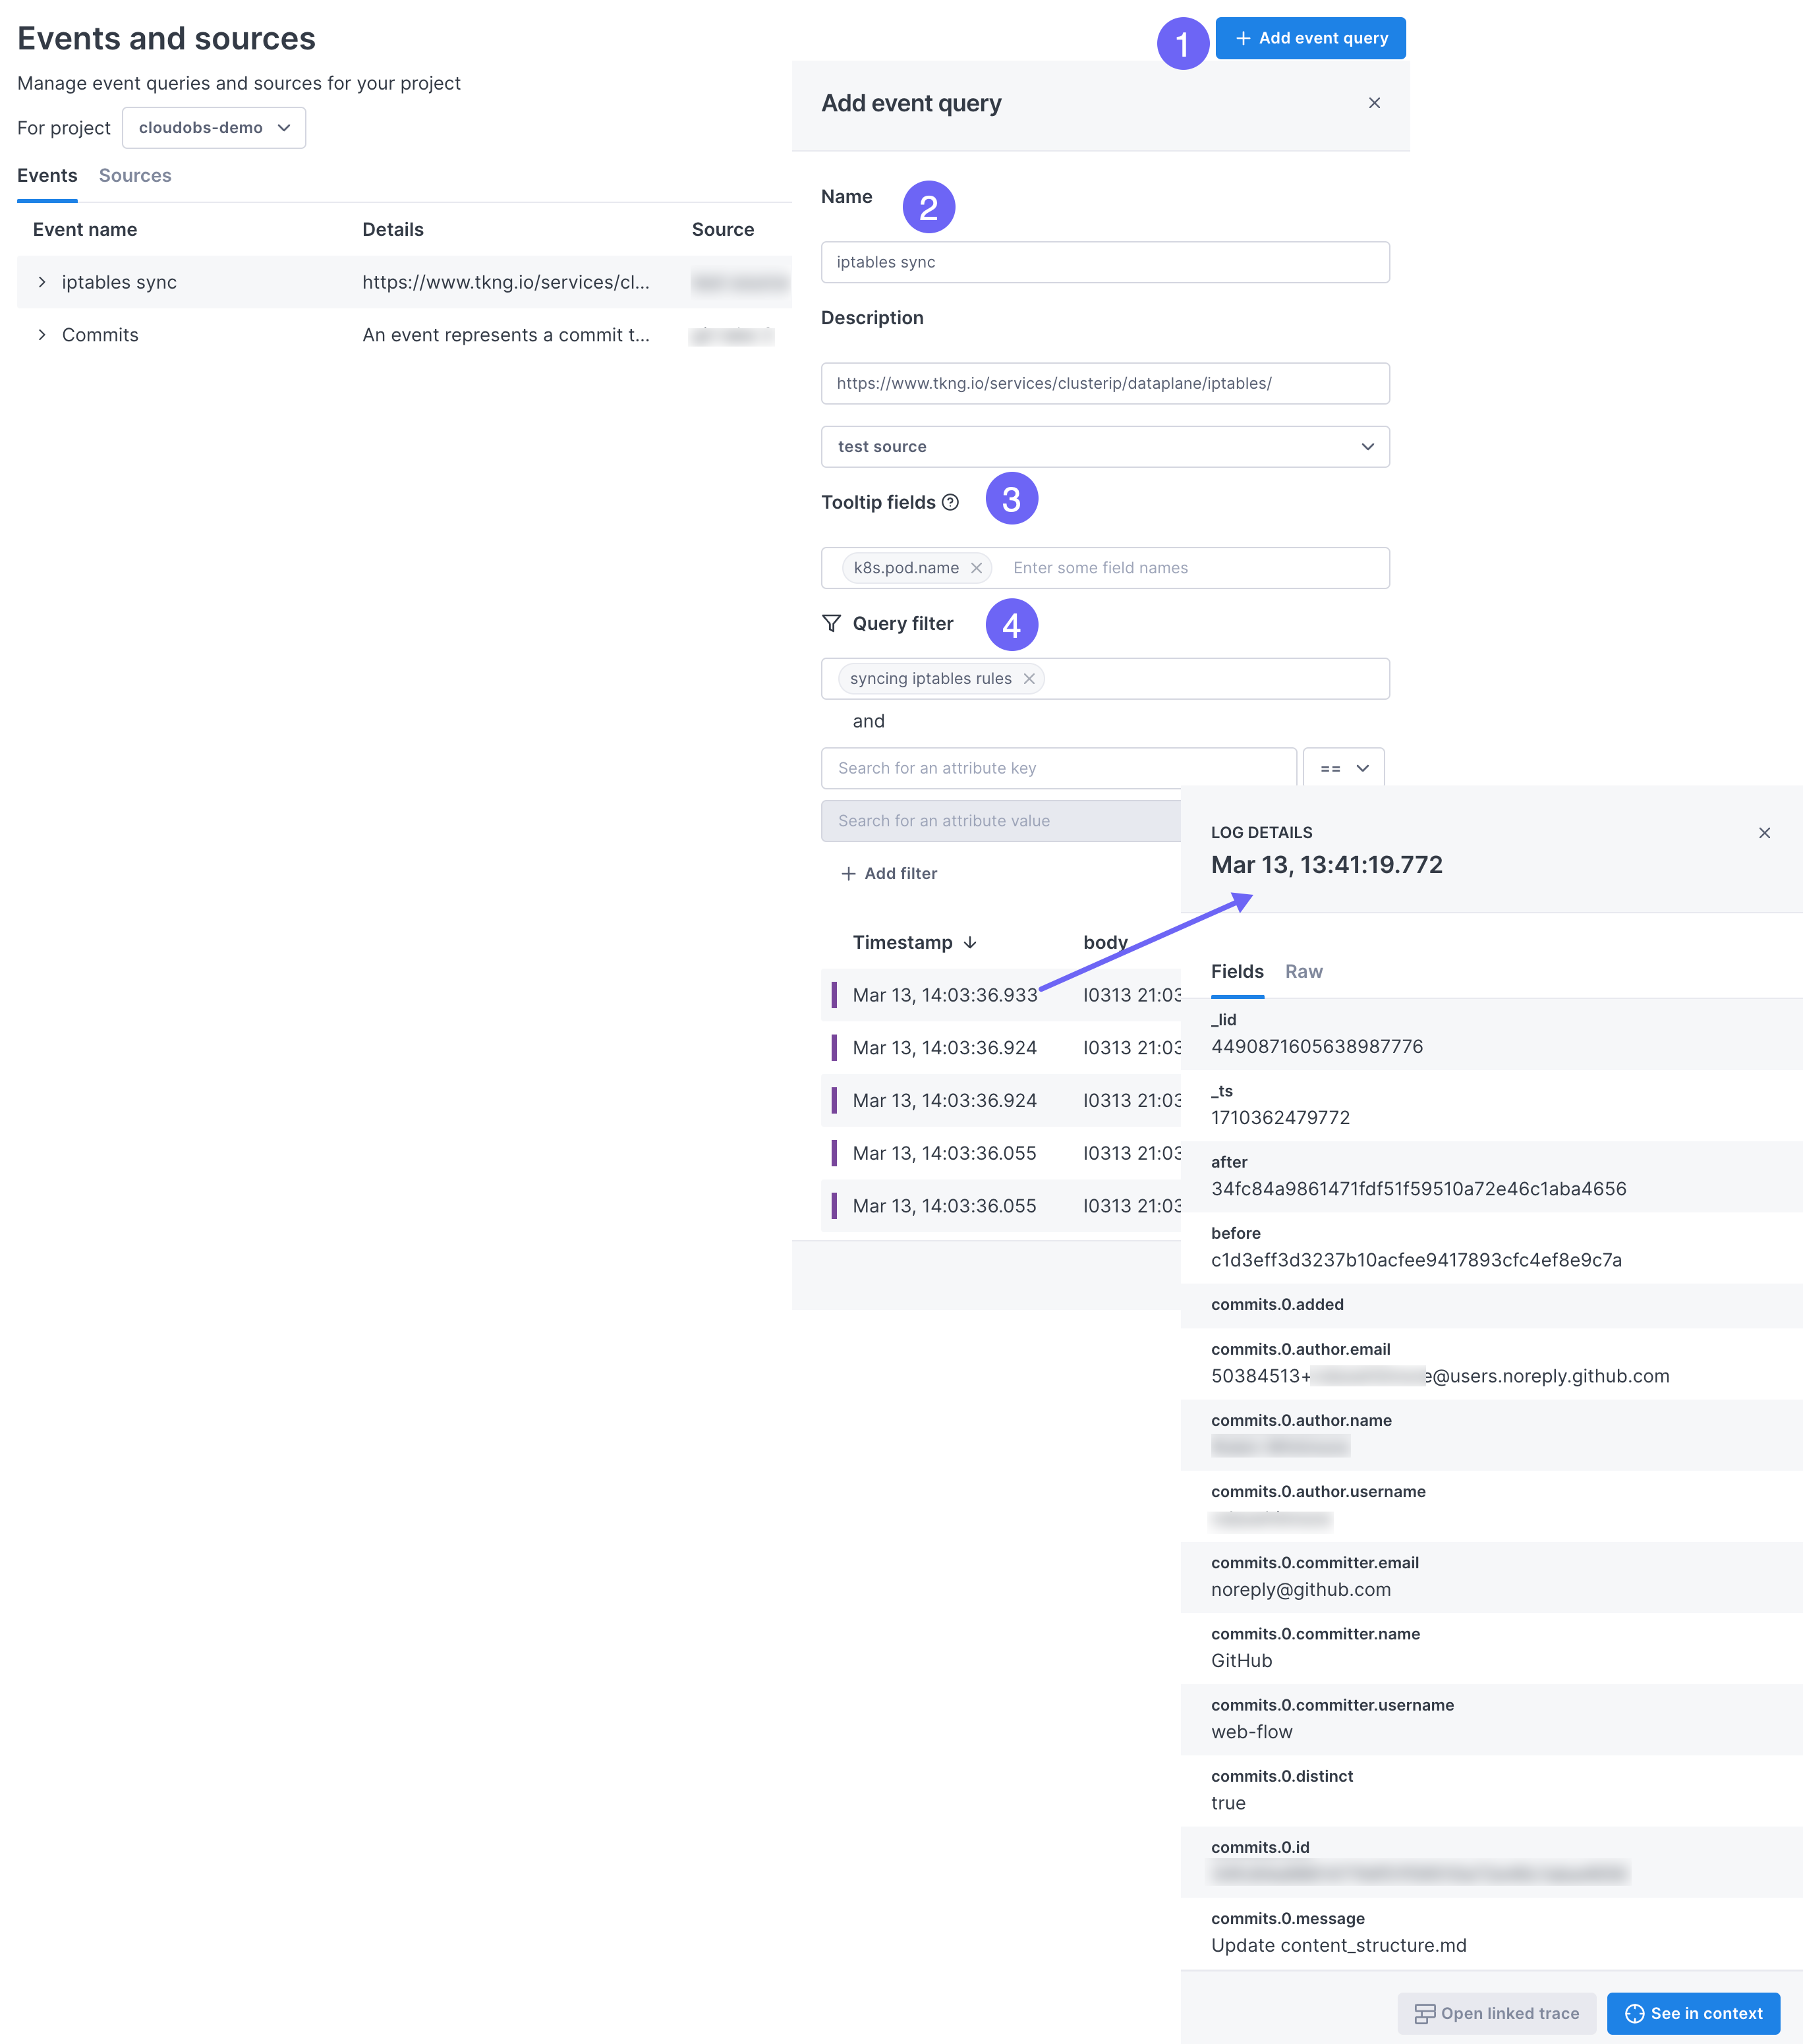
Click the Events tab and click Add Event Query.
-
Enter a name and description for the query and select a source webhook.
A table of event logs streamed in the last hour by all sources displays at the bottom of the panel. Clicking a row opens that event in a panel where you can inspect the different fields returned by the event (either in a formatted or raw view). This information can help determine how to complete the next steps. If your event is based on telemetry logs, you can choose to view the event in the Trace view or the Log view.
-
By default, the name of the query displays in the marker’s tooltip. You can instead choose to display the value of fields on the data.
If the data includes a URL back to the source, consider including that in a tooltip so users can easily return to the source for their investigation.
-
By default, all sent events cause the marker to display. If you want only a sub-set of the data to trigger the marker, use the Query filter field to create a free-text query. You can also filter to a subset of attribute values. You can add as many attribute filters as needed.
View event markers in dashboards
Markers for all events are available from the View button for the dashboard. Click the Manage link and select the markers to display. You can also add and edit event sources and queries from here. 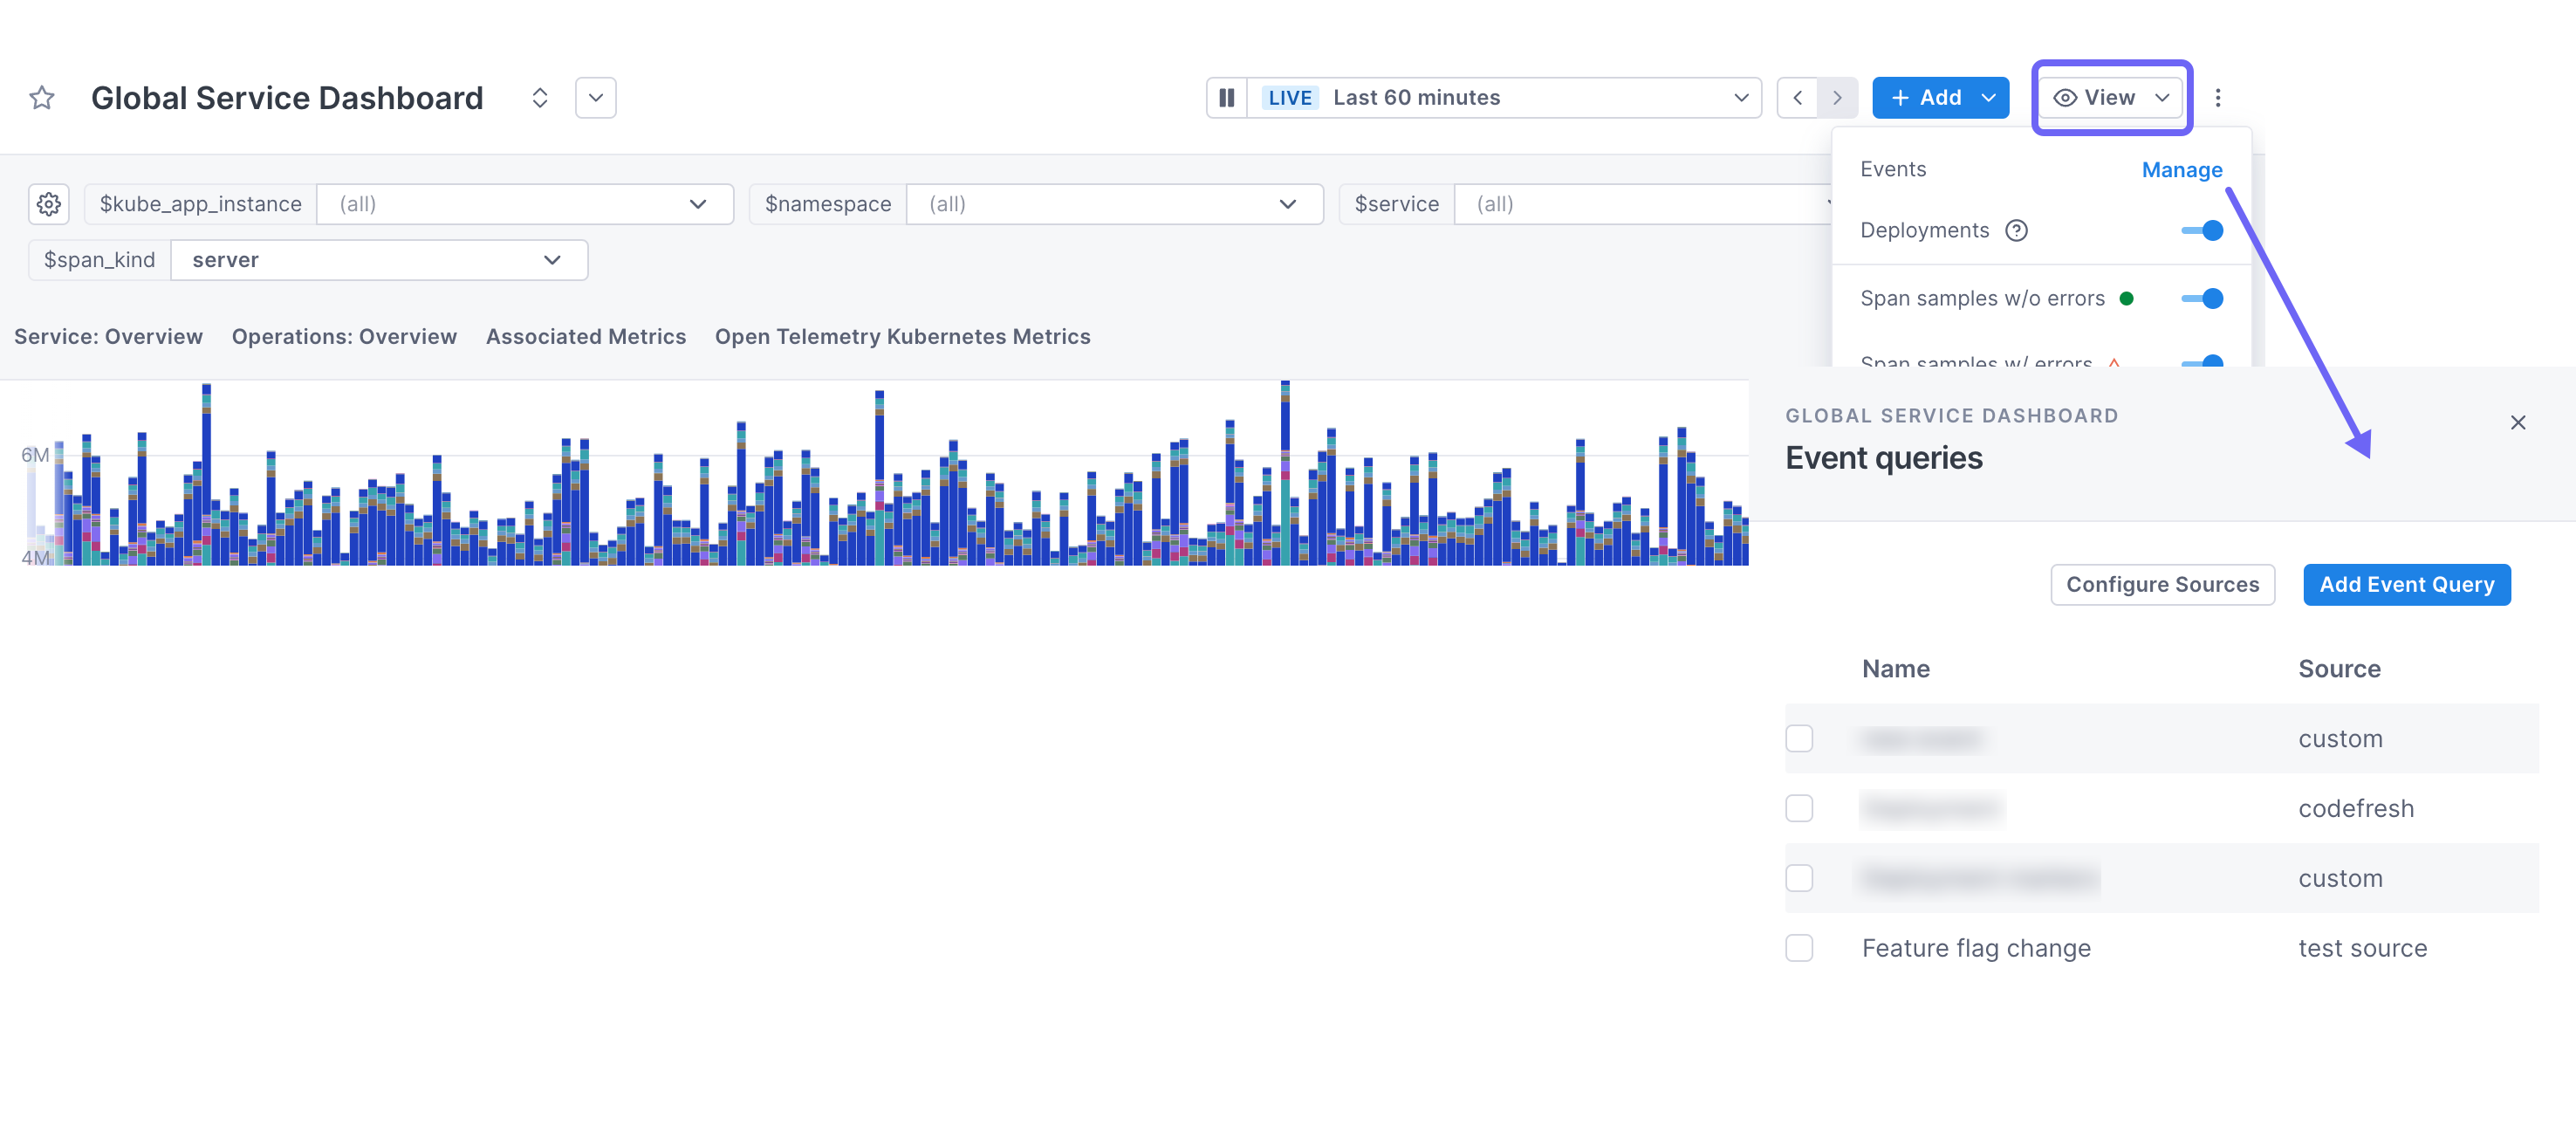
See also
Send logs to Cloud Observability
Updated Mar 14, 2023