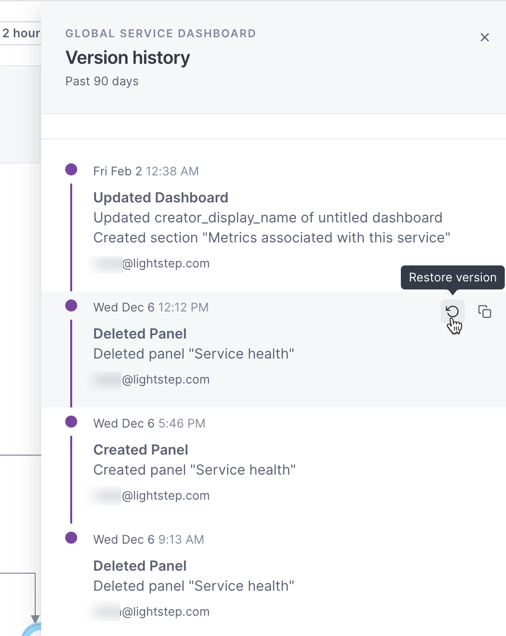
Dashboards now include a Version history panel, allowing you to view all changes made to a dashboard. You can restore a dashboard to a previous version. You can also create a new dashboard by cloning a previous version.

Other dashboard improvements
By default, span samples now display on dashboards. You can control this display using the switch at the top of the dashboard.

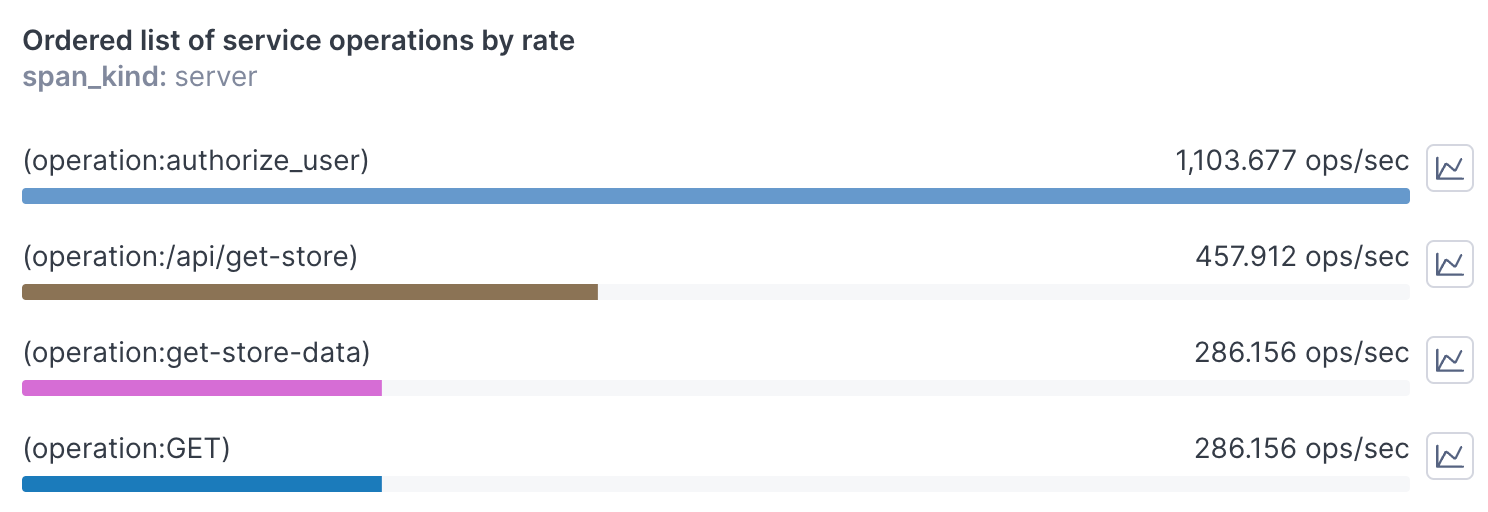
The Ordered List visualization now allows you to copy the query for a row into a notebook as a time series chart, where you can view span samples and perform an investigation. 
Updated Nov 30, 2023
