
Your dashboards can contain panels that display logs, metrics, and spans. Most panels are built from a query against that data.
Using Terraform? You can use the Cloud Observability Terraform provider to create and manage your dashboards and panels. You can also export existing dashboards into the Terraform format.
Before you create panels, read how Cloud Observability displays metric data to understand the different metric kinds and how your configuration choices affect how your data is displayed.
Create a panel
You create most panels by querying your logs, metrics, or spans and displaying that data in a chart. You can add multiple queries and also add formulas.
-
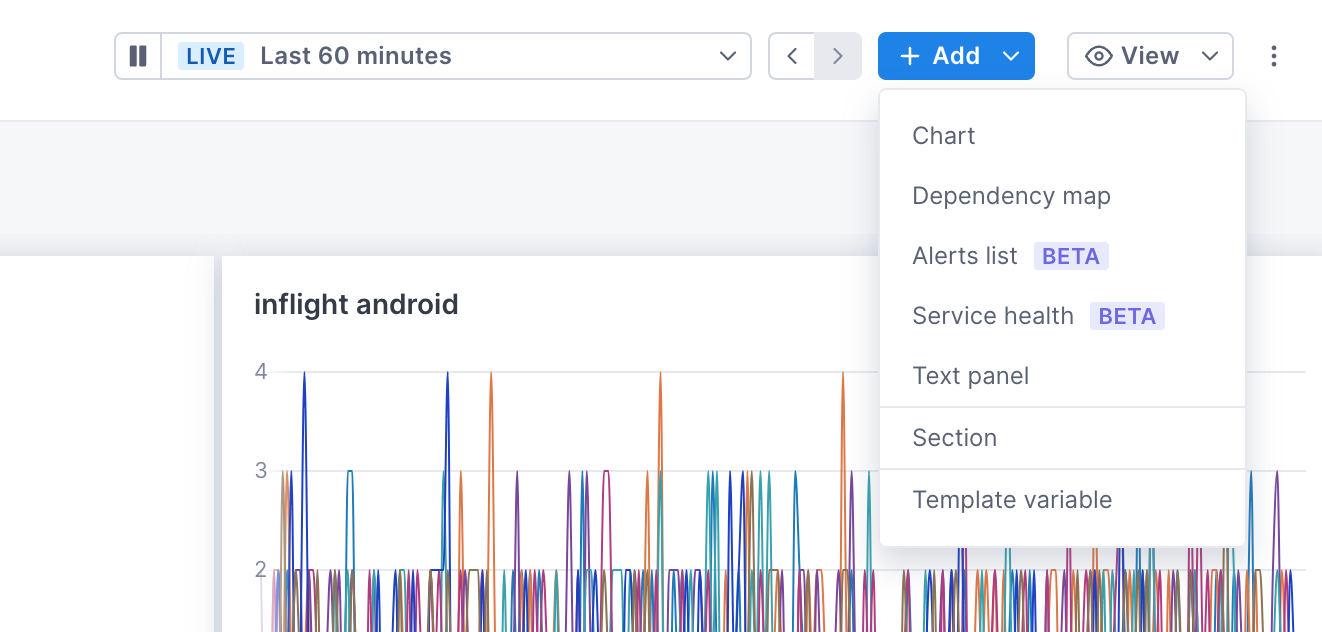
From an open dashboard, click Add and select the panel type.
For descriptions of the different panels, see Data visualizations.
-
In the builder window, click into the title to name your panel. You can rename it at anytime by clicking into the title.
Add an optional description (markdown supported). Panels with a description have an info icon that displays the description on hover.
-
Build your query using the Unified Query Builder or in the editor using the Unified Query Language (UQL).
-
Click Save to save your changes. The panel now displays on the dashboard.
For charts, we cap the number of time series displayed to 1,000 to avoid unnecessary noise. If your query returned more than that, note that some were omitted. If you want to view all series, you may want to omit using “group by” to reduce the cardinality.
Data retention
Data for metric queries is saved for 13 months, and is not configurable. By default, log data is queryable for 3 days. You can change that value or query older logs by rehydrating logs from cold to hot storage.
Span data returned by a query for a dashboard panel can be continuously collected and saved as a Stream. The Stream’s data and and any associated traces are retained for as long as your data retention policy.
If you don’t save the query as a Stream, panels will only display data from the Microsatellites’ retention window, (by default, the last three days of data).
If data is beyond the retention window, the chart displays hashed lines to show that data is no longer available. 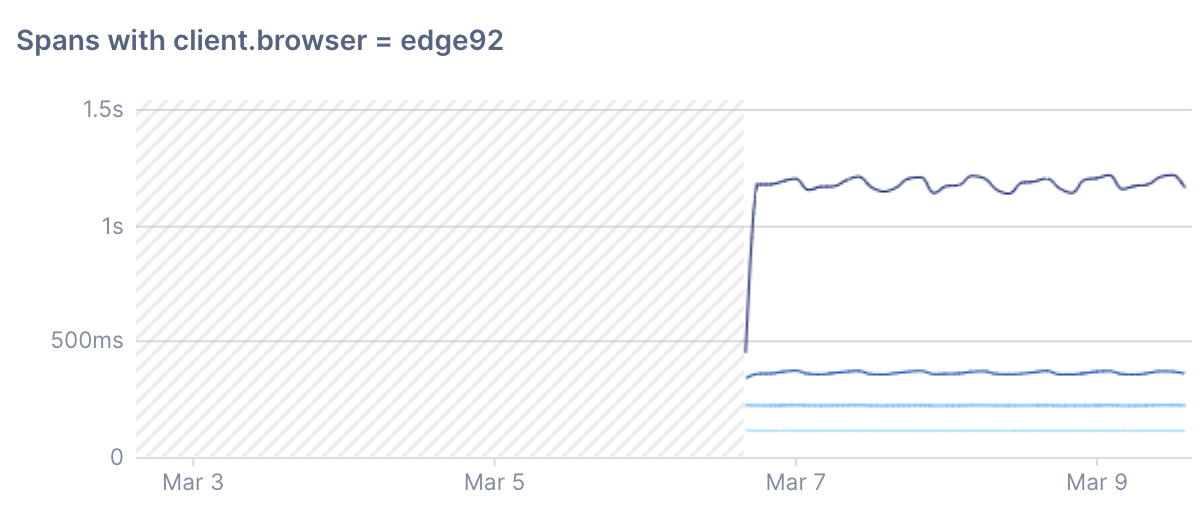
To control retention of a span query:
If a query doesn’t match an existing Stream, you can choose to save it as a Stream by clicking Edit. 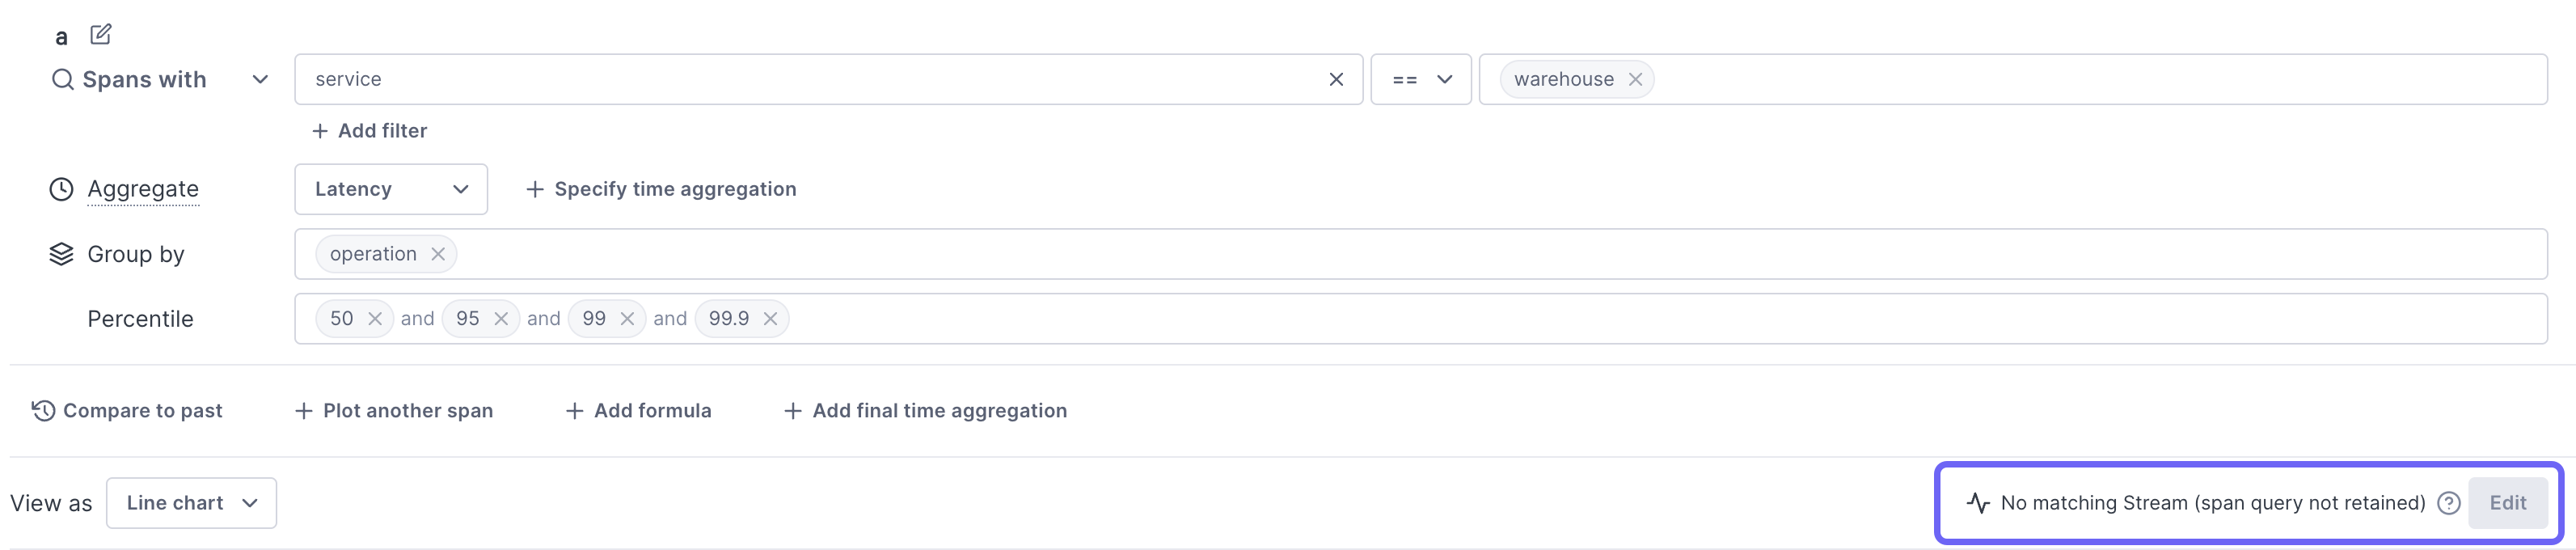
Span queries that use a group-by can’t be retained.
If you choose to retain a query and later want it to use only what is in the retention window, you can delete its underlying Stream.
When a chart uses multiple queries, each query is retained separately.
If you add a chart with a retained Stream query to a dashboard that uses global filters, the query is retained without those filters applied.
Change a panel’s display
You can change a panel’s visualization type.
By default, line charts are used to display values. You can change the panel type using the View as dropdown. Learn more about the different visualization types.
Not all visualization types work with all queries. When you choose an incompatible visualization, you’ll be shown why and how to fix your query to support the type you want.
Edit a panel
You access and edit a panel from the Dashboard.
From a dashobard, hover over the panel, click the More ( ⋮ ) icon and select Edit (or click CTRL+e). 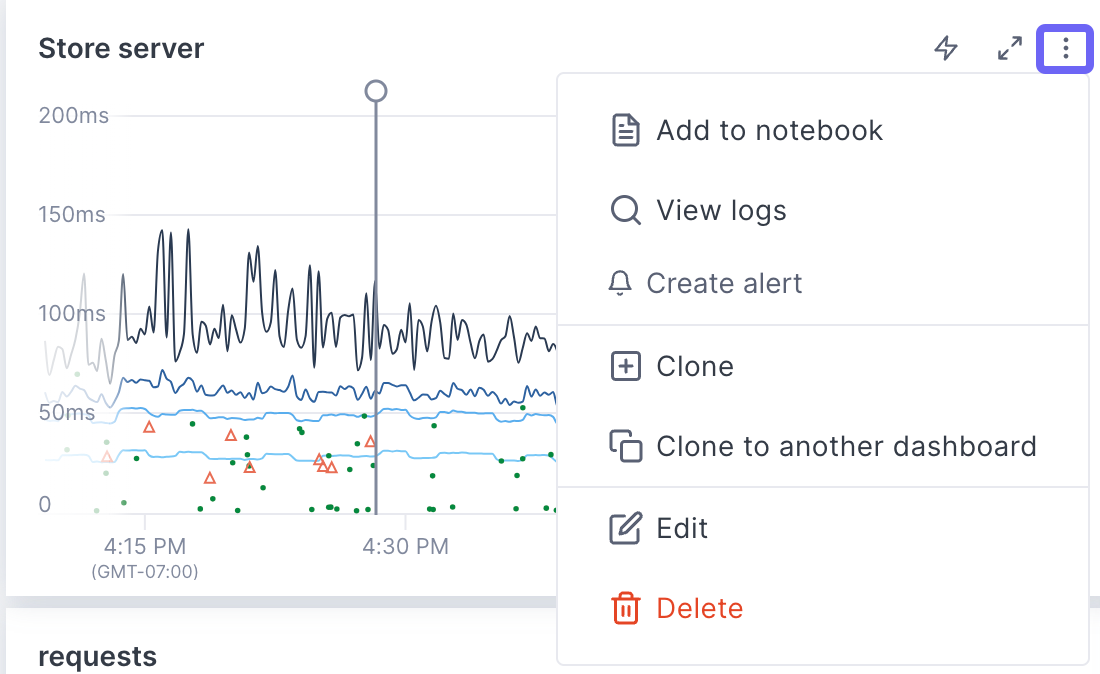
The panel opens in the builder where you can edit it.
Delete a panel
To delete a panel, use the More ( ⋮ ) icon and choose Delete.
Add dashboard workflow links
You can add dashboard workflow links to a dashboard or panel that allow you to navigate to another app or another place in Cloud Observability keeping some context of the dashboard with you, for example the value of an attribute currently used in the query or the current value(s) of a template variable.
See Use dashboard workflow links for more information.
Create an alert from a chart
You can create an alert from a chart, but because alerts require a specific structure, not all charts can be used to create one. If your query contains a group-by, you will not be able to create an alert (the option is disabled). For queries that don’t meet other requirements, you’ll be able to edit the query on the Alert Configuration page.
Creating an alert from a span query automatically creates a Stream.
Follow these steps to create an alert from a chart:
-
Click the More icon and choose Create an alert.
The Alert Configuration page opens in a new tab using the query from the original chart. A banner describes the edits needed to create a valid alert. Fields in violation are highlighted.
-
Fix the violations.
-
By default, the title is the same as the original chart. You can change it and you can add a description, if needed.
-
Continue creating the alert.
Add a panel to a notebook
You can add a panel to a notebook for when, during an investigation, you want to be able to run ad hoc queries, take notes, and save your analysis for use in postmortems or runbooks. Notebooks let you view logs, metrics, and traces from different places in Cloud Observability together, in one place.
To add to a notebook, click Add to notebook and search to choose an existing notebook or create a new notebook.
When you add to a notebook, a panel is created using the same query. The annotation is a link back to the original, so you can quickly return to the origin of your investigation.
If you are adding a panel from a dashboard that uses template variables, the currently selected value replaces the variable in the query.
Learn more about notebooks.
Investigate a deviation in a chart
When you notice a deviation in a chart and don’t want to start a notebook, use Cloud Observability’s correlation feature to investigate the deviation and find possible causes.
The correlation feature works with metrics and spans only. And you can’t use the correlation feature on big number charts.
To run the correlation feature, click View correlations or click directly in the chart and select View correlations. Cloud Observability opens a side panel where you can begin your investigation.
Visit Investigate deviations for more information.
See also
Updated Feb 7, 2024