
Developer mode only accepts span data. Metrics and logs aren’t supported.
Developer Mode isn’t supported for organizations hosted in the EU data center.
View logs
Your Developer Satellite runs in a Docker container. To view the Docker logs, run docker logs lightstep_developer_satellite
If you receive output such as Error: No such container: lightstep_developer_satellite, this most likely means the local Developer Satellite is not running.
The tail end of the logs should show Self-Test Status: SUCCESS and no errors:
1
2
3
4
5
6
7
8
9
10
11
12
13
I0723 18:04:12.758873] Satellite Self-Test Results...

API Key authorized for:
  1 Organizations [YourOrganization]
  1 Projects [abc123...xyz890]
  1 Access Tokens [1ef418f3...]
  0 Disabled Access Tokens []

Tests:
  Connected to api-grpc.lightstep.com:8043: success
  Require unique port numbers: success

Self-Test Status: SUCCESS
Connection errors from the tracer
- Confirm your Developer Satellite is running.
Check the Satellite’s status in the top left of the Developer Mode display. It should say Running.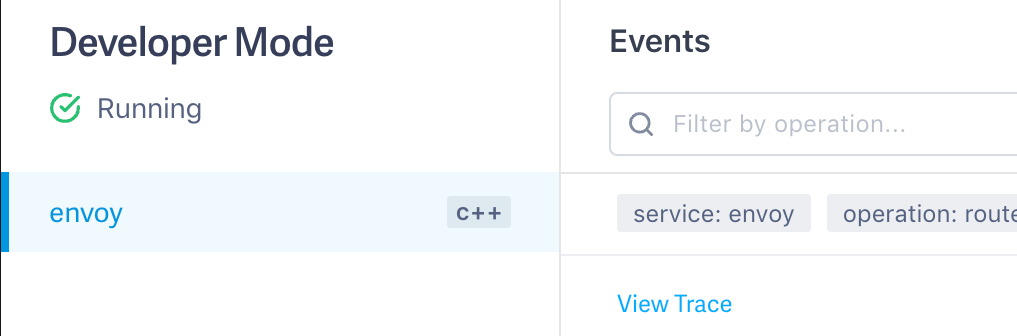
If instead it says Not Running, run the install script again. -
Confirm that you configured your tracer correctly with the following values (see language-specific tracer initialization syntax):
1
2
3
4
host: localhost
port: 8360
plaintext: true
access_token: developer
If no spans are appearing, try enabling more verbose output from the client-side, to see if there are syntax/compilation/connectivity errors, etc.
If you still have issues, contact our Customer Success team.
App in Docker can’t access the Developer Satellite
Confirm that the Developer Satellite is running on the same Docker network as your service containers.
-
Run the following to get the IP address of the Developer Satellite Container.
1
docker inspect -f '{{range .NetworkSettings.Networks}}{{.IPAddress}}{{end}}' lightstep_developer_satellite
-
Use this IP as the
hostname in your tracer configuration (instead oflocalhost).
Not seeing my spans (no errors reported)
- Enable verbose client-side logging based on tracer language-specific settings.
- Confirm tracer initialization settings point to the local Developer Satellite and not a remote Satellite.
- Confirm the
port,plaintext, andaccess_tokensettings. - Close your tracer before exiting.
- Attempt another quick sample tracer app as found in the Quickstart: Instrumentation.
See also
General guidelines for tracing instrumentation
Updated Dec 13, 2019