
Streams are span queries that retain their data beyond the default three-day Microsatellites retention window. They allow you to proactively monitor parts of your system that are crucial to business health. Cloud Observability continuously receives data from your Microsatellites that match the query and stores statistics and example traces to ensure you always have data for latency, error rate, and operation rate for as long as your Data Retention policy allows.
Queries for alerts are automatically saved as Streams.
The Streams list shows all Streams that currently exist for the project and where those Streams are used. Seeing where they are used allows you to confidently delete ones that aren’t in use. 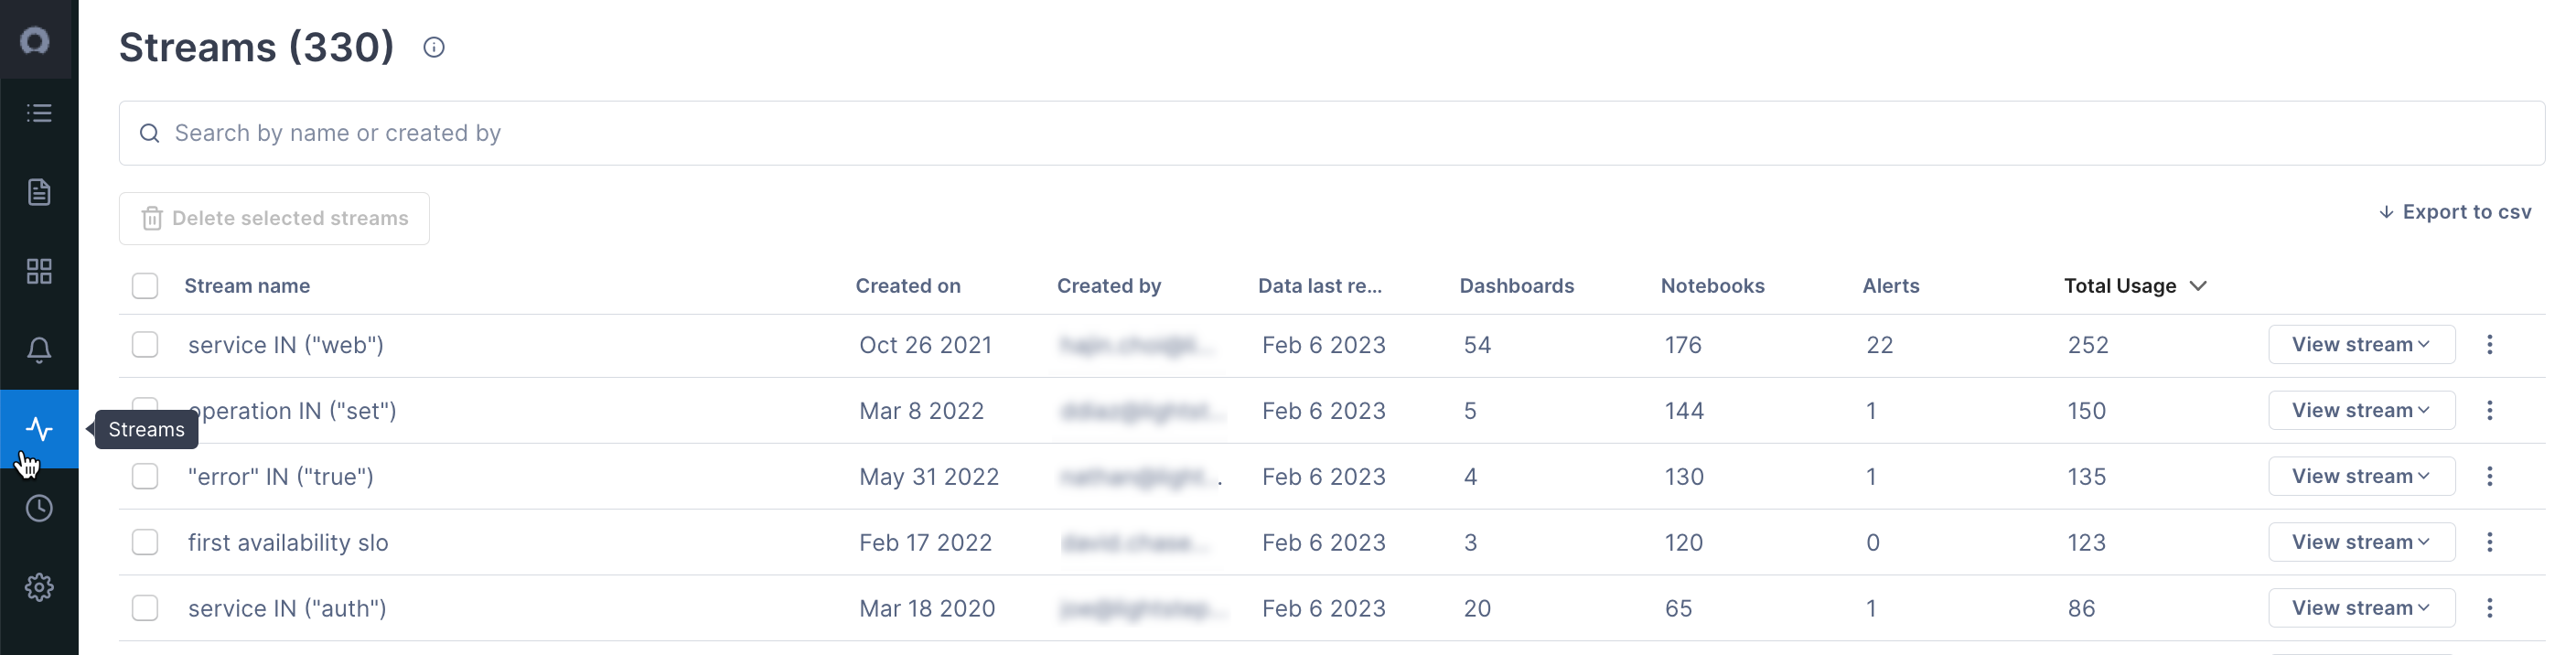
Create a Stream
You create a Stream based on queries to your span data. Cloud Observability continuously monitors for span data that matches that query and saves it as a Stream. You can create a Stream:
- When you create a query for a chart on a dashboard
- From the Service Directory
- From a query in Explorer
Use our public API to list, retrieve, update, and create Streams. You can also retrieve a specific time series for a Stream.
Create a Stream from the Query Builder
If a query doesn’t match an existing Stream, you can choose to save it as a Stream by clicking Edit. 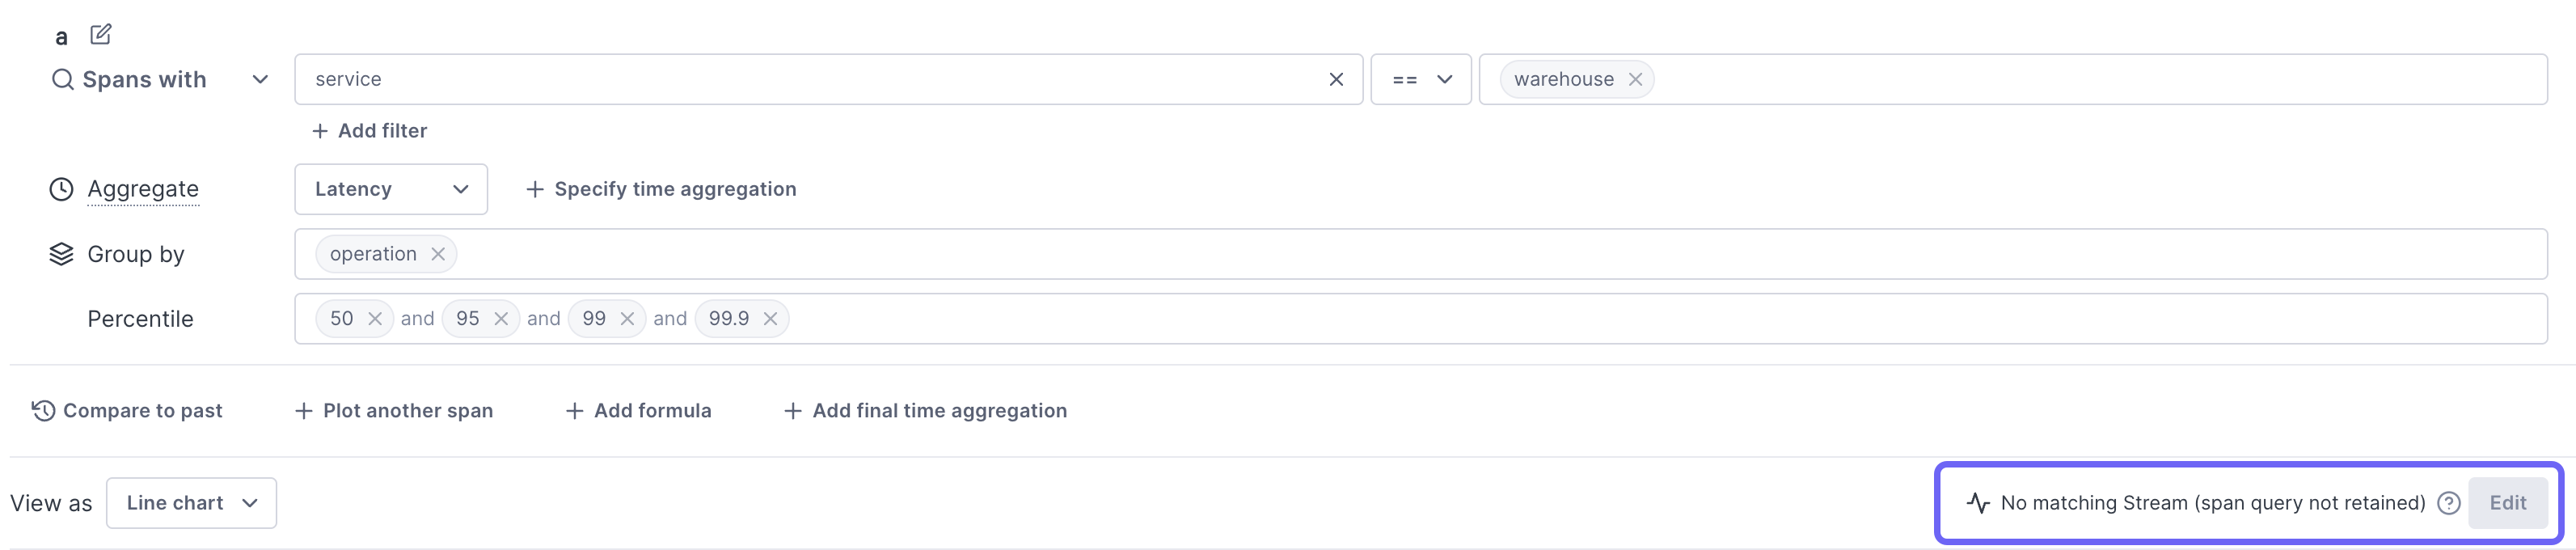
Span queries that use a group-by can’t be retained.
If you choose to retain a query and later want it to use only what is in the retention window, you can delete the associated Stream.
When a chart uses multiple queries, each query is retained as a separate Stream.
Streams support a smaller subset of UQL filter predicates. Disjoint predicates (a == "yes" || b == "no"), numerical comparison >, >=, <, <=, latency (latency > 1s), defined and undefined are not supported.
Create a Stream from the Service directory
You can create a Stream for a service/operation pair from the Operations tab of the Service Directory.
-
From the Service Directory, click the Operations tab and choose a service on the left.
-
To create a Stream for an operation on a service, click Create Stream for that operation (if the button says View Stream then a stream has already been created for this operation).
By default, the Stream’s name is the query. You can rename it
-
Click View Stream to add a Stream to a dashboard or notebook.
When you add a Stream to a notebook or dashboard, three charts are created (latency, error rate, and operation rate) using the query for the operation on the service. You can edit the queries as needed and view exemplar traces. By default, the charts take the name of the query. You can change that to be more descriptive by clicking into the title and entering a name of your choice.
Create a Stream from Explorer
-
Open Explorer from the navigation bar and run any query.
Explorer doesn’t support UQL queries.
To run a query using the Query Builder:
Click into the search bar to open the Query Builder. You can build queries for services, operations, and attributes. UseINorNOT INto build the query. When you click into the Service or Operation field, the builder displays valid values.
When you add multiple values to the Operation field, spans that match either value (ORoperation) are returned.
Learn more about running queries
Supported query keys
Query multiple keys and values -
Once the query is run, click Create Stream.
If the button is grayed out, then a Stream already exists for that query.
-
To view the Stream, click View Stream.
-
By default, the Stream takes the name of the query. You can change that to be more descriptive by clicking the More ( ⋮ ) icon and selecting Rename.
View all Streams
You can view all Streams created for your Organization from the Streams view. Click Streams from the navigation bar. The Streams list shows all Streams that currently exist for the project and where those Streams are used.
Streams are listed in alphabetical order. Use the search bar or sort on a column to find Streams quickly. You can sort the usage columns to see your most popular Streams or find ones that aren’t currently in use, and then delete them.
To view the Stream in a notebook or dashboard, click View stream.
Rename a Stream
By default, Streams are given the query parameters as the name. You can change that to be more descriptive by clicking the More ( ⋮ ) icon and choosing Rename.
Delete a Stream
You can delete a Stream by clicking the More ( ⋮ ) icon for the Stream on the list view and choosing Delete.
Deleting a Stream also deletes all historical data persisted for that Stream and can’t be undone, so be sure you want to delete it!
You can bulk delete streams by selecting them and clicking Delete selected Streams.
See also
Understand data retention in Cloud Observability
Updated Feb 10, 2023