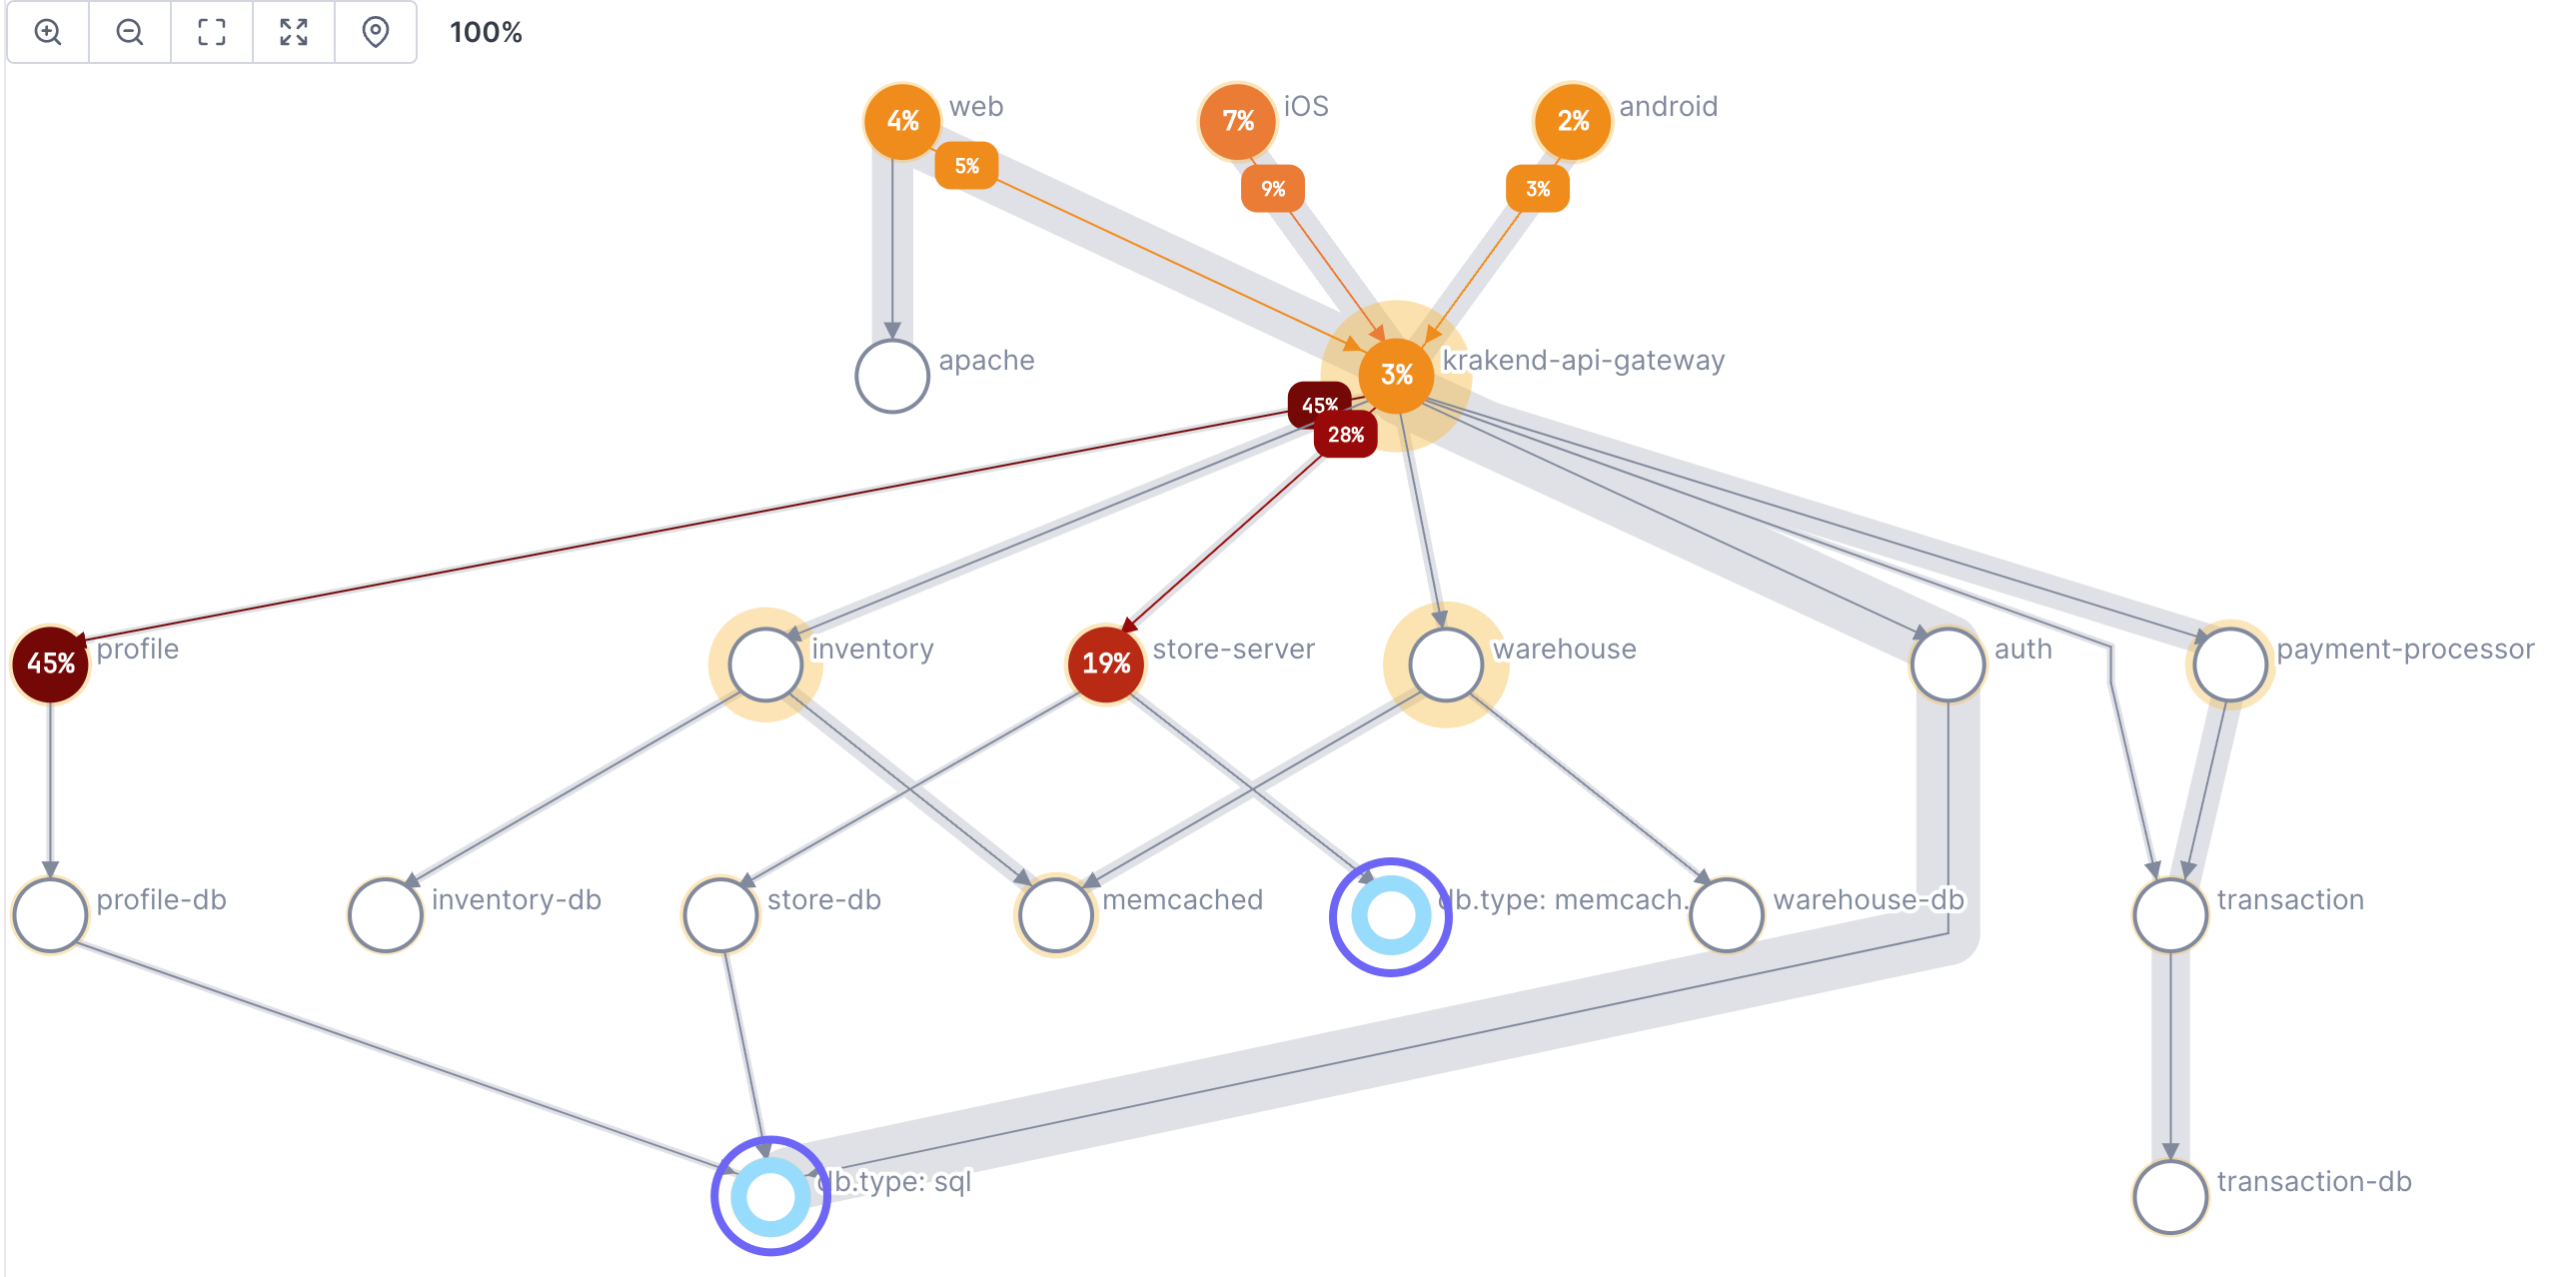
Inferred services are available only on dependency maps.
Inferred services are external services, libraries, or dependencies (like a database or a third-party API) that aren’t instrumented with traces. Because they’re not sending span data, they won’t display on a dependency map and become “lost.” Services making requests to them appear to be the end of the chain, giving you an incomplete picture of your system’s topology. You might be missing where an actual issue is.
You can remove these blind spots using inferred service rules. These rules rely on span attributes to define an inferred service. The map examines the attributes of every leaf span (spans not connected to another instrumented service). When there’s a match, the map recognizes it as an inferred service, displaying it as a child node to the instrumented span. It also provides error counts, span counts, and average latencies for these inferred services.

OpenTelemetry’s Trace Semantic Conventions include attributes you can use to identify inferred services, like db.name and db.type.
For example, your system may include services that query Apache Cassandra database tables. Because Cassandra isn’t instrumented to send trace data, you add attributes to your services that call those tables, like db.type populated with the value cassandra. Then you create a rule that registers that attribute and value(s) as calls to an inferred service. Now, a dependency map can display nodes for the database and you can see where they are in your system.
Because inferred services are not directly sending data, transaction data beyond them isn’t collected.
If you want to display separate nodes for each value of the attribute (or the value of a different attribute), you use the group by function in your rule. For example, you might add the attribute db.type and populate it with the values cassandra, sql, and memcached. The map then displays a separate node for each value.
Add an inferred service
-
If needed, add an attribute to your instrumentation that identifies a call to an inferred service.
For example, if a span calls out to a database, you might create an attribute with the namedb.typethat returns the value of the called database.We recommend using the OpenTelemetry Trace Semantic Conventions for your attributes.
-
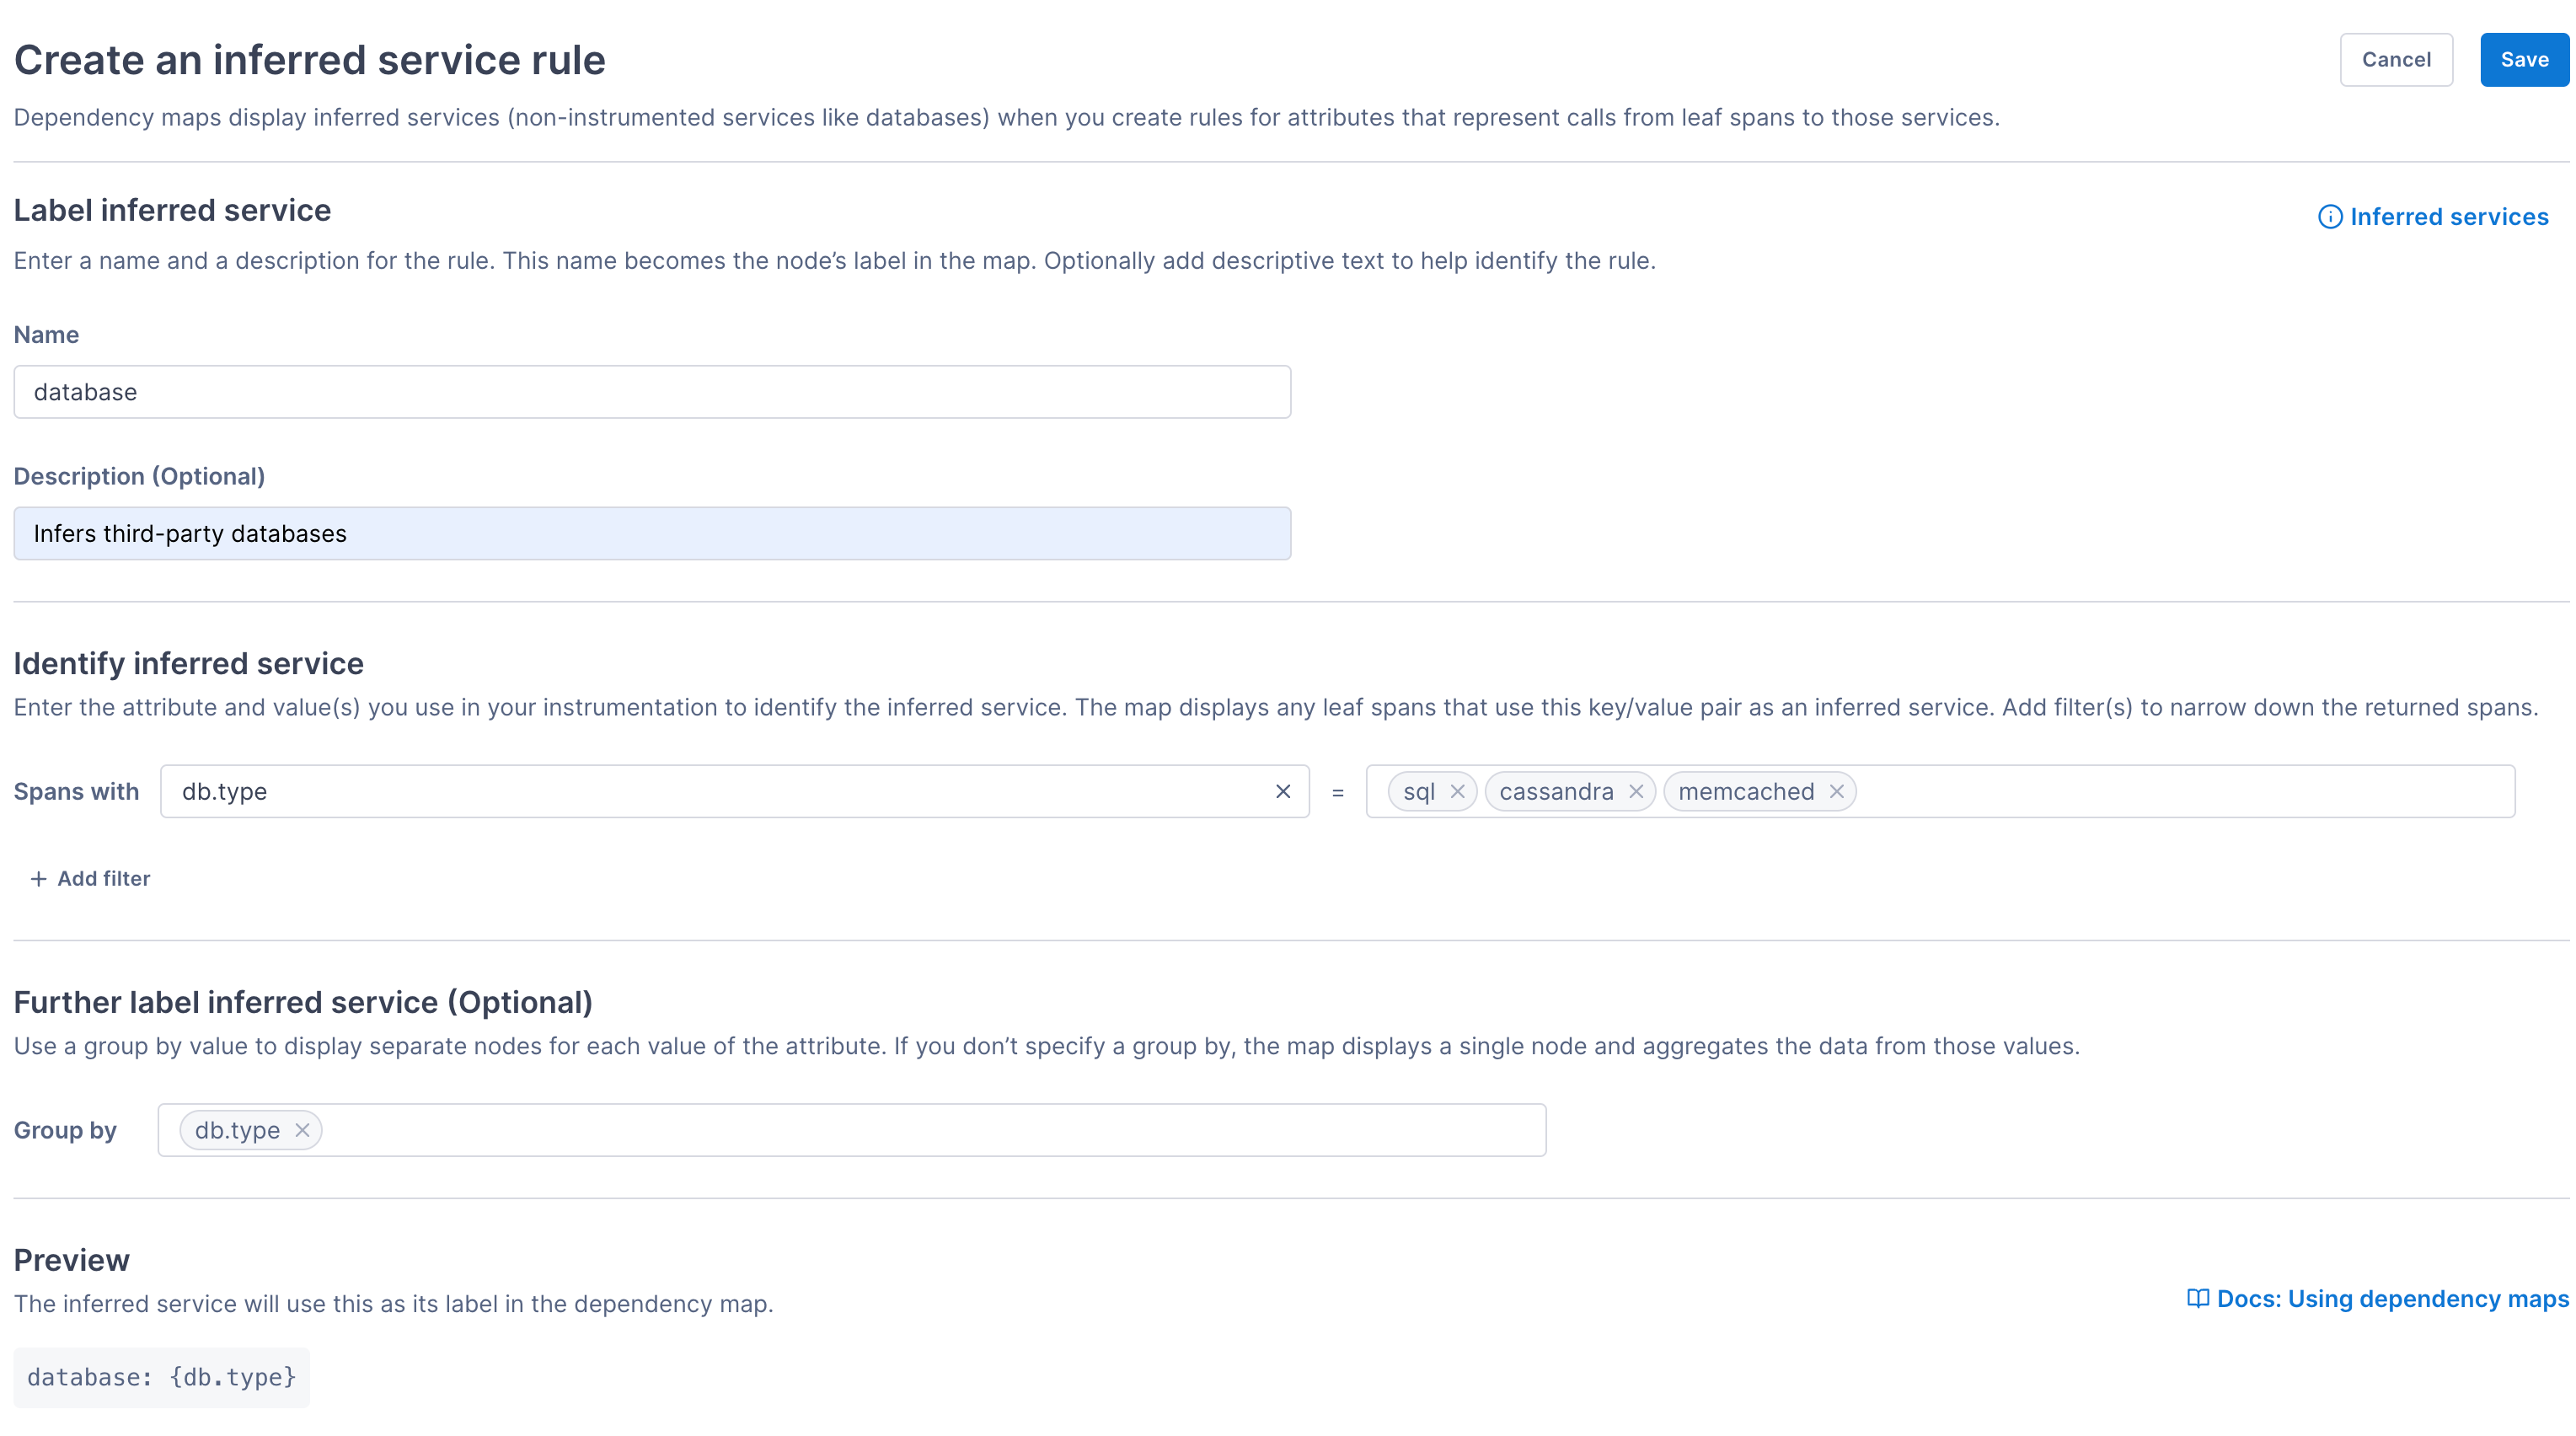
In Settings, click Attribute mapping > Inferred services > Create inferred service rule.
-
Enter a name and an optional description.
For example, you might use the name
DB type.The map uses the name in the dependency map for the inferred service node label.
-
Identify the inferred service by entering the attribute name (the key) and the specific value(s) you want the map to recognize as an inferred service.
This configuration creates a single filter that the map uses to determine inferred services. When a leaf span has an attribute with that key and one of the values, the rule passes and the map displays a node (it must match both the key and the value).
For example, you might use the attribute
db.typeand valuessqlandcassandrato infer both SQL and Cassandra as inferred services.Multiple values are treated as
ORconditions.When you use more than one value, the map displays a single, combined node for the attribute (their data is aggregated). If instead you want separate nodes for each value, then use the group-by feature in the next step.
Optionally add another filter to narrow down the returned spans. For example, if you want the node to represent only calls from client spans, you might filter by
span.kind = client. You can add as many filters as you need. -
To display separate nodes for each value of the attribute, enter that attribute in the Group by field. Alternatively, you can use any other attribute that appears on those spans.
When you add a group by, the map appends that value to the label. If a value can’t be found, the map displays
unknown.For example, without using group by, creating a rule for
db.type = sql or cassandradisplays a single node in the path for any spans with that attribute and one of those values. If instead you add a group by fordb.type, the map displays a node for each individual value: for example one forsqland one forcassandra. If instead you grouped bycustomerit displays a node for each database call tagged with a specific customer value.
The Preview section shows how the map will display the label. For example, db: {db.type} will display db: sql and db: cassandra.

Click the ⓘ Inferred services link at the top of the page to view examples of common inferred service rules. Click Populate form to copy an example to the form.
Display inferred services in the map
By default, the map displays inferred services. You can turn this off and on using the Inferred toggle switch.
Display inferred services in the ServiceNow CMDB
If you’re using the ServiceNow OpenTelemetry Service Graph Connector to send data to the CMDB, you can link an inferred service with an inferred service configuration item (CI).
Manage inferred service rules
On the Inferred Services Rules page, click the More ( ⋮ ) icon to edit or delete an inferred service rule. Choose View diagram to open the map in a new notebook.
See also
View service hierarchy and performance
Updated Oct 4, 2023
