
Use the Span Explorer to investigate changes in performance for an operation.
To open Span Explorer, click on an operation from either the Deployments or Operations tab of the Service directory.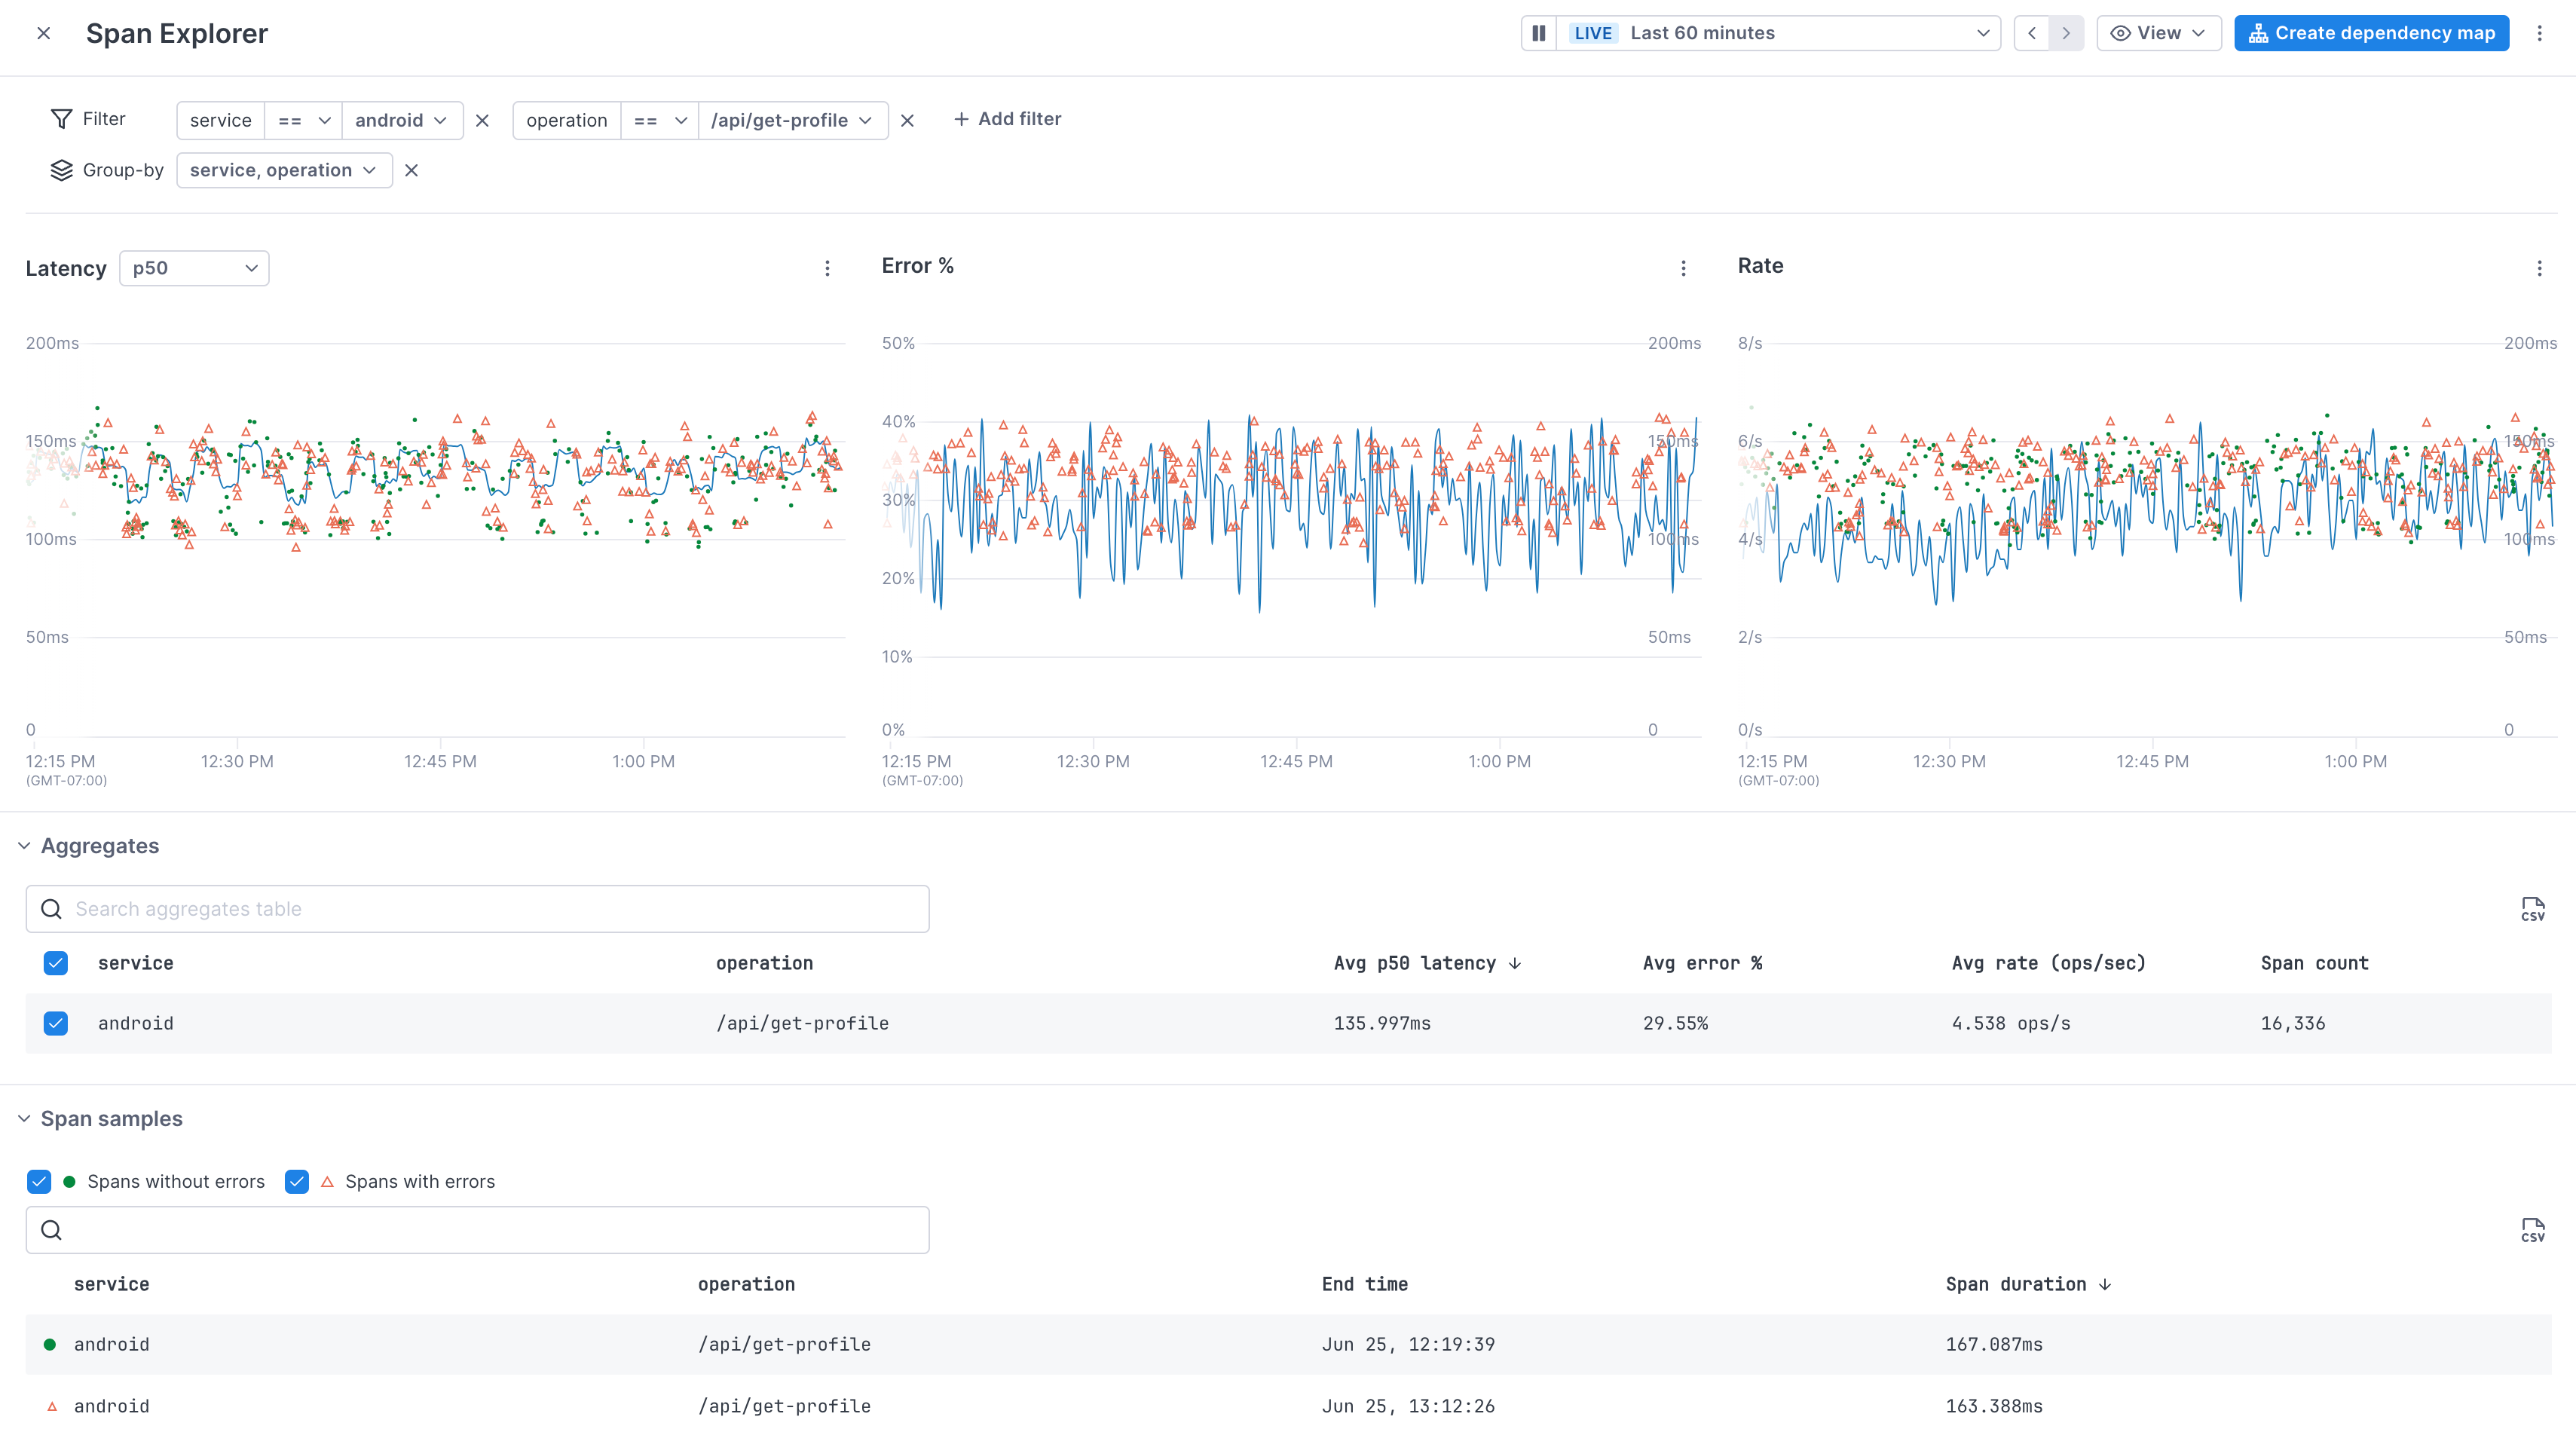
By default, a query is built for the service, filtered to the selected operation. You can add other filters and group-bys as needed using the mini query bar. This query bar is a minified version of the Unified Query Builder. See this topic for more information about querying.
Charts for latency, error rate, and operation rate show a time series graph and example spans. You can change the reported latency using the dropdown. If configured, deployment markers display with a tooltip that shows version information.
Spans without errors are green dots, spans with errors are red triangles. You can control the display of spans using the View dropdown. Click on a span in a chart to view it in the Trace view.
The Aggregates table below the charts shows the average latency time, error percentage, and rate, as well as the number of spans currently in the database. If you’ve added a group-by, each row represents an entity in that group.
The Span samples table shows example spans returned by the query. If you’ve added a group-by, colored dots represent the group that the span is from. You can sort the spans or to search for specific spans.
Investigate an issue
When you see a span you want to investigate further, you can open its details in the Span Details side panel. You use the panel to view attributes and events on the span.
To open the panel, click View span details in the span’s row of the Span samples table.
If you want to view the span details in context of a full trace, click an example span’s dot in a chart or click its row in the Span samples table. Or from the Span Details panel, click View trace.
Attributes
The Attributes tab displays all the span and resource attributes associated with the span. Use the buttons to view just one or the other or use the search bar to find a specific attribute.
You can use the panel to adjust the query:
- Hover over the attribute name to add a group-by to that attribute
- Hover over the attribute value to filter to that value
Hover over the attribute value and click Query in notebooks to run a query filtered to that attribute in a notebook.
For certain attributes, like the client library, you can click a link to visit that version’s GitHub page.
Events
The events tab shows span events and any associated logs.
Click on an associated log to view it the logs tab. The tab view shows logs from the relevant span_id that were sent between the span’s start and end time (plus one minute on each side).
Add charts to a notebook
Use the More ( ⋮ ) icon to add this view to a notebook. The three charts are added to a notebook where you can do more advanced querying like group-by or time comparisons.
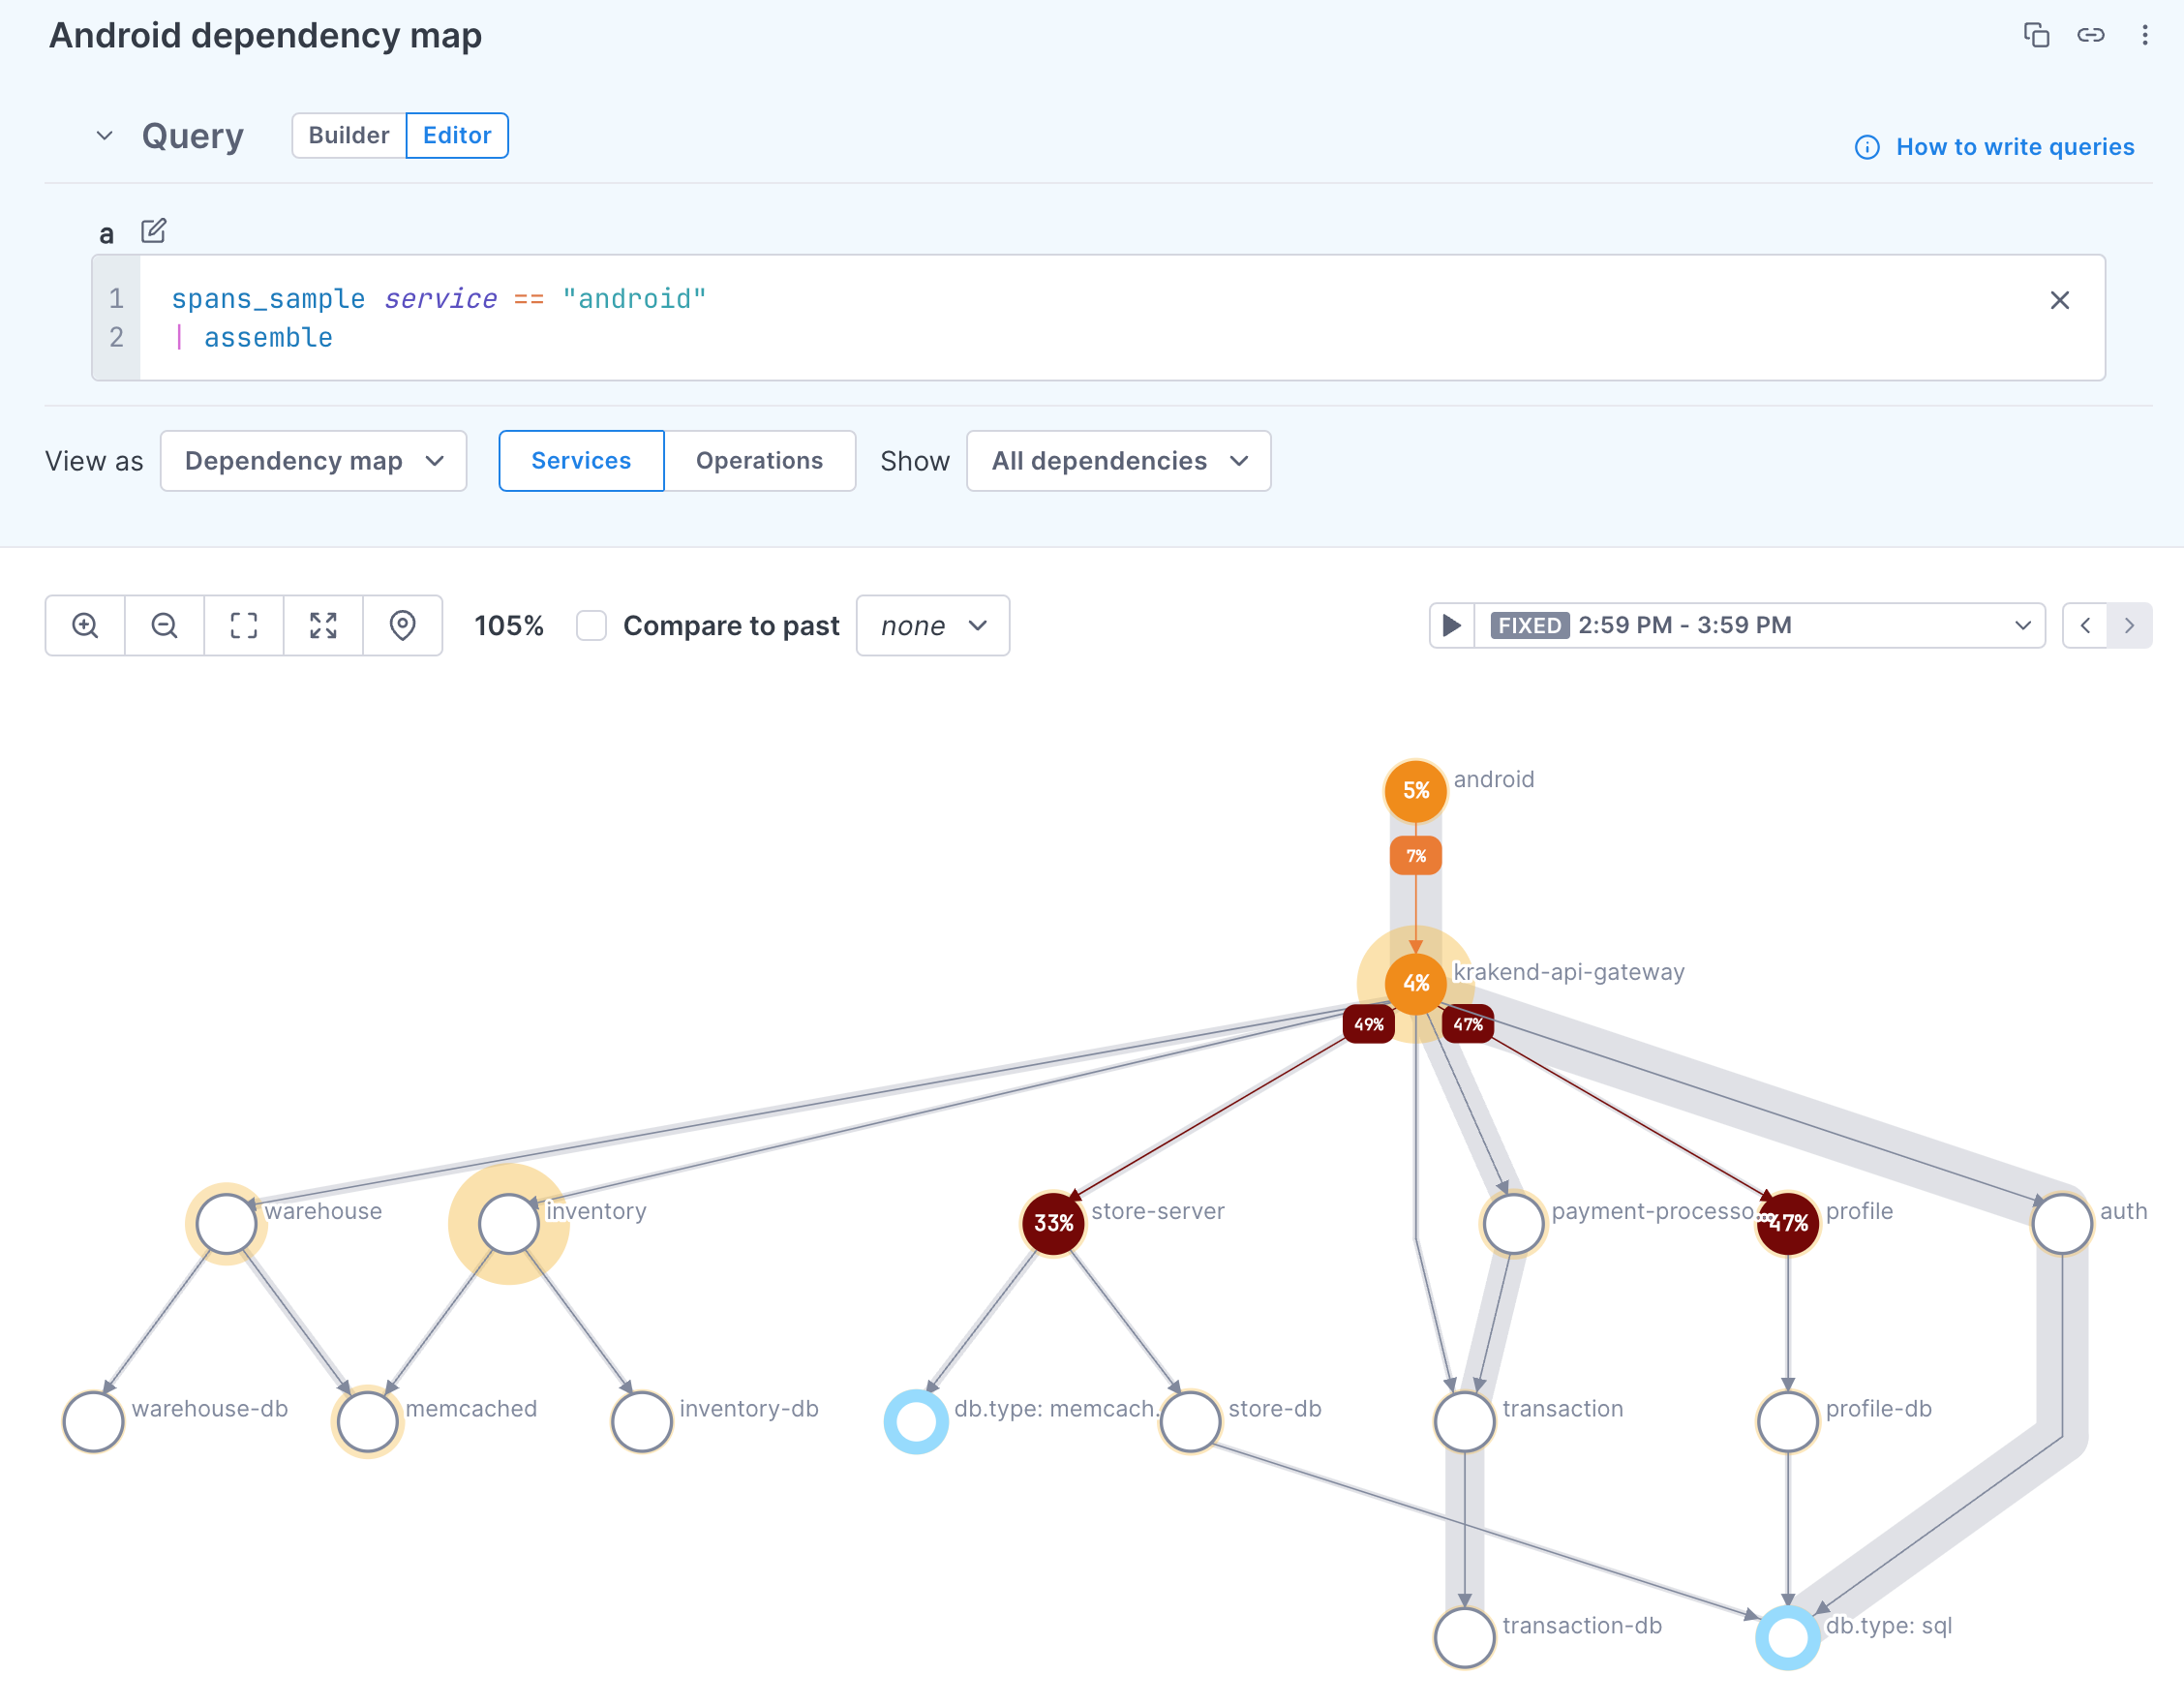
Create a dependency map
To view the relationships of the selected service and operation to upstream and downstream services and operations, click Create dependency map to add it to a notebook.
Share Span Explorer
Use the More ( ⋮ ) icon and select Share to create a link to this Span Explorer view.
Updated Sep 5, 2024