
You use the Trace view to see a trace from the beginning to the end of a request. A flame graph shows the full trace with each span in a hierarchy, allowing you to see the parent-child relationship between spans, as well as the path the request took through the trace (spans with errors are shown in red).
Clicking a span shows details in the right panel, based on the span’s metadata. Traces can be bookmarked, shared, and reviewed by your team. 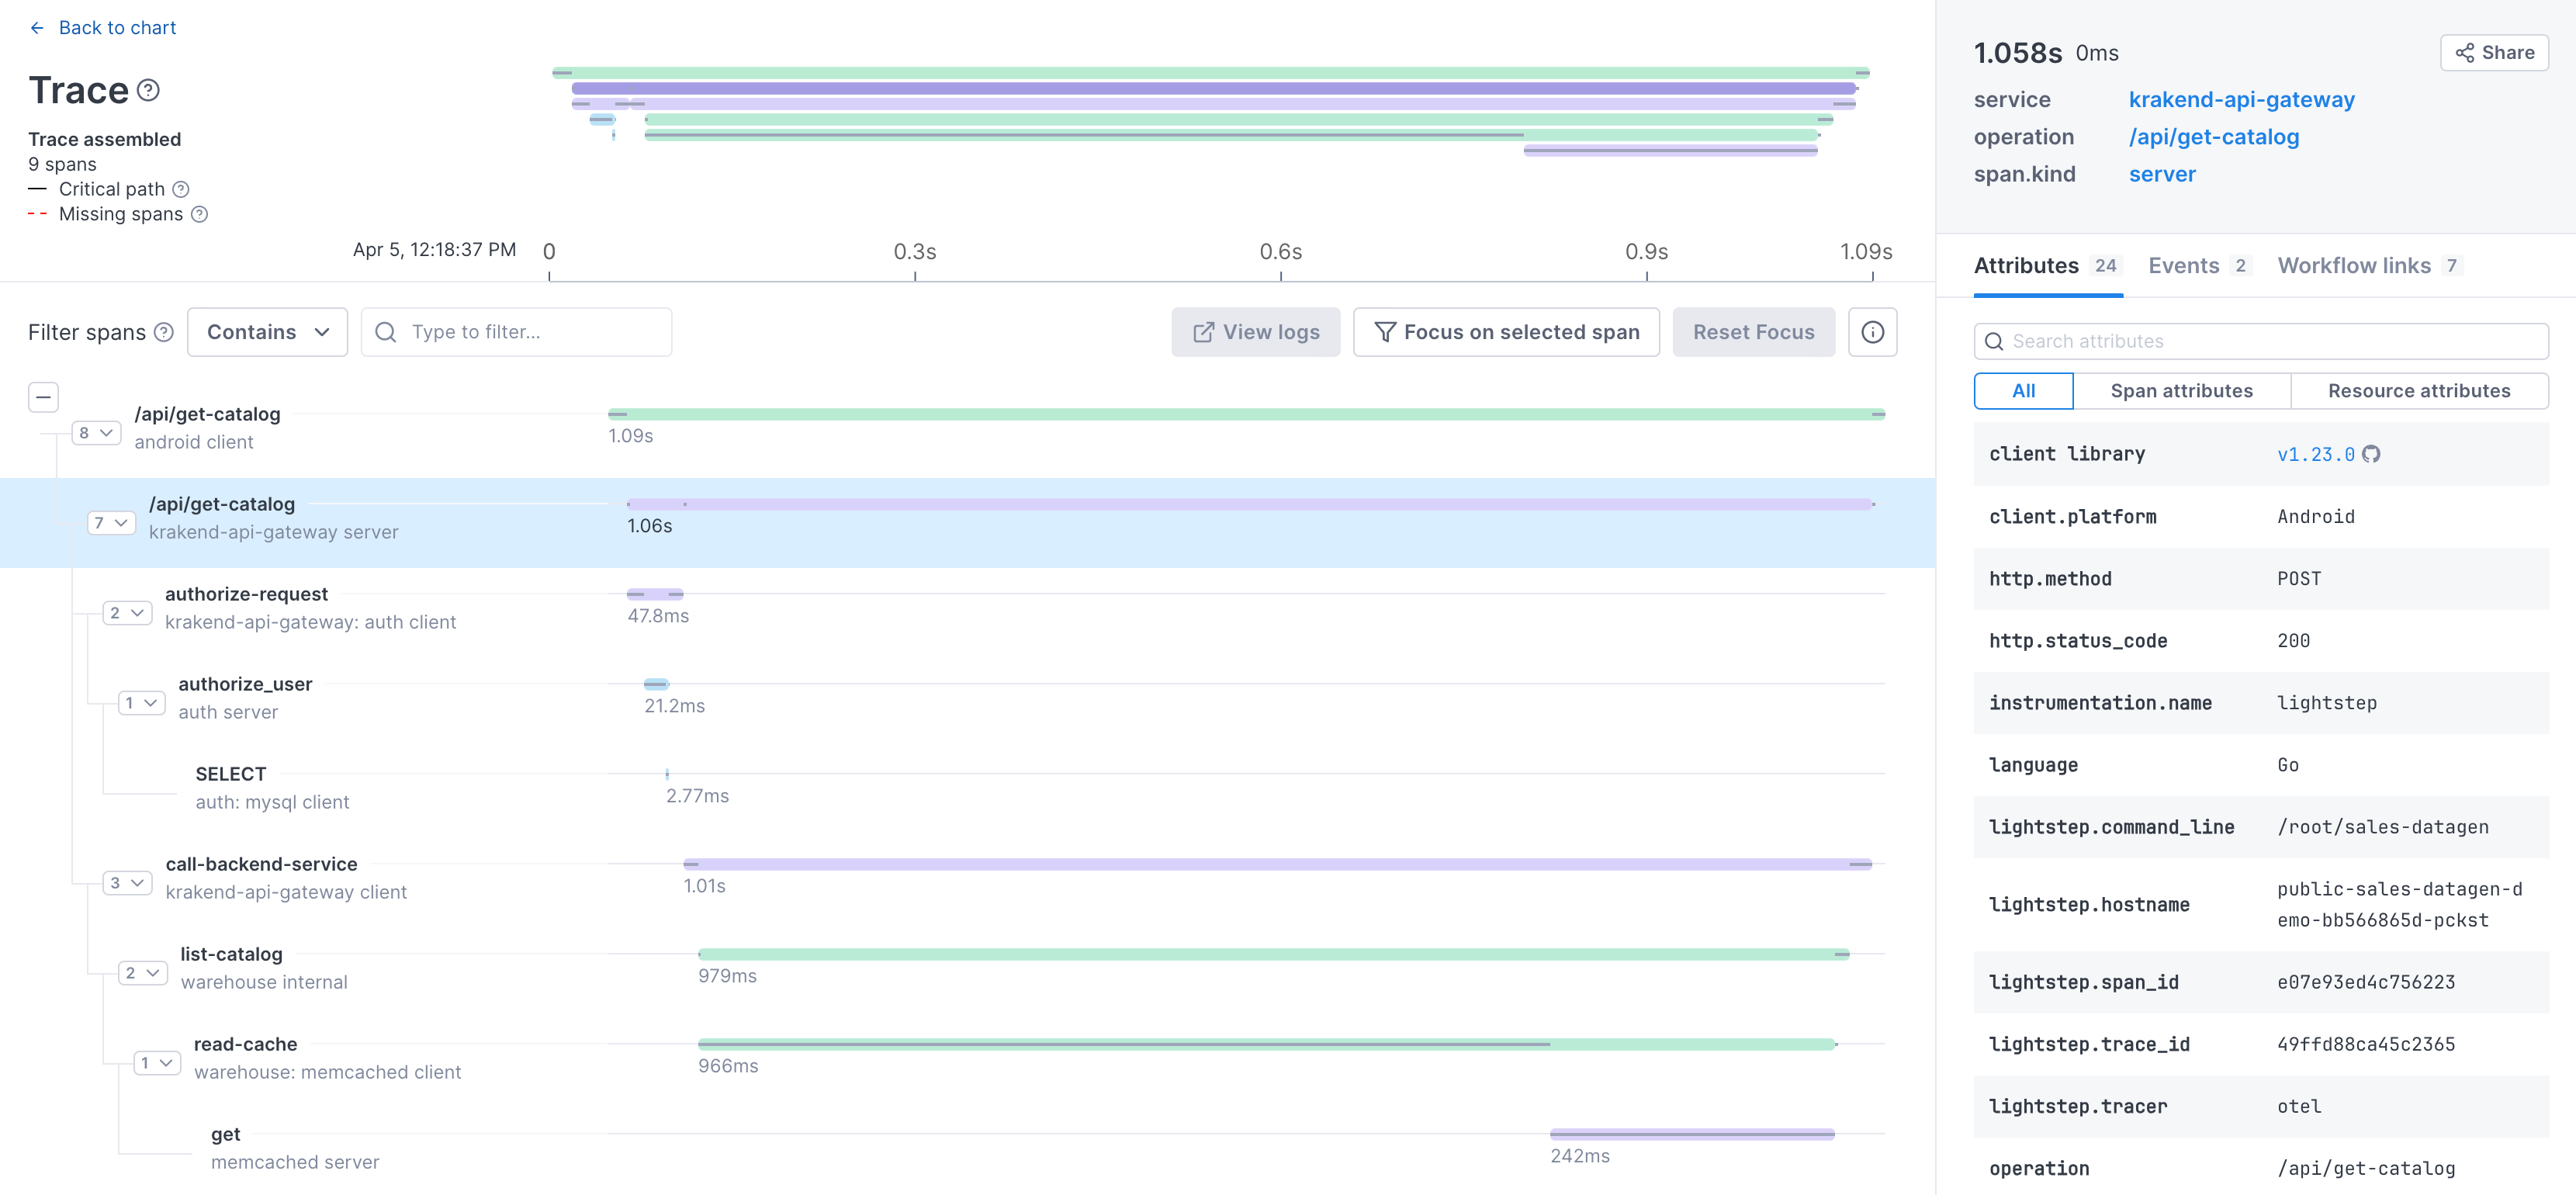
The data is retained for the length of your retention window.
When viewing a trace from a notebook or dashboard, Cloud Observability retrieves spans from the current retention window and builds the trace (that’s why you’ll often see Trace Assembling with a spinning icon as the data loads). Traces built from historical data (such as Streams or links) load more quickly.
When traces contain over 4,000 spans the graph is partially loaded. Click the More button to load the child spans. Only the first 4,000 spans for the selected parent are loaded, which may mean there are unseen spans (the largest generation of parent-to-child spans is 4,000).
If you’re viewing a trace from outside a notebook or dashboard, or from data older than the retention window, the total number of spans displayed is capped at 4,000.
Access Trace view
You access the Trace view by clicking on a span from several places in Cloud Observability:
- Logs tab: Click any log to open the Log viewer. Then click Open linked trace to access the Trace view. Open linked trace only works for logs configured with a span ID.
- Notebook, dashboard, and alert span charts: With the Show span samples toggle on (not available on all visualizations), click a dot or error triangle to view the trace.
- Service diagram in Explorer: Click on a span in the side panel.
- Trace Analysis table in Explorer: Click a span in the table to open. The span is selected in the trace.
- Developer Mode: Click View Trace to see traces sent by the Developer Satellite.
View Trace graph
The Trace view is a flame graph that displays the overall trace. Spans participating in the trace are displayed in different colors to give a sense of the overall service interactions. You can click on a colored bar to select the corresponding span and see its details.
View spans
The graph shows where each span participates in the trace by presenting a hierarchical representation of spans in parent/child relationships, in the order that they participated in the request. The number to the left of the span tells you how many children that span has. You can collapse all or part of the hierarchy, focus on just one span and its hierarchy, and filter to see only specific spans.
Keyboard shortcuts: Use ↑↓ to move between spans and →← to open and collapse child spans.
Click on a span to view details provided by span metadata like attributes and events and any Workflow Links you’ve created.
See the critical path
Cloud Observability automatically runs a heuristic to determine and display the critical path of a given trace, using a black line. During a request, a parent span might be waiting for a child span (or even a child of the child) to complete before it can finish. The critical path is the time when an operation in a span is actively doing something.
Consider this trace of a request. Each horizontal bar represents the full duration of an operation’s span. You can see that the spans towards the top take much longer, mostly because they’re waiting for the spans further down the stack to complete. Cloud Observability shows you the critical path through the trace, allowing you to see how long that operation was actually active during the request and to help identify bottlenecks in the overall transactions. 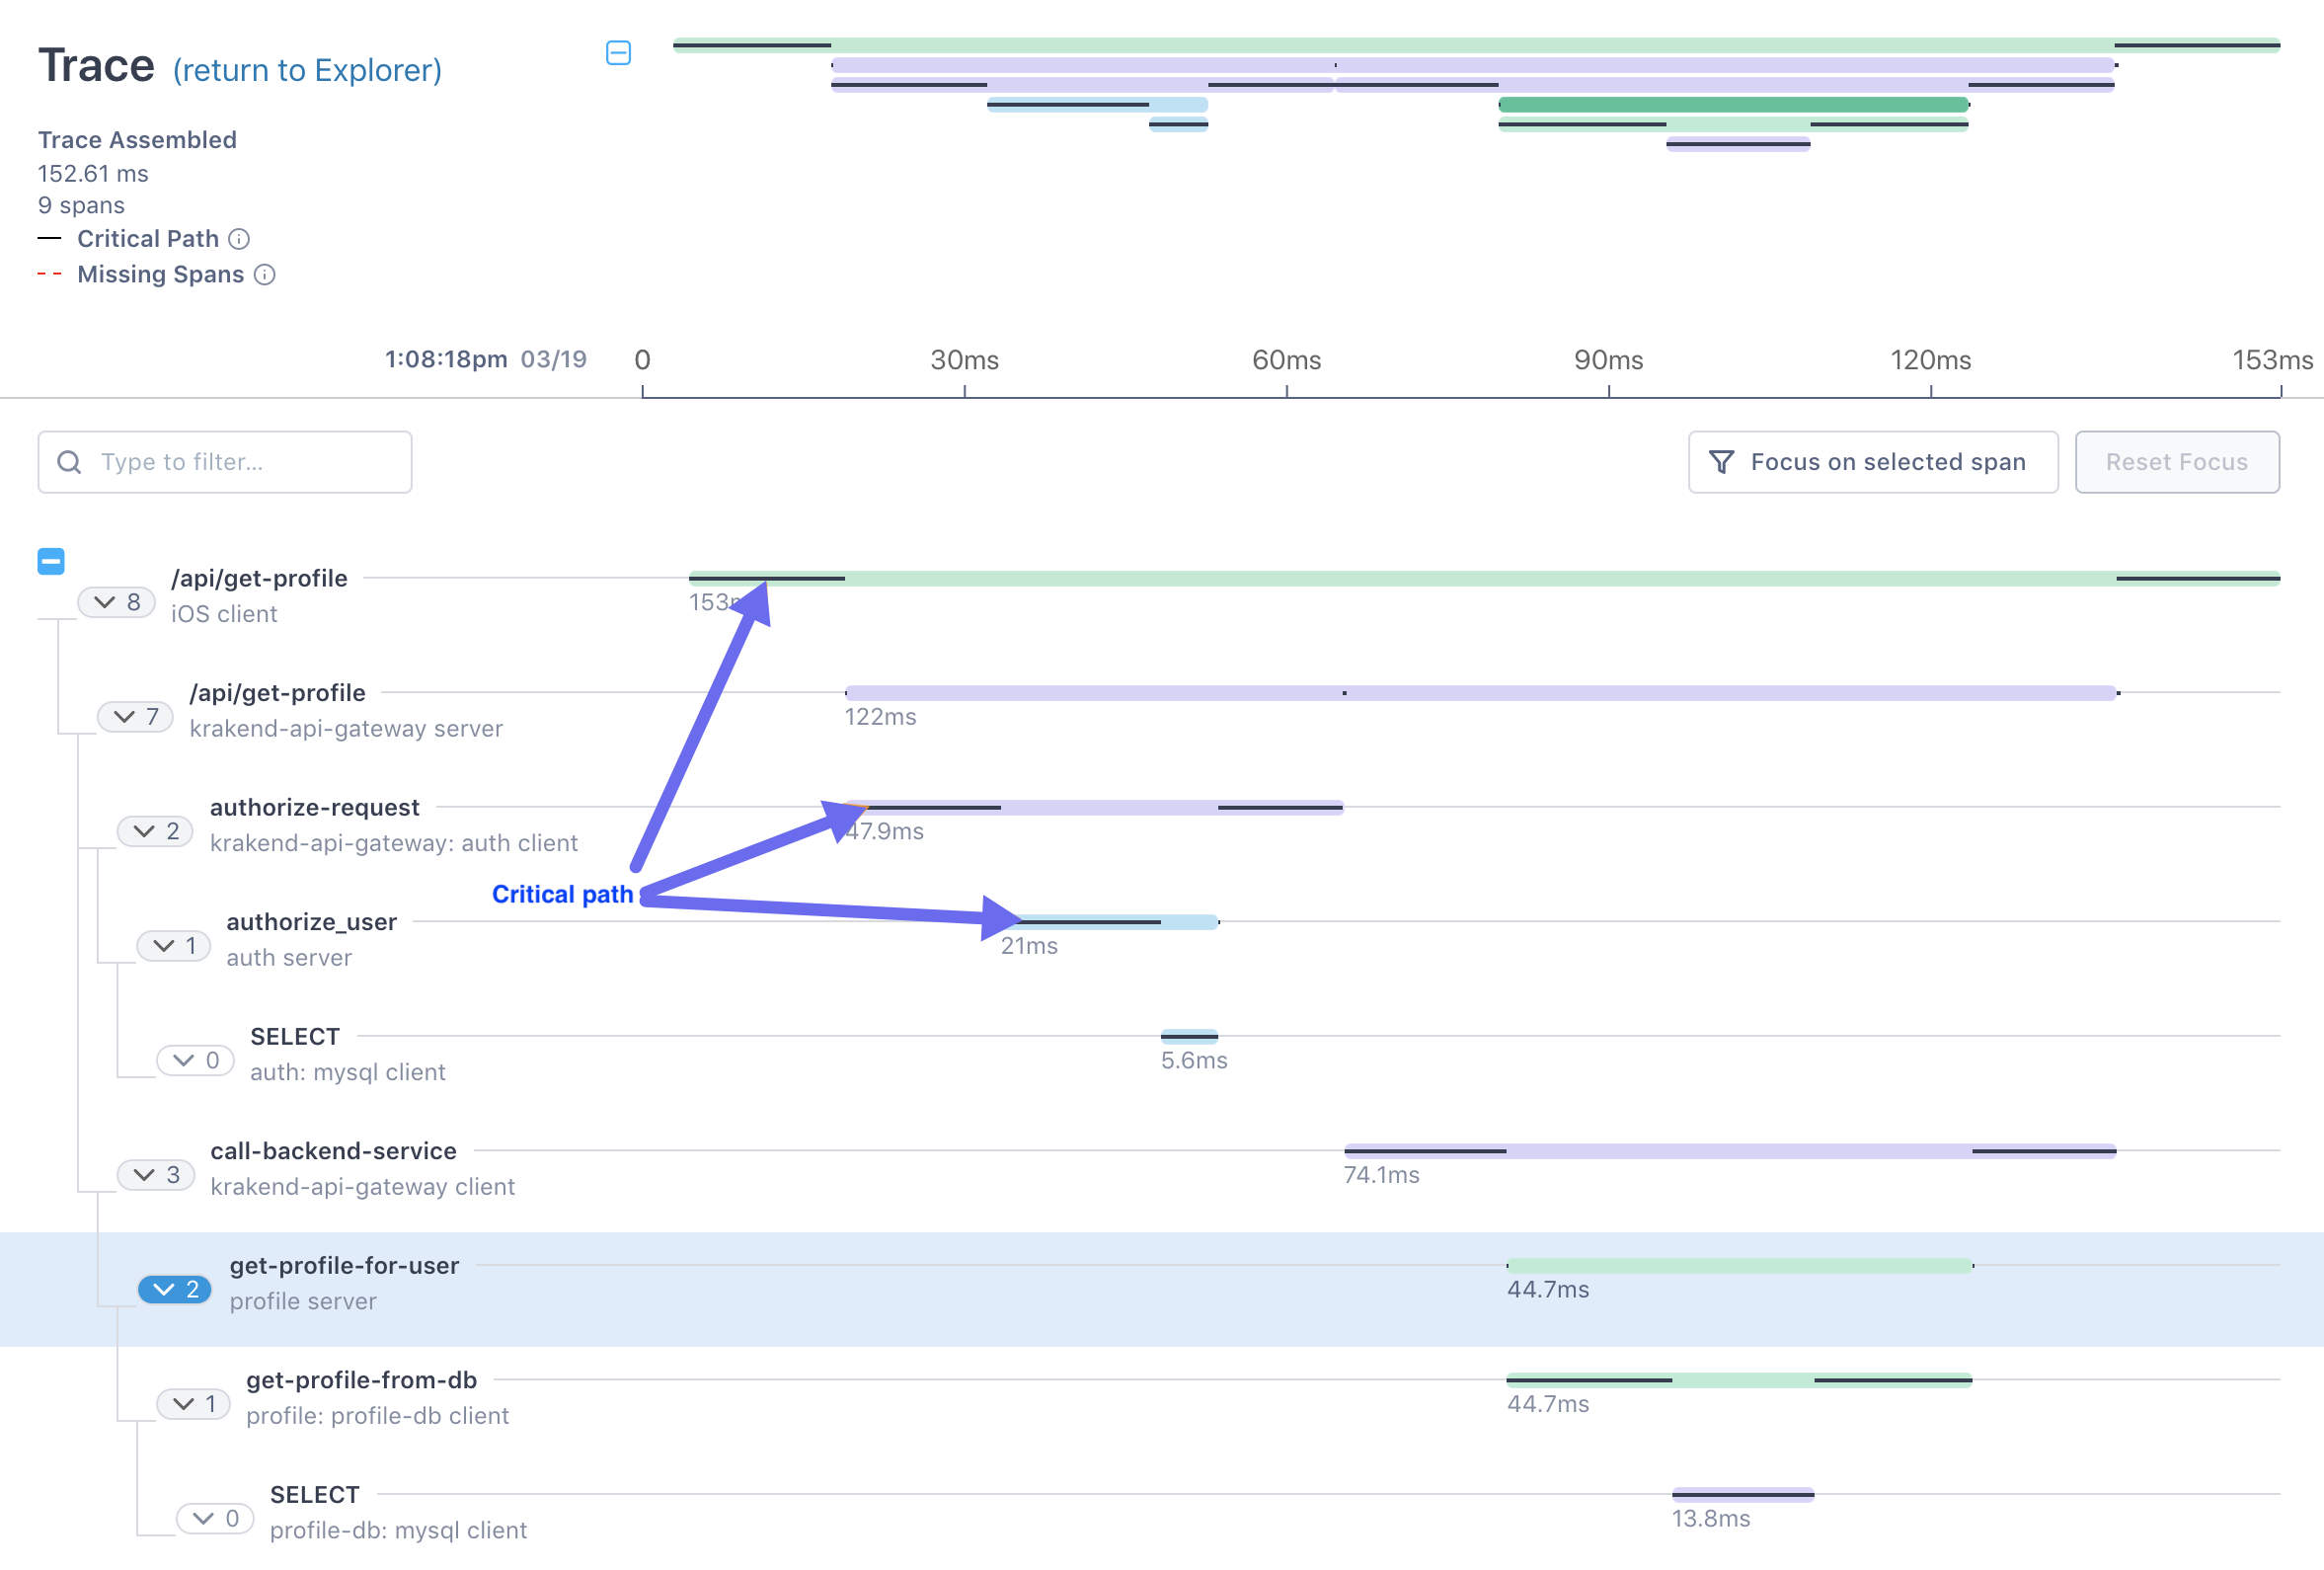
Find errors
When errors are found on a span, Cloud Observability displays the span in red. The Details panel shows that there’s an error, and logs shown on the Events tab should help determine the nature of the error.
Missing spans
Spans highlighted with a red dashed box are missing spans; their parent span wasn’t found in the data from the Microsatellites. 
Missing spans can happen when either the Microsatellite or Collector dropped the span (for example, your pool is not auto-scaling to keep up with traffic) or the tracer dropped the span (for example, your application crashed or never called span.flush() ). When you see missing spans, check the Reporting Status page(for Microsatellites) to find the culprit.
Modify display of spans
You can change the graph’s display to zero in on just what’s important.
Collapse the hierarchy
You can collapse the hierarchy to the level of the selected span. Select a span and click the Collapse/Expand button at the top of the graph. Parent spans with collapsed children display the number of hidden child spans.
To expand the hierarchy to reshow all spans, re-click the Collapse/Expand button.
Keyboard shortcuts: Use ↑↓ to move between spans and →← to open and collapse child spans.
Focus on a single span’s hierarchy
You can show just the spans in a sub-hierarchy to get a closer view. Select the span to focus on and click Focus on selected span. The graph filters to show only that hierarchy.
Click Reset Focus to show the full graph.
Filter the graph
You can show only specific operations or services. Enter a name into the search bar and Cloud Observability filters the table.
View details of a span
The panel to the right of the graph shows details for the selected span.
Service and operation
The top of the panel shows the duration of the span, along with its latency contribution. Below that are the service and operation name and the span type. Click on any of these to run a query in a notebook. The query is filtered down to the link you click. For example, if you click the span kind link, the query is filtered to the service, operation, and span kind.
Attributes
The Attributes panel displays all the span and resource attributes associated with the span. Use the tabs to view just one or the other or use the search bar to find a specific attribute.
Hover over the attribute value and click Query in notebooks to run a query filtered to that attribute in a notebook.
For certain attributes, like the client library, you can click a link to visit that version’s GitHub page.
Events
The events tab shows span events and any associated logs.
Click on an associated log to view it the logs tab.
The tab shows logs with the relevant span_id between the span’s start and end time (plus one minute on each side).
Workflow links
The Workflow Links panel shows any links you’ve created that apply to the selected span. Workflow Links allow you to create dynamic links to information outside of this page, allowing access to all the info you need when you need it. For example, say you want to view your playbook when the span includes a certain error code. Cloud Observability can construct these customized links automatically, using attributes and other metadata from a span in the trace.
Share a trace
You can share the URL for the trace using the Share button and the recipient is taken to that exact trace in Cloud Observability. When you integrate Cloud Observability with Slack, you can share previews of the Trace View page in any Slack channel. Other Slack users can see information about the selected span, its parent span, critical path information, and errors. Cloud Observability users can click View Trace to jump right to that page. 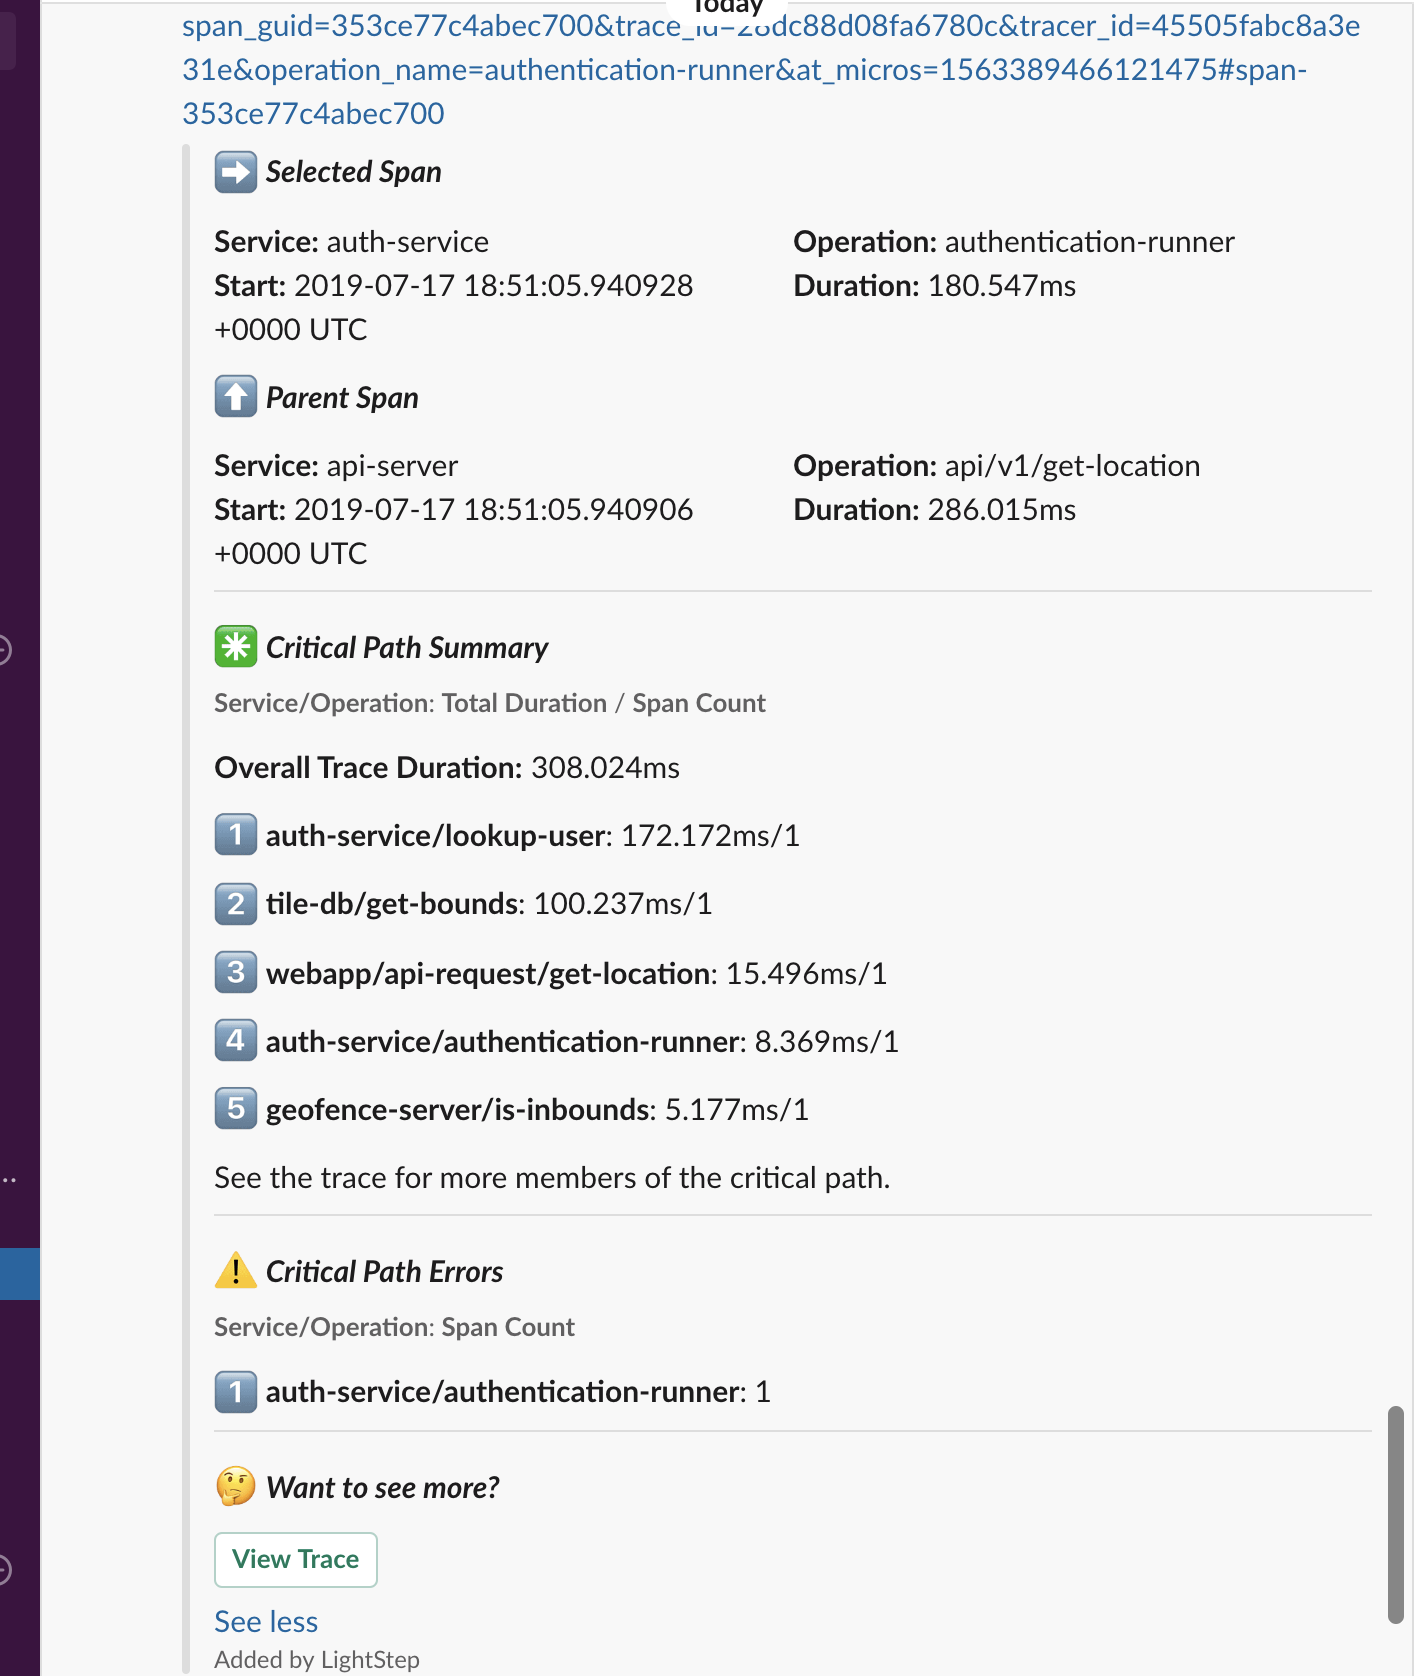
See also
Create links to important information
Use attributes and log events to find issues fast
General guidelines for tracing instrumentation
Updated Apr 8, 2024