
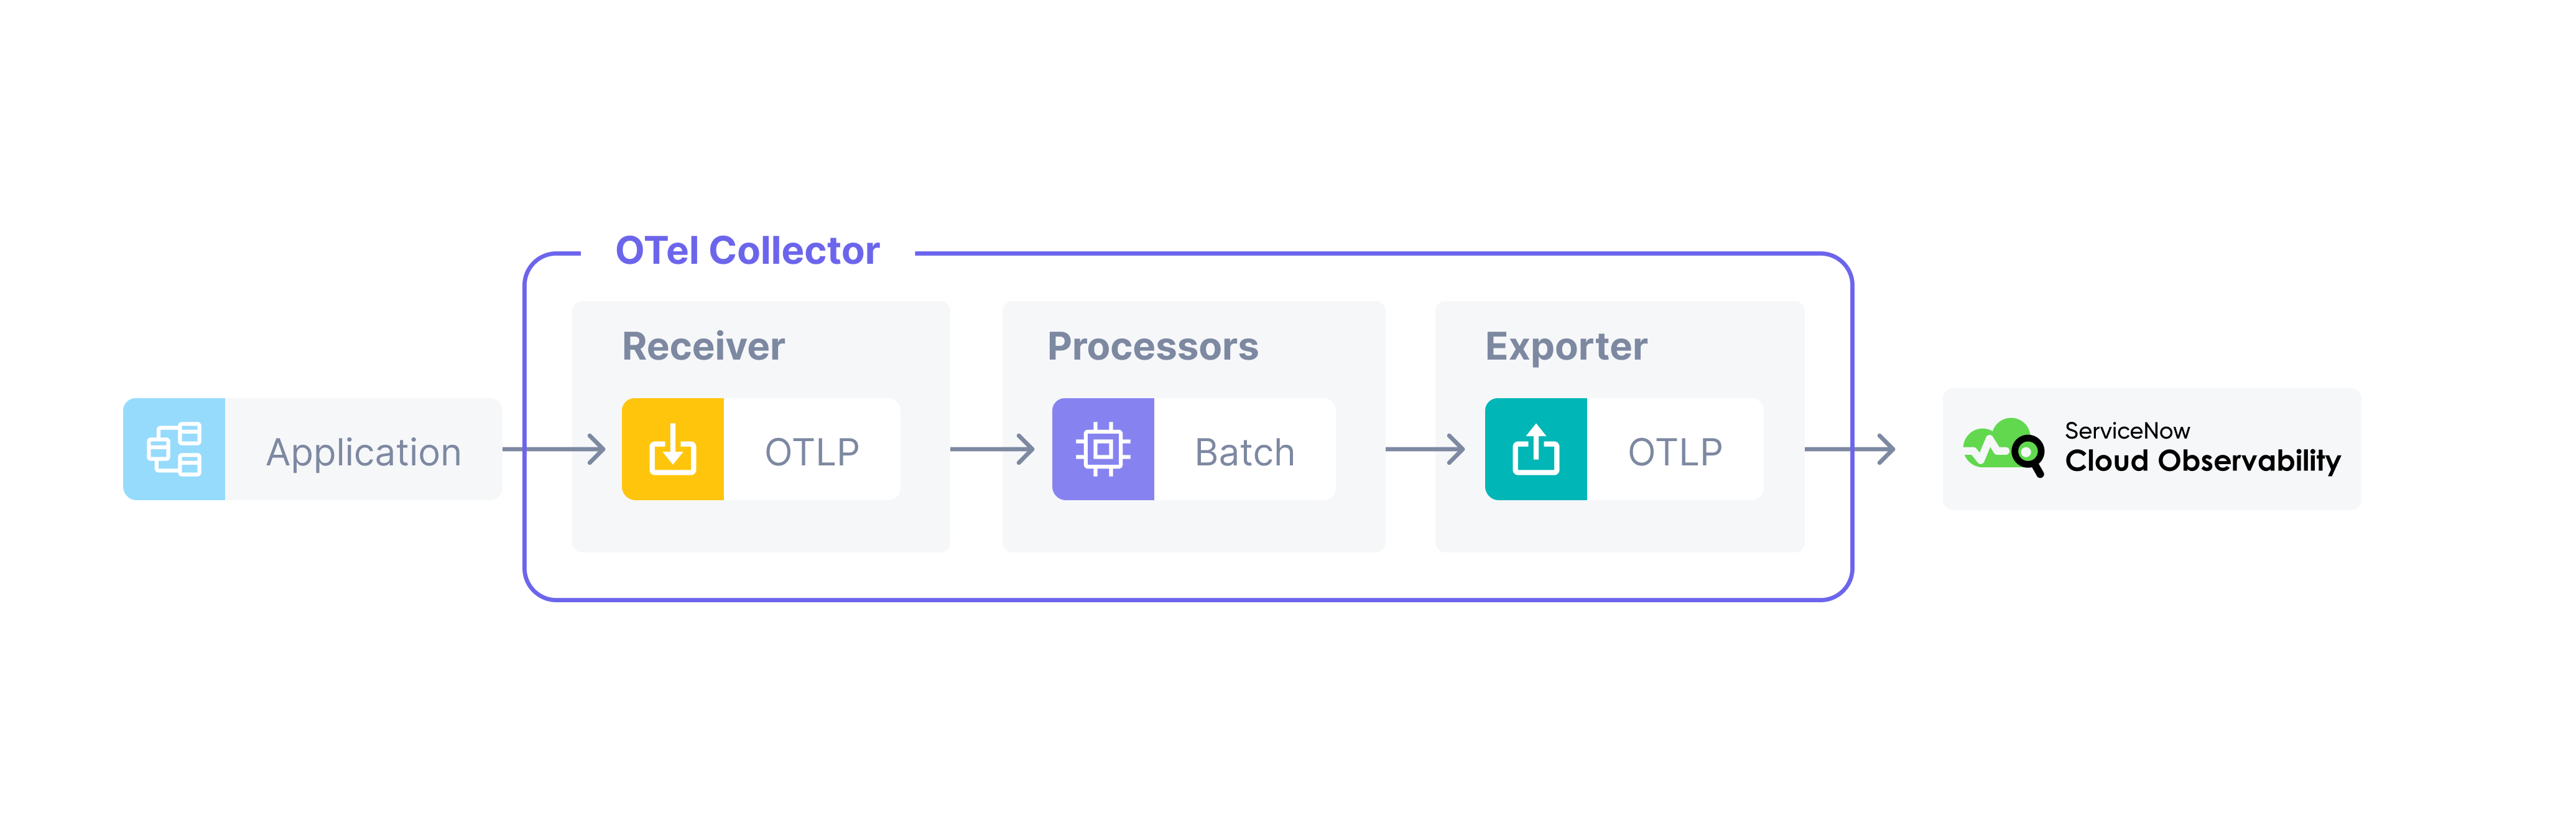
The OpenTelemetry Collector allows for metric data to be received, processed, and exported via OpenTelemetry Protocol (OTLP). You can use the Collector to ingest a number of different vendor metrics and also to scrape existing Prometheus, JMX, and other metrics.
To integrate with a metric source using the Collector, you need to first configure the Collector to export the data to Cloud Observability in telemetry pipelines. Once that’s done, you can configure any number of receivers to send data to the Collector. The Collector then processes that data and sends it through the configured pipeline to Cloud Observability.
For instructions on how to setup an OpenTelemetry Collector in a Kubernetes cluster to ingest Prometheus metrics, see Ingest Prometheus metrics using an OpenTelemetry Collector on Kubernetes
Not all metrics receivers available for the OpenTelemetry Collector have been tested by Cloud Observability, and there may be bugs or unexpected issues in using these contributed receivers with Cloud Observability. File any issues with the appropriate OpenTelemetry community.
Prerequisites
An access token for the project to report metrics to.
Configure the Collector exporter
Follow these instructions to download and configure the Collector, being sure to:
-
Configure an exporter and set the endpoint to Cloud Observability at
ingest.lightstep.com:443Organizations using the EU data center should use
ingest.eu.lightstep.com:443. - Add your Cloud Observability token as a header for the exporter
- Configure a pipeline for metrics that exports data to the exporter endpoint.
1
2
3
4
5
6
7
8
9
10
11
12
# add a new exporter and update a pipeline to send metrics to Cloud Observability
exporters:
  otlp/lightstep:
    endpoint: ingest.lightstep.com:443 # US data center
    # endpoint: ingest.eu.lightstep.com:443 # EU data center
    headers:
      "lightstep-access-token": "${LS_ACCESS_TOKEN}"

service:
  pipelines:
    metrics:
      exporters: [otlp/lightstep]
Installation of the OpenTelemetry Collector varies, please refer to the collector documentation for more information.
Add a receiver to the Collector
You need to configure a receiver specific to the metrics you want to ingest. Visit the Integrations search page and use the filters at the top to view only OTel Collector integrations, and then browse or search for the metrics to ingest. These topics describe how to configure the Collector for that metric, as well as any configuration needed for the metrics to report into the Collector.
You can monitor your Collectors running in Kubernetes using the pre-built dashboard.
See also
Troubleshoot missing data in Cloud Observability
Updated Nov 22, 2023