The following table shows how long Cloud Observability stores your logs, metrics, and traces by default, and if that time period is configurable. Continue reading the topic to understand the retention time periods and why you may want to change them.
| Data type | Default Retention | Configurable |
|---|---|---|
| Logs cold retention | 30 days | Yes* |
| Logs hot retention | 3 days | Yes* |
| Metrics | 13 months | No |
| Events | 13 months | No |
| Notebook auto-saved queries | 28 days | Yes |
| Notebook snapshots | 28 days | Yes |
| Streams - SLI charts | 2 years | No |
| Streams - exemplars | 28 days | Yes |
| Traces | 3 days | Yes* |
*Cloud Observability offers longer retention periods for logs and traces. Contact your customer success representative for more information.
To understand how long data is retained in Cloud Observability, it’s important to first understand how data is obtained and stored. Cloud Observability ingests three data types: logs, metrics, and traces.
Logs
Log collection and storage
Cloud Observability ingests logs from the logingest.lightstep.com endpoint (loginest.eu.lightstep.com for the EU data center)
and stores logs by timestamp in a time series database.
Cloud Observability has several features to help you use fewer resources and lower log-storage costs:
- Hot storage - Store logs for shorter periods in a queryable format.
- Cold storage - Store logs for longer periods in a less expensive, non-queryable format.
- Rehydration - Move logs from cold to hot storage to query older logs.
Log retention
By default, Cloud Observability keeps logs in hot storage for 3 days and cold storage for 30 days. To change those retention periods per project, reach out to your customer success representative.
Metric data
Metrics collection and storage
Cloud Observability stores each unique combination of a metric name, timestamp, and attribute name/value pairs as a time series in a time series database. That data, once ingested, can be queried to create charts in notebooks, dashboards, and alerts.
If your metric is a distribution type (that is, it automatically aggregates values by percentiles), then each percentile becomes a separate time series.
Metric retention
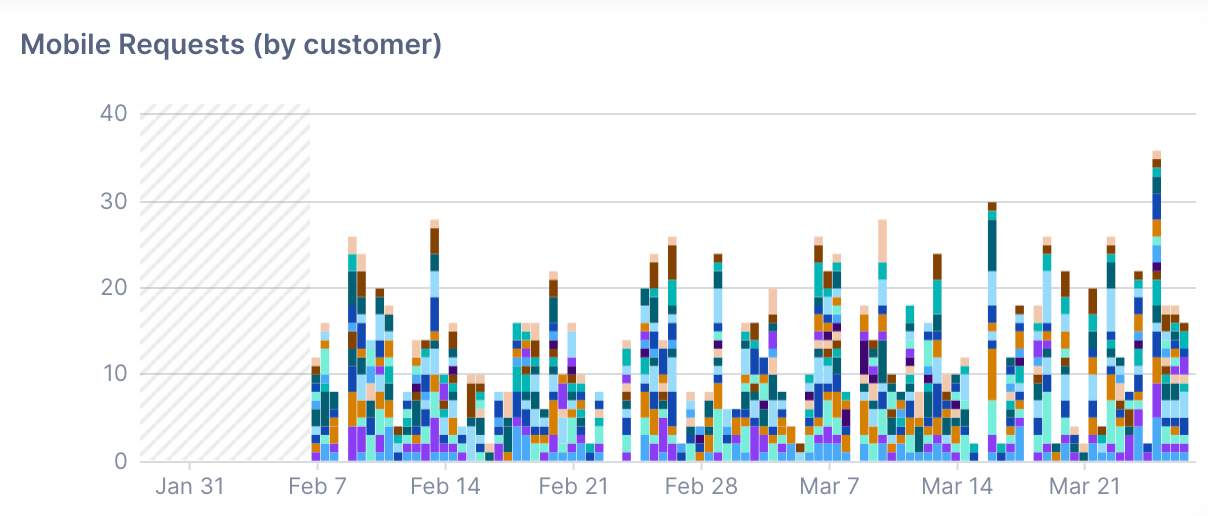
Your time series are retained for 13 months. You can create a chart and view the corresponding data up to 13 months in the past (or up to whenever it began reporting to Cloud Observability). If you change the chart to a time period that exceeds the retention period, the chart displays hashed lines to let you know data isn’t available.

Trace data
Trace data collection and storage
Your trace data is handled differently. Instead of ingesting that data directly into a database, Cloud Observability uses Microsatellites to collect that data from your OpenTelemetry instrumentation. That data is then sent to the Cloud Observability platform, which then processes and temporarily stores that data during trace assembly. The length of time between the newest and the oldest span currently held for analysis is the retention period, where it can be queried by charts in notebooks or dashboards, and viewed as performance indicators in the Service directory.
For real-time analysis, you can view the past hour of data in Explorer and the Service diagram.
Trace data retention
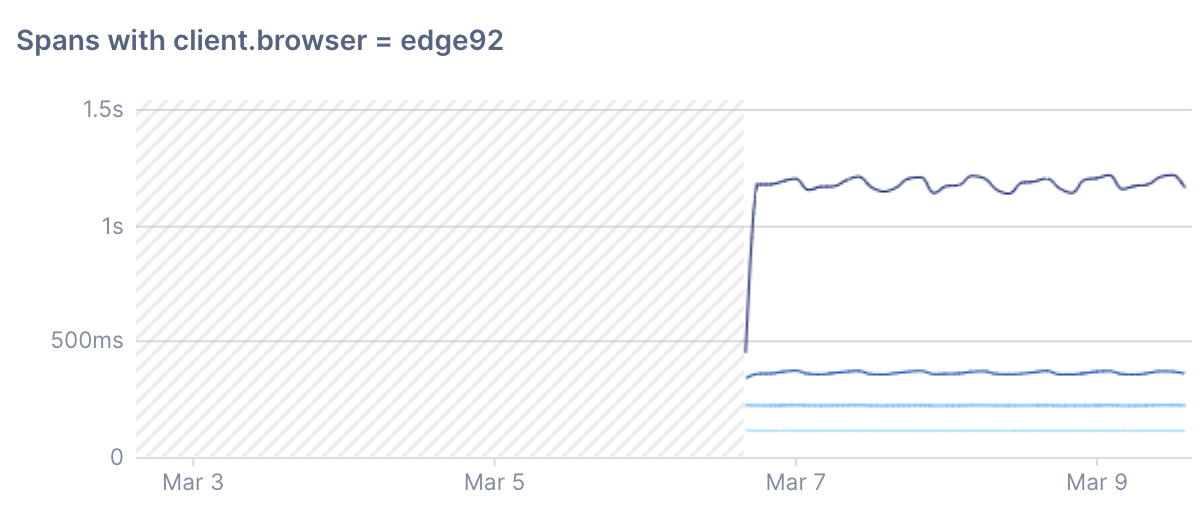
By default, the retention period for trace data (including example traces) is three days from the time you make the query. Each query from a chart and each visit to the Service directory returns up to the past three days of data that match the query (you can control the amount of time shown on a chart using the time picker). If the time range for a chart is set to beyond three days from when you made the query, the chart displays hashed lines to show that data is no longer available.
Cloud Observability offers a retention period of longer than three days. Contact your customer success representative for more information.

Retain span queries as Streams for dashboards
Sometimes you need to see data beyond the retention period, especially when creating dashboards for monitoring purposes. When you know you will need to keep data longer than the retention period, you can create the query as a Stream to retain the query, and Cloud Observability will continuously collect and save that data from the Microsatellites. The span’s data and and any associated traces are retained for as long as your data retention policy. The service level indicators (SLIs) shown on a chart are stored for two years, regardless of your data retention policy.
The default data retention policy is 28 days. You can configure your data retention policy in Settings.
Cloud Observability charges for the amount of trace data collected by the Microsatellites, so choosing to save data beyond the retention period impacts your monthly charges.
Auto-saved trace data in notebooks
Data retention for charts in notebooks is handled a bit differently. As with dashboards, by default you can explore up to the past three days of trace data. But because your notebooks become useful tools in rituals like post-mortems, you often want to have a record of the data you worked with as you investigated an issue. Cloud Observability automatically saves that data from when you created the chart, so you can continue to view the chart and the example traces from that time period.
If you try to change the query once it’s auto-saved (for example, by adding filters or changing the group-by), you’ll be overwriting the original query and may lose that data. You can duplicate the original query onto a new chart to get the most recent data or to make changes, without losing the original data.
The auto-saved chart is retained for as long as your data retention policy.
Notebook snapshots
Additionally, sharing information becomes important during an investigation. You can share a read-only snapshot of a notebook at any point in time and that snapshot is also saved for the period of your data retention.
See also
Updated Sep 22, 2023
