Microsatellites aren’t supported for organizations hosted in the EU data center.
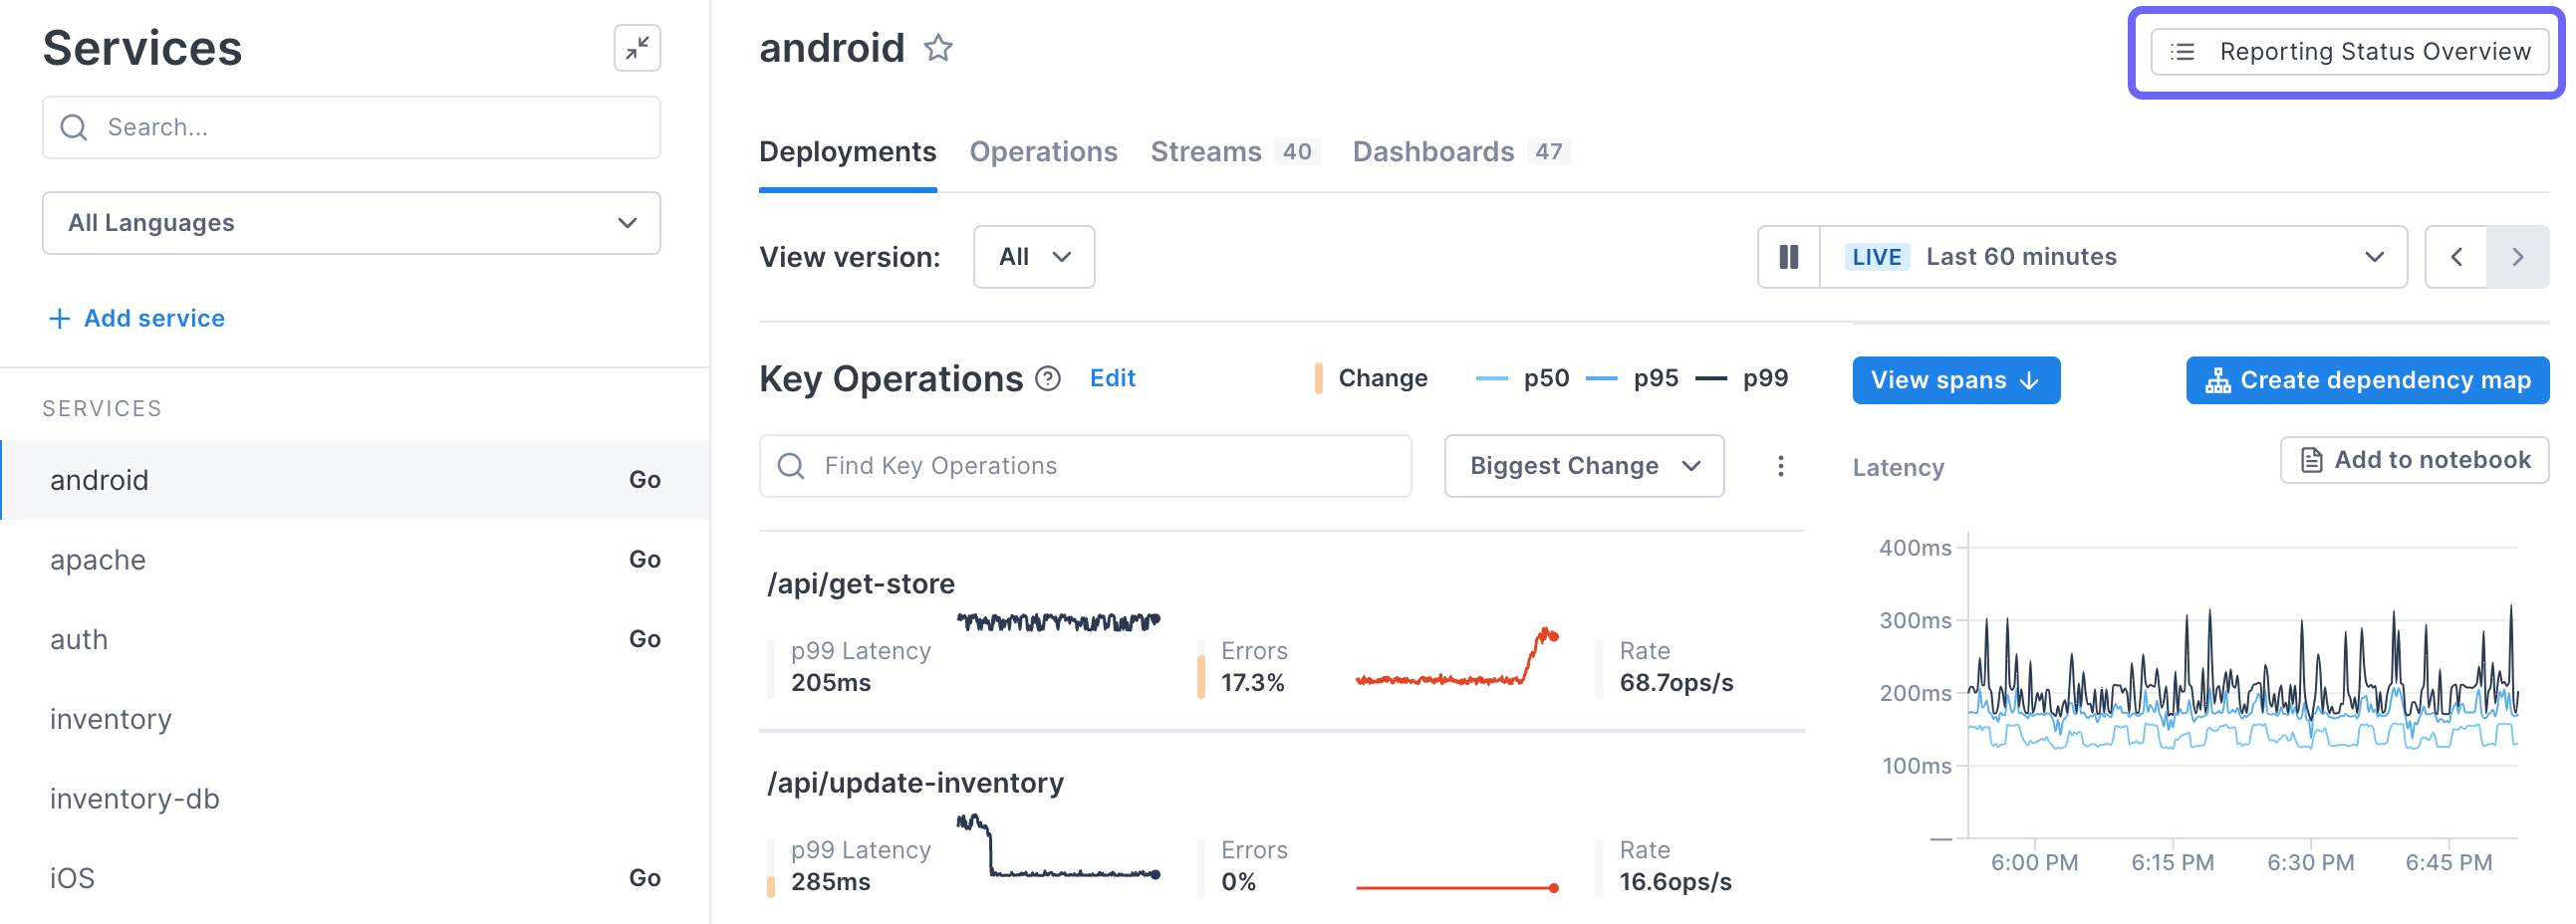
The Reporting Status page provides an active view of the tracer clients and Microsatellites over a trailing 60-second window. You access the Reporting Status dashboard from the top of the Service Directory page. 
You can use the data to understand:
- Instrumentation coverage: Gauge instrumentation coverage at-a-glance
- Data volume: Observe data volumes coming from services
- Data loss: See if dropped spans are causing data loss
- Active components: Verify active services and see a new service come online
- Tracer library status: Check the active versions of the tracer libraries in the application
- Distinct service instances: Estimate the count of service instances (e.g. mobile apps, web browsers) currently reporting to the application
All data in the tables below is based on a trailing 60-second window
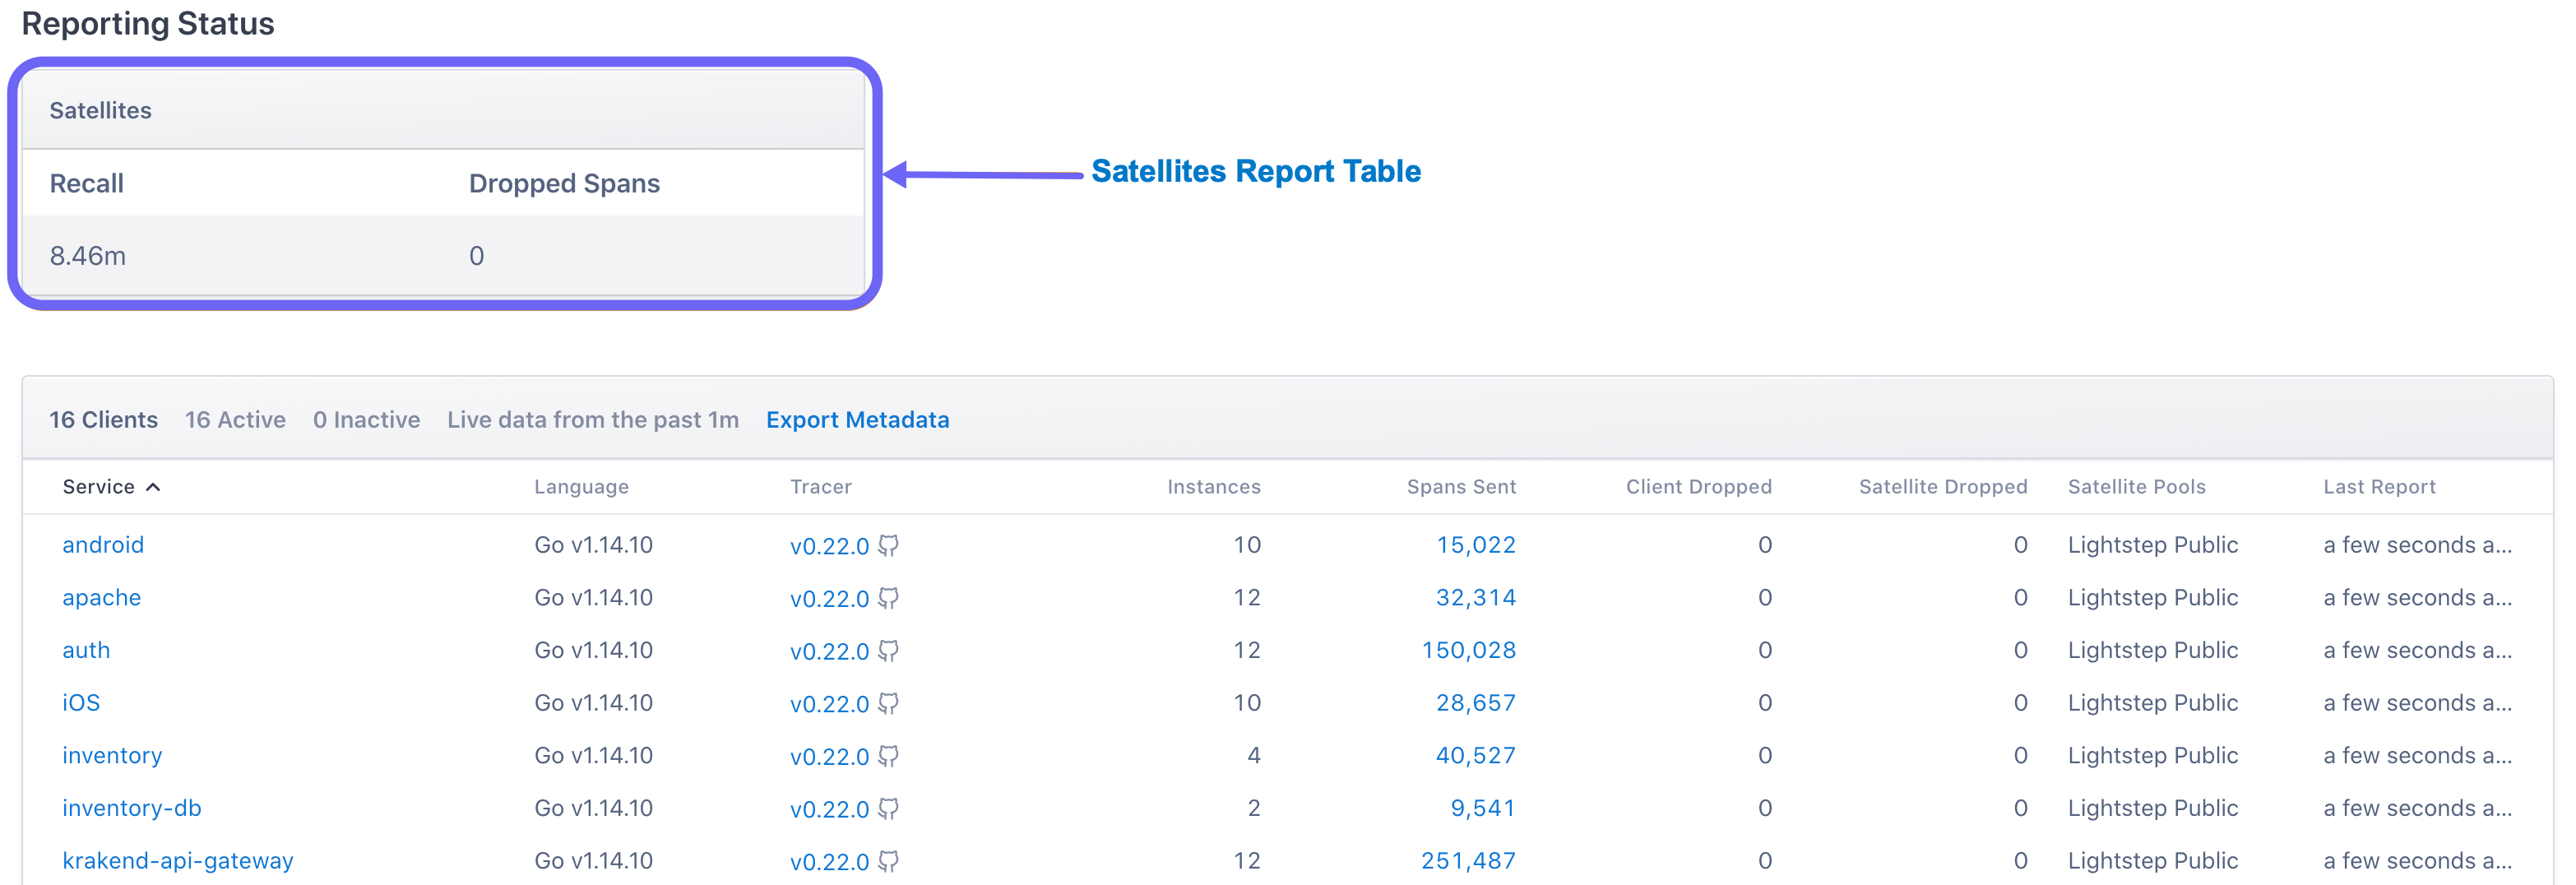
Satellites Report table
The Satellites Report table gives you an overview of the performance of your Microsatellites.
- Recall: An estimate of the oldest operation data still available for assembling traces.
- Dropped spans: Spans sent by client tracers to Microsatellites but dropped before being processed. There may be too much data being reported by clients for the available Microsatellite resources (see the Clients Report table for a breakdown by component).

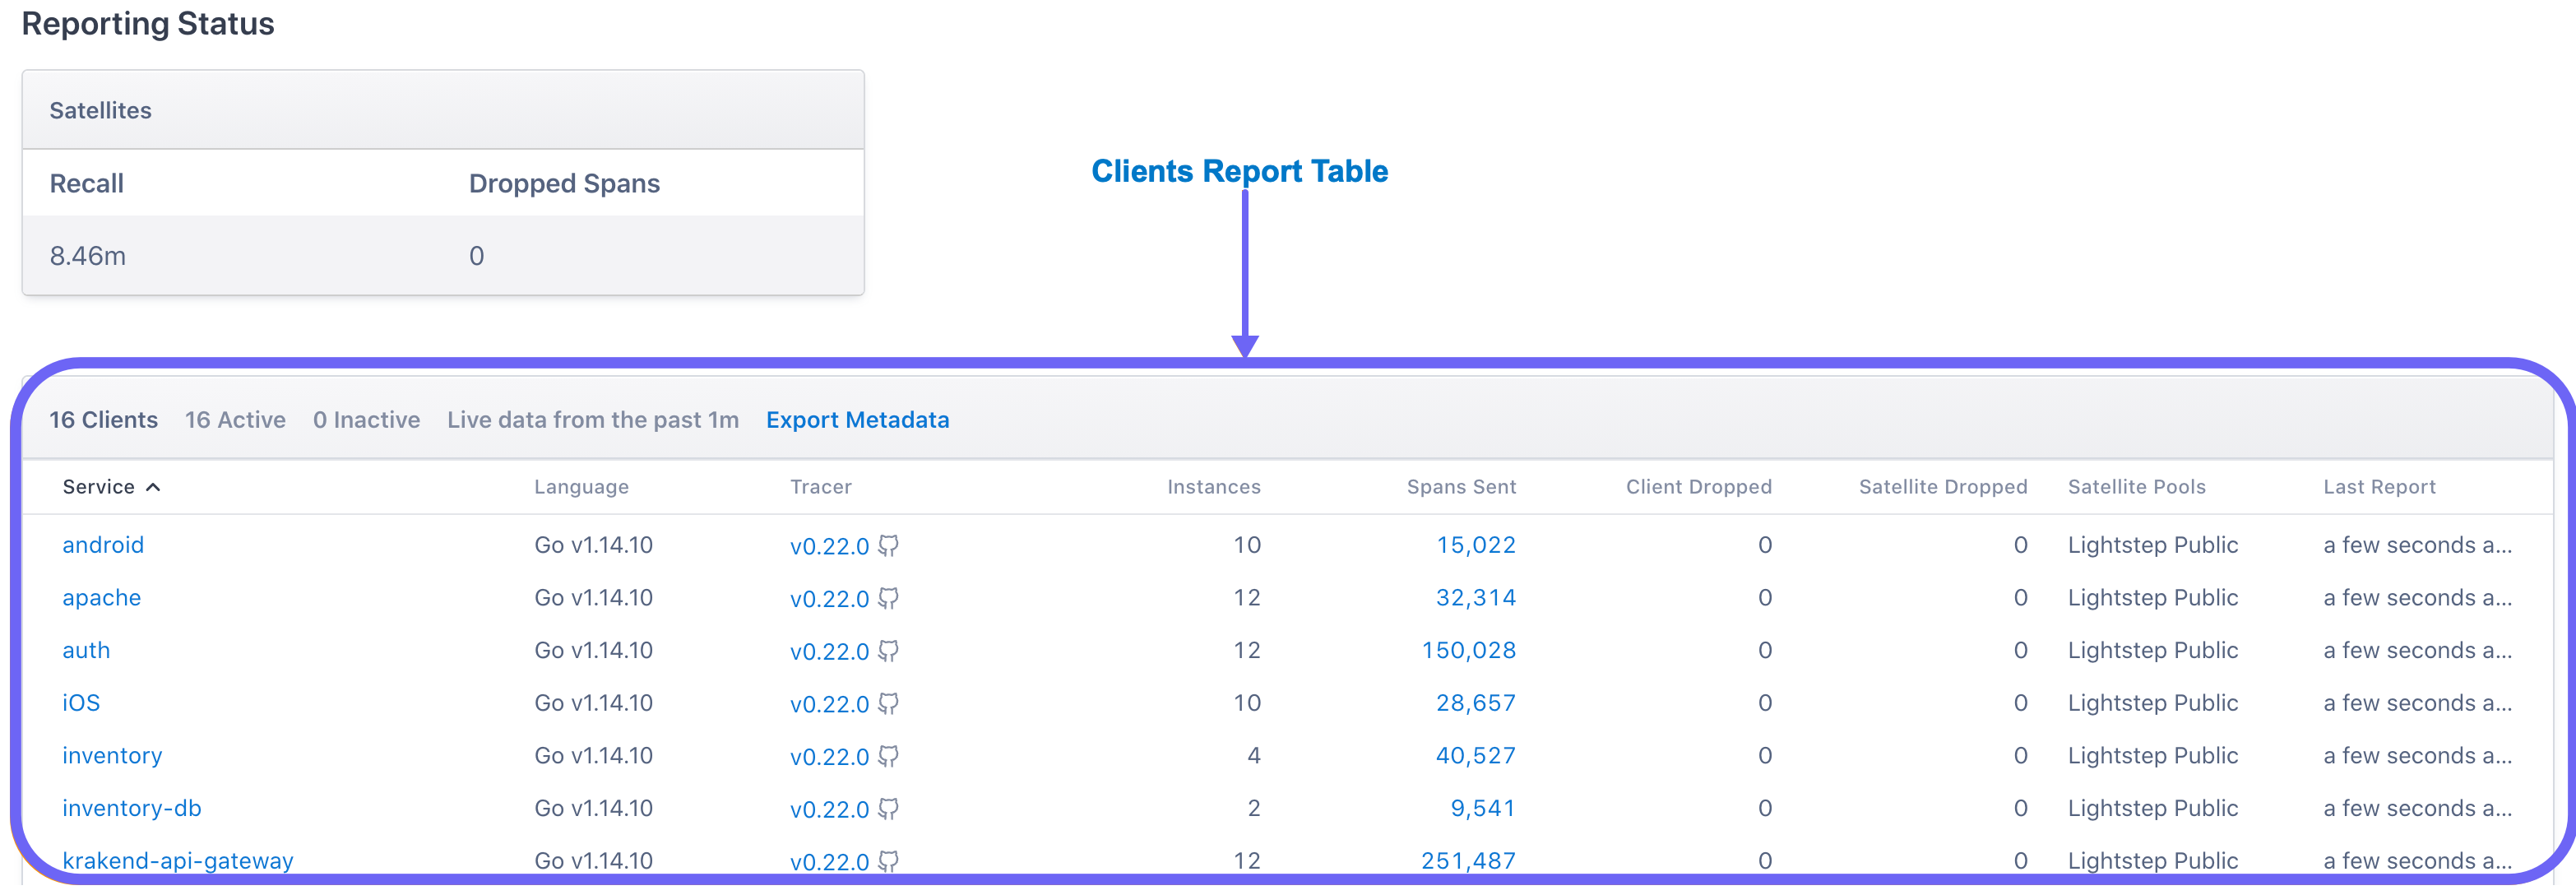
Clients Report table
The Clients Report table shows you how your tracers are performing. The header shows the total number, the number currently active, when the data is from, and a link where you can export the report to a csv file.
- Service: Service name assigned to the tracer specified when initializing the tracer client.
- Language: The language (e.g. Go, Python, Java) of the tracer, including the range of versions being reported.
- Tracer: The version(s) of the tracer being used by these clients. You can click this link to visit the library’s GitHub page.
- Instances: Count of distinct client instances for this service. For large counts (>=100) this is an estimate.
- Spans Sent: The number of spans sent by all tracer clients for this service. This may be smaller than the number reported to these clients, in which case the remainder will be counted as ‘dropped’. You can click this link to visit the Explorer page with a query for that service already executed, allowing you to view the actual traces containing those spans.
- Client Dropped: The number of spans the client dropped before reporting to the Microsatellite. These spans will not be counted in statistics and will not be available for building traces. If this is non-zero, increase the buffer size limit in the client or reduce the operations per second reported to the client tracer.
- Satellite Dropped: The number of spans received and recognized by the Microsatellite, but dropped before they were sent to the Cloud Observability platform. These spans will not contribute to aggregate statistics, and they will not be available for building traces. If this value is non-zero, reduce the volume of operations clients are reporting to Microsatellites or, in the case of on-premise Microsatellite pools, increase the size of the Microsatellite pool. Find detailed load-balancing recommendations here.
- Satellite Pools: The pool the Microsatellite belongs to.
- Last Report: Time since the most recent report received from any client in this component group.

See also
General guidelines for tracing instrumentation
Updated Apr 6, 2021
