
Monitor system performance, get notified when things change, and identify possible causes.
Use Cloud Observability alerts to do the following:
- Create alerts for logs, metrics, or spans.
- Integrate with tools like ServiceNow and PagerDuty to notify people when alerts trigger.
- Use Cloud Observability’s correlation feature to investigate performance changes.
This page describes Cloud Observability alerts at a high level and links to more content to help you get started.
Using Terraform? You can use the Cloud Observability Terraform provider to create and manage your alerts and destinations. You can also use it to export existing alerts into the Terraform format.
Alert example
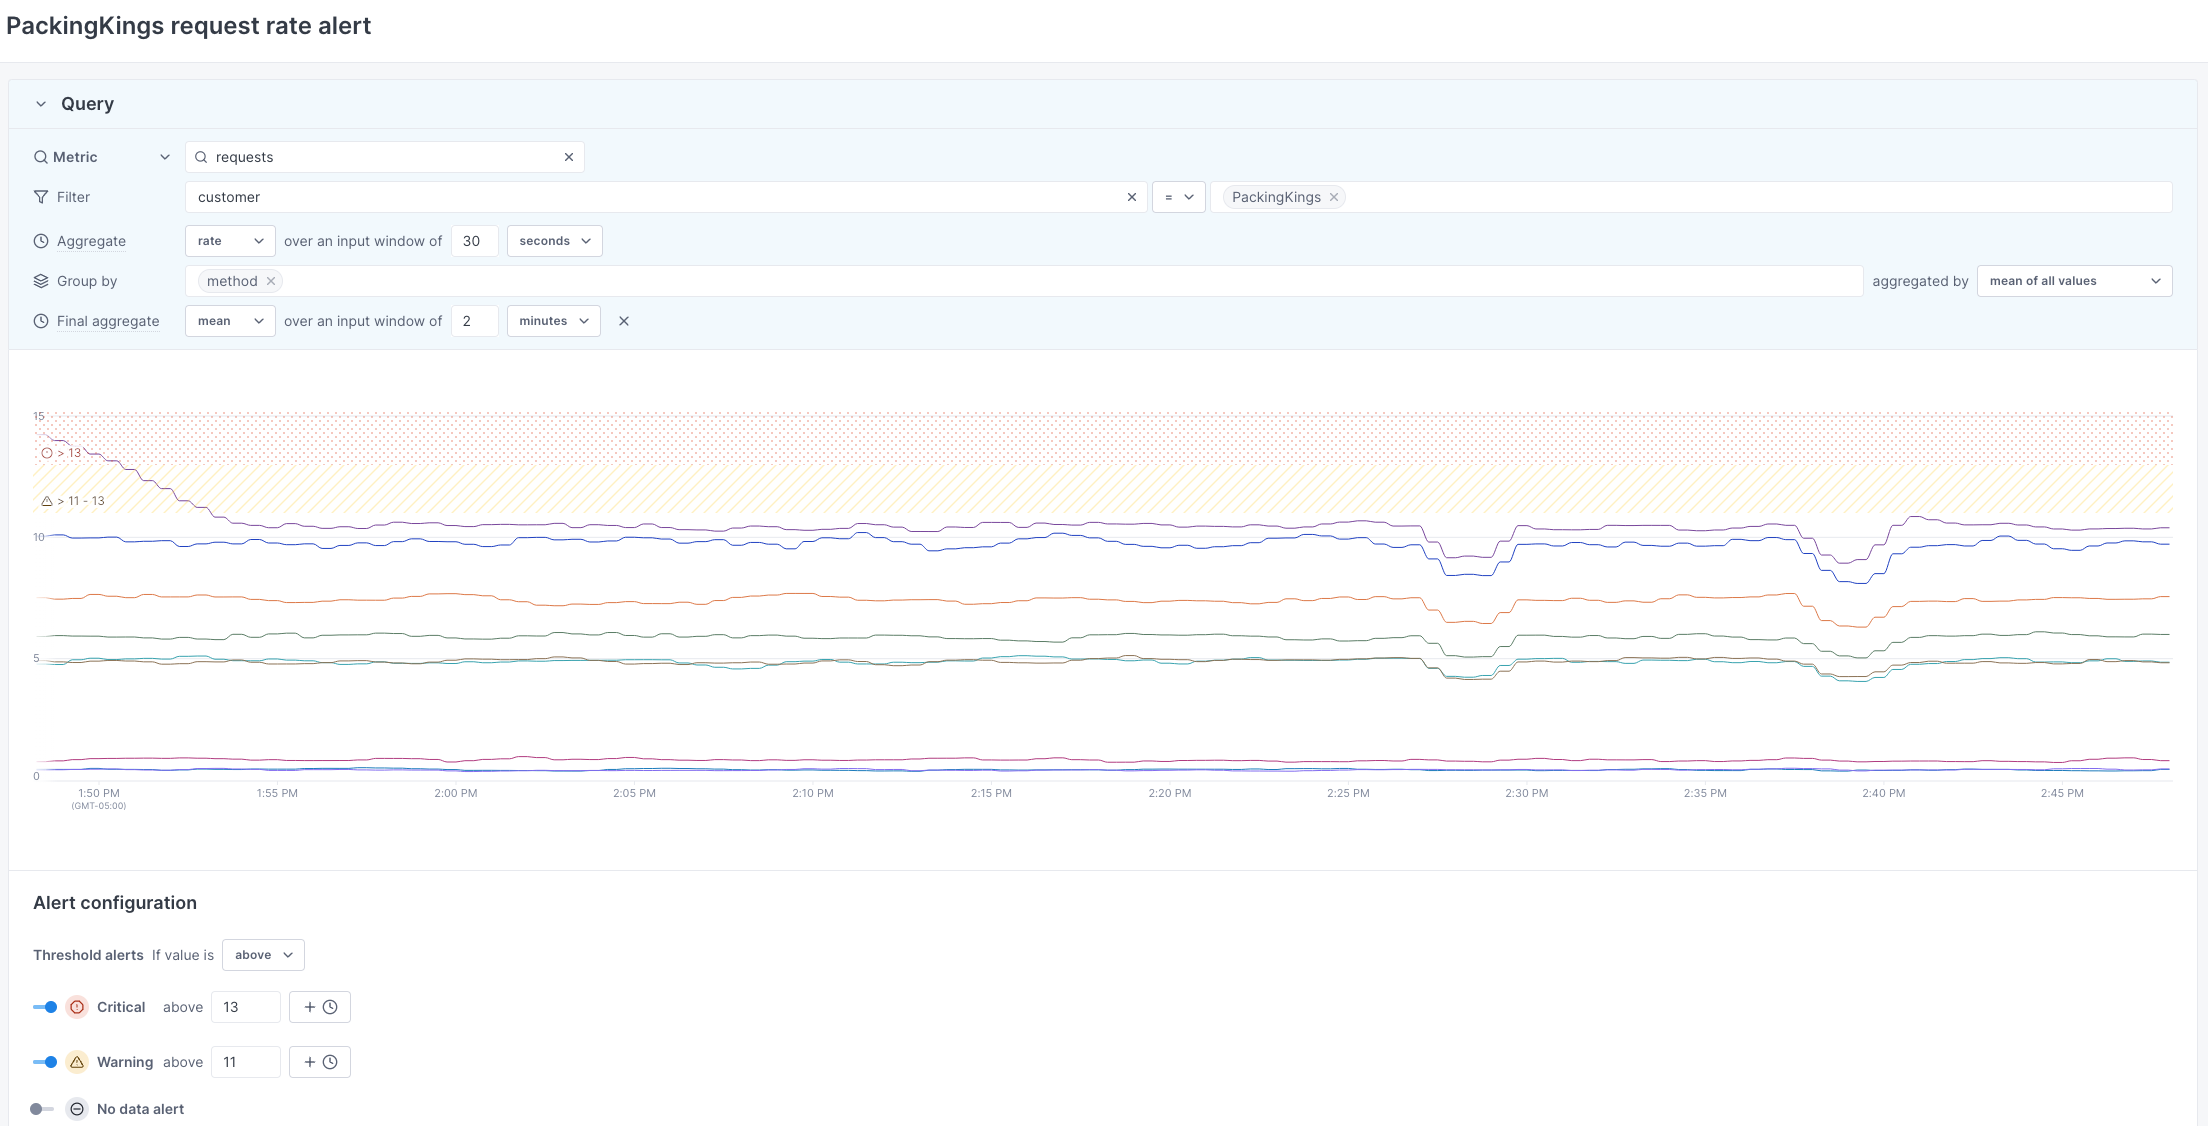
This section describes an alert in practice.
If your customer Packing Kings is onboarding new clients, you may want to create an alert to monitor request rates. The following alert configuration:
- Sends a warning alert if the average request rate goes above 13 requests per second over two minutes.
- Sends a critical alert if the average request rate goes above 15 requests per second over two minutes.
When average request rates cross alert thresholds, Cloud Observability sends a notification to the configured destination. It also sends a notification once the issue is resolved or the metric goes below the threshold.
Customize alerts with alert templates
Cloud Observability offers five alert templates to help you configure and set up alerts:
-
Use Custom to alert on one query or several queries combined with a formula.
This option is the most flexible template. Choose Custom if you’re starting out and exploring alerting options.
Here are some examples of Custom alerts:
- Send alerts if a customer’s average request rate goes above 13 requests per second over 2 minutes.
- Send alerts if disk utilization goes above 75%.
-
Use Change to alert on changes in your data over time.
With this option, you can set alert thresholds comparing current data to data from the last minutes, hours, days, or weeks. Choose this template if you have highly variable data, making it hard to identify fixed thresholds for system health.
Here are some examples of Change alerts:
- Send alerts if API request rates increase more than 5 times (500%) compared to last week.
- Based on previous months of data, send alerts if disk utilization is projected to go above 80% within 30 days.
-
Use Composite to combine several alerts into one alert.
With Composite alerts, you can alert on many conditions and combine log, metric, and trace alerts. Choose this template to define and act on specific system-health indicators.
Here are some examples of Composite alerts:
- Send alerts based on how many customers experience an issue.
- Send alerts when both metric and span data indicate issues.
- Send alerts if short- and long-term rates meet a threshold.
Evaluating Composite alert status
Cloud Observability uses AND (
&&) to evaluate a Composite alert’s status. For example, if one sub alert&&another sub alert areCritical, Cloud Observability sends aCriticalalert notification.The table below outlines how Cloud Observability evaluates
&&for Composite alerts. At a high level, Cloud Observability assigns the least severe status to Composite alerts.Sub alert A status Sub alert B status Composite alert status CriticalCriticalCriticalWarningCriticalWarningWarningWarningWarningNo dataCriticalNo dataNo dataWarningNo dataNo dataNo dataNo dataOKOKOKOKNo dataOKOKWarningOKOKCriticalOKUnknownCriticalUnknownUnknownWarningUnknownUnknownNo dataUnknownUnknownOKUnknownUnknownUnknownUnknownComposite alert notifications
Composite alert notifications differ from Change and Custom alerts. Composite alert notifications:
- Display the Configuration for each sub alert.
- Don’t display Actual Value and Example traces.
-
Use Anomaly to alert when current values deviate from baseline averages using standard deviations. Choose this template to detect when current data behaves differently from past data.
Here are some examples of Anomaly alerts:
- Send alerts if there’s an unusual, large burst of traffic in a short period.
- Send alerts if CPU usage increases significantly compared to last week.
- Send alerts if API requests have unusually high tail latency.
-
Use Outlier to alert when data behaves differently from other data in its group. This template works with metrics only.
Here are some examples of Outlier alerts:
- Send alerts if there’s uneven request load balancing across service instances.
- Send alerts if there’s uneven CPU utilization between machines over the past ten minutes.
Integrate with third-party notification destinations
Notification destinations receive Cloud Observability notifications for triggered alerts. With notification destinations, you can integrate Cloud Observability alerts into your existing setup and let people know when alerts trigger.
Cloud Observability supports the notification destinations listed below. Follow the links to learn how to integrate them with Cloud Observability:
Investigate performance changes
Cloud Observability’s correlation feature helps you investigate performance changes. When alerts trigger, use that feature to view trace data related to your alert and find possible causes.
For more information, visit Investigate deviations.
Learn more
Visit the links below to start working with Cloud Observability alerts.
See also
Manage notification destinations
Updated Nov 27, 2023