The following guidance should only be applied in testing and non-production environments!
Introduction
This document is intended for users of the OpenTelemetry Collector who wish to export OTLP telemetry data to Cloud Observability via an existing web security proxy or appliance.
OpenTelemetry Collector and web proxy deployment guidance
We do not recommend sending production-level telemetry data through a web security appliance or proxy at scale. The volume of data exported by the Collector can exhaust a web proxy’s resources, especially if the proxy is configured to decrypt, scan, and re-encrypt all incoming HTTPS traffic. Any telemetry data exported by the Collector to the Cloud Observability Public Microsatellite pool should have a direct path to https://ingest.lightstep.com.
As such, we recommend that these instructions be applied in testing and non-production environments only.
Configure the otlphttp exporter to use a web security appliance or proxy
In scenarios where exporting telemetry data via a web proxy is necessary, we recommend using the otlphttp exporter, as it supports HTTP/1.1. The otlp/grpc exporter relies on HTTP/2 for transport, and not all web security appliances or proxies are able to support HTTP/2.
-
Ensure that the domains and/or URLs for Cloud Observability public ingest are on your web proxy’s explicit ALLOW list. This should exempt any traffic originating from the Collector and destined to Cloud Observability from any further filtering or inspection. You may need to contact the owner of your organization’s web security appliance to complete this task.
Domain:
ingest.lightstep.comURLs:
https://ingest.lightstep.com/traces/otlp/{version}
https://ingest.lightstep.com/metrics/otlp/{version}Organizations using the EU data center should use
ingest.eu.lightstep.com.Cloud Observability’s supported OTLP/HTTP versioned endpoints are listed here.
-
If your OpenTelemetry Collector deployment requires an explicit proxy configuration, then be sure to set the Collector’s
HTTP_PROXYorHTTPS_PROXYenvironment variables accordingly:If your organization’s web security appliance or proxy is transparent and does not require an explicit configuration, then you can skip to step 3.
An HTTP proxy listening on port 80 or any non-HTTPS ports will likely ignore HTTPS traffic.
Start tabs
Docker Run
1
 -e HTTPS_PROXY=yourorgs.webproxy.com:443
Kubernetes
1
2
3
 env:
   - name: HTTPS_PROXY
     value: 'yourorgs.webproxy.com:443'
Docker Compose
1
2
3
4
 services:
     otelcol:
       environment:
         - HTTPS_PROXY='yourorgs.webproxy.com:443'
End code tabs
-
If any OTLP/HTTP telemetry data originating from the Collector is subject to HTTPS inspection at the proxy, you will need to obtain the proxy’s root certificate from your proxy administrator and ensure it is deployed with the Collector and included in the otlphttp exporter’s configuration. The otlphttp exporter configuration would look like the following:
1
2
3
4
5
6
7
8
9
10
11
 exporters:
   otlphttp:
     traces_endpoint: https://ingest.lightstep.com/traces/otlp/v0.9 #US data center
     #traces_endpoint: https://ingest.eu.lightstep.com/traces/otlp/v0.9 #EU data center
     metrics_endpoint: https://ingest.lightstep.com/metrics/otlp/v0.9 #US data center
     #metrics_endpoint: https://ingest.eu.lightstep.com/metrics/otlp/v0.9 #EU data center
     tls:
       ca_file: /path/to/root/cert.cer
     headers:
       "lightstep-access-token": "<LIGHTSTEP_ACCESS_TOKEN>"
     compression: gzip
-
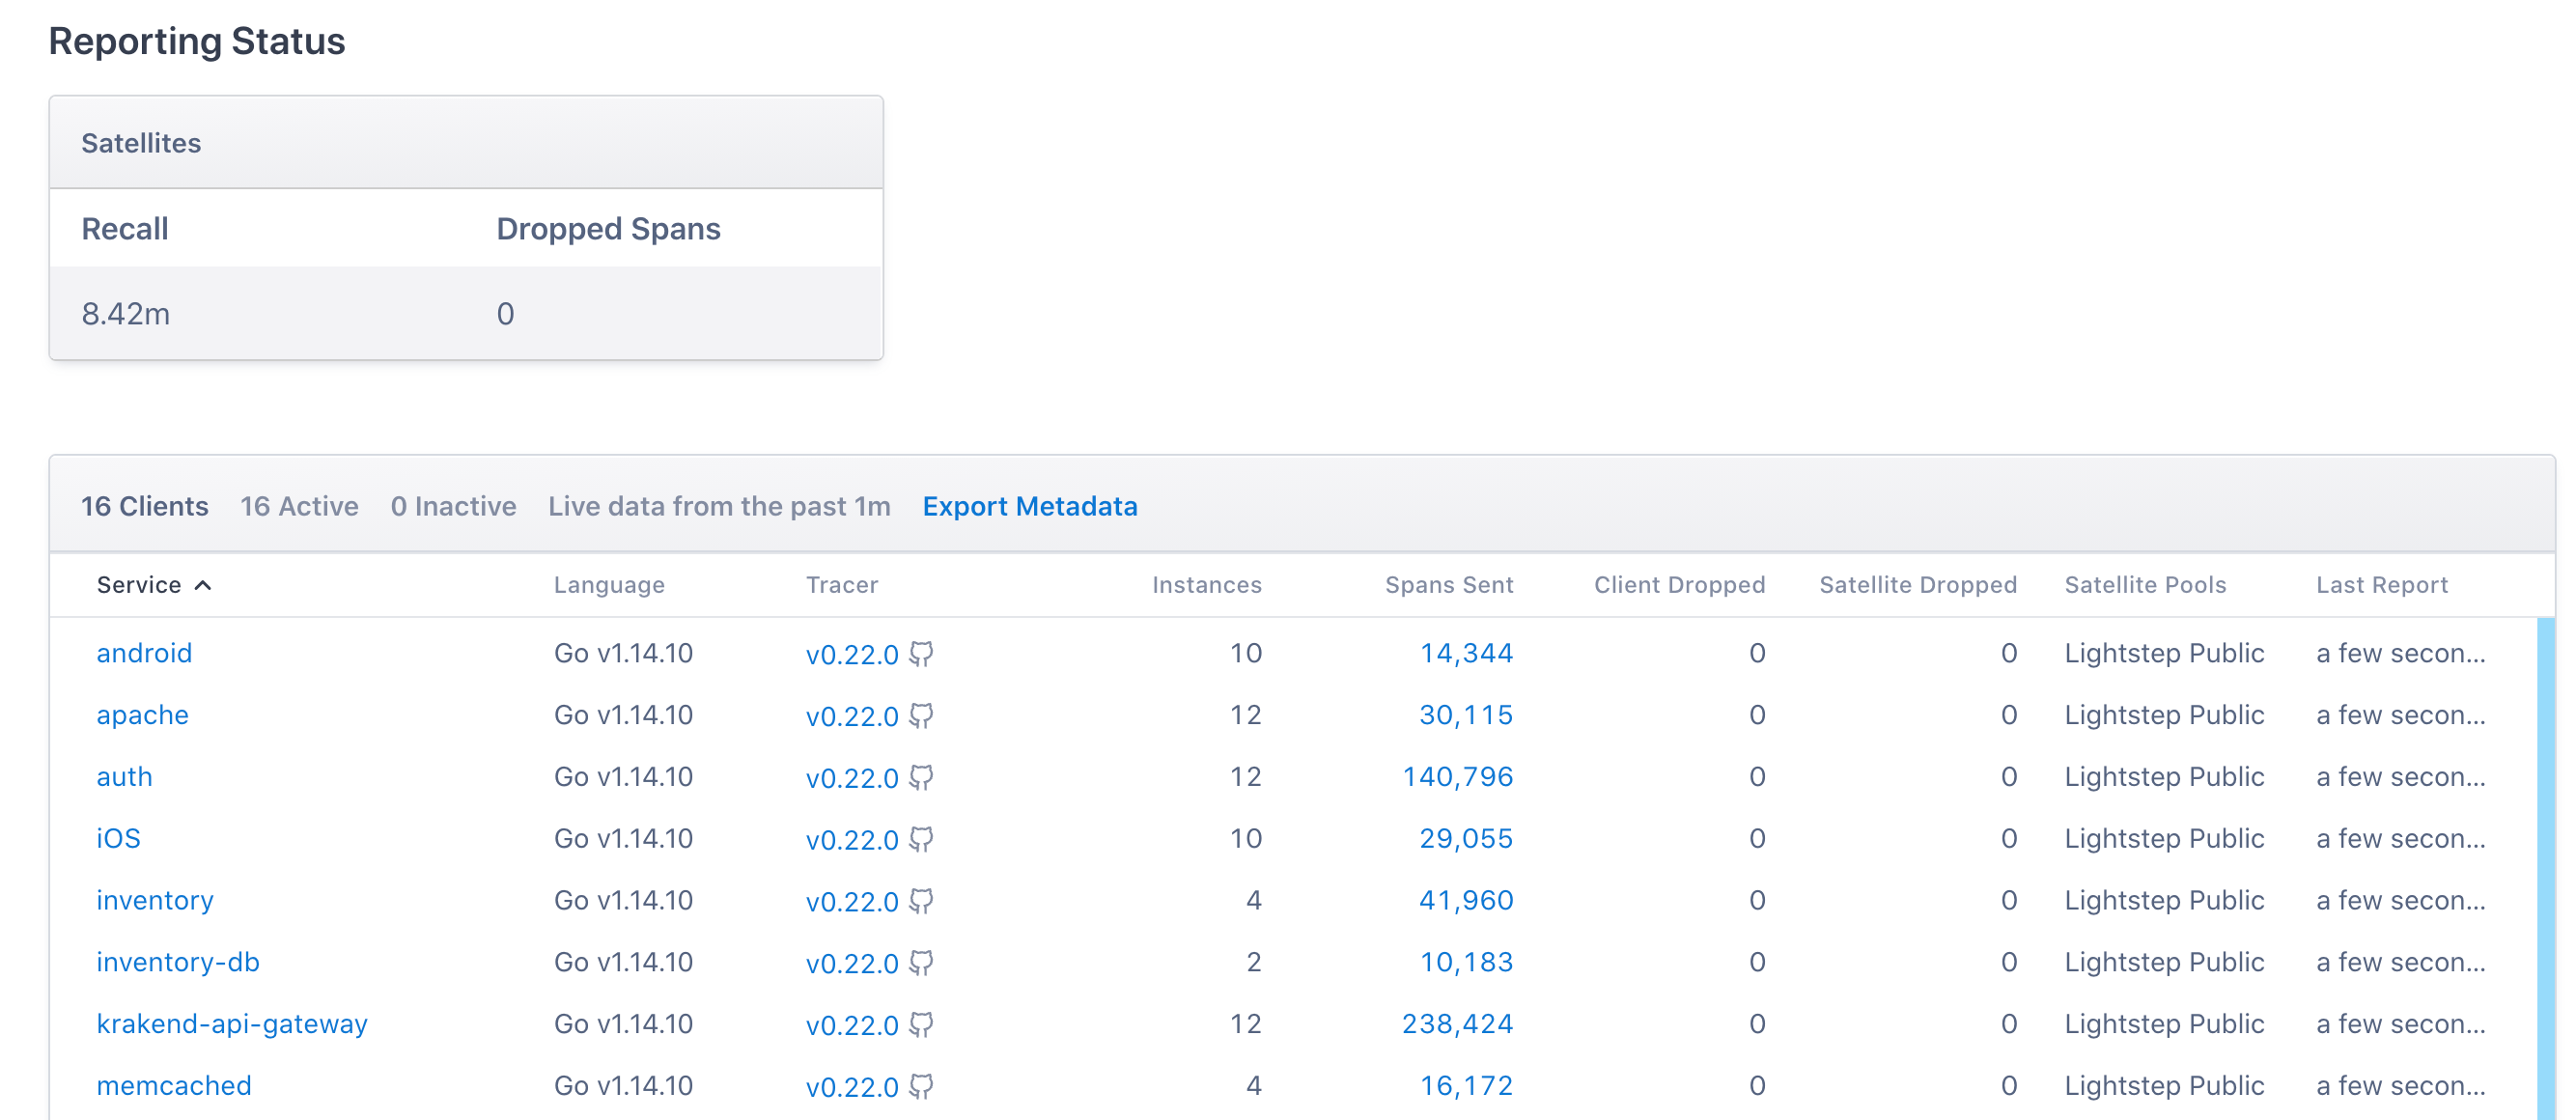
You can verify that trace data is being exported successfully to Cloud Observability by logging into Cloud Observability, navigating to Reporting Status and seeing if spans originating from services configured to use the Collector are showing up on that page:

You can also test your full pipeline by running a curl command against one of your Collector’s receivers, in this case, an OTLP receiver listening on port 4318:
curl -iv -H "Content-Type: application/json" http://{your-collector-ip}:4318/v1/traces -d @small_data.json
where small_data.json contains the following protobuf-encoded JSON payload:
small_data.json
1
2
3
4
5
6
7
8
9
10
11
12
13
14
15
16
17
18
19
20
21
22
23
24
25
26
27
28
29
30
31
32
33
34
35
36
37
{
  "resourceSpans": [
    {
      "resource": {
        "attributes": [
          {
            "key": "service.name",
            "value": {
              "stringValue": "curl-test-otel-pipeline"
            }
          }
        ]
      },
      "scopeSpans": [
        {
          "spans": [
            {
              "traceId": "71699b6fe85982c7c8995ea3d9c95df2",
              "spanId": "3c191d03fa8be065",
              "name": "test-span",
              "kind": 1,
              "droppedAttributesCount": 0,
              "events": [],
              "droppedEventsCount": 0,
              "status": {
                "code": 1
              }
            }
          ],
          "scope": {
            "name": "local-curl-example"
          }
        }
      ]
    }
  ]
 }
If a service with the name curl-test-otel-pipeline shows up in your project’s Reporting Status, then you will know the test span made it into Cloud Observability.
Testing and troubleshooting
In the event you need to troubleshoot the connection that traverses the web proxy and terminates at Cloud Observability’s public ingest at https://ingest.lightstep.com, you can use different curl command examples on a network that sends its HTTPS traffic through your organization’s web proxy, while using the small_data.json file mentioned in the previous section to represent a test span. You will know each test query was successful if you see a service with the name curl-test-otel-pipeline in your project’s Reporting Status.
Test against a transparent web proxy without HTTPS inspection
curl -ivL -H "Cloud Observability-Access-Token: <LIGHTSTEP_ACCESS_TOKEN>" -H "Content-Type: application/json" https://ingest.lightstep.com/traces/otlp/v0.9 -d @small_data.json
Test against a transparent web proxy with HTTPS inspection
curl -ivL -H "Cloud Observability-Access-Token: <LIGHTSTEP_ACCESS_TOKEN>" -H "Content-Type: application/json" https://ingest.lightstep.com/traces/otlp/v0.9 -d @small_data.json --cacert /path/to/root/cert.cer
Test against an explicit web proxy without HTTPS inspection
curl -ivL -H "Cloud Observability-Access-Token: <LIGHTSTEP_ACCESS_TOKEN>" -H "Content-Type: application/json" https://ingest.lightstep.com/traces/otlp/v0.9 -d @small_data.json --proxy yourorgs.webproxy.com:443
Test against an explicit web proxy with HTTPS inspection
curl -ivL -H "Cloud Observability-Access-Token: <LIGHTSTEP_ACCESS_TOKEN>" -H "Content-Type: application/json" https://ingest.lightstep.com/traces/otlp/v0.9 -d @small_data.json --proxy yourorgs.webproxy.com:443 --cacert /path/to/root/cert.cer
Common error messages
Depending on the logging level configured on your Collector, you should be able to see logs pertaining to any configuration issues with the otlphttp exporter.
-
The following log line indicates an issue with certificate configuration:
Apr 07 19:12:35 otel-collector otelcol[477280]: 2022-04-07T19:12:35.417Z info exporterhelper/queued_retry.go:215 Exporting failed. Will retry the request after interval. {"kind": "exporter", "name": "otlphttp", "error": "failed to make an HTTP request: Post \"https://ingest.lightstep.com/traces/otlp/v0.9\": x509: certificate signed by unknown authority", "interval": "44.062336975s"} -
The following log line shows an example of how the Collector responds when
https://ingest.lightstep.comis explicitly blocked on the web proxy’s access policy:Apr 07 20:49:46 otel-collector otelcol[506548]: 2022-04-07T20:49:46.757Z info exporterhelper/queued_retry.go:215 Exporting failed. Will retry the request after interval. {"kind": "exporter", "name": "otlphttp", "error": "failed to make an HTTP request: Post \"https://ingest.lightstep.com/metrics/otlp/v0.9\": read tcp 192.168.95.2:37884->35.222.219.106:443: read: connection reset by peer", "interval": "36.906944319s"}
See also
Quickstart: Collector for application data using Docker
Load balance Cloud Observability
Updated Apr 14, 2022
