
Learn how to write and query logs in Cloud Observability.
This page uses OpenTelemetry (OTel) Collector with Docker to send logs to Cloud Observability. It outlines the basics for setting up, configuring, and querying logs. For more complete setups, visit the quickstart and log integrations.
As of March 12, 2024, all non-logging customers have trial access to Cloud Observability logs. Use trial access to explore logging before committing to a full subscription. To get full access, contact Customer Success.
Before you begin
Make sure to do the following:
- Install Docker.
-
Copy your Cloud Observability access token.
You can create and copy access tokens in Settings > Access tokens.
Step 1: Set up the OTel Collector
Create a configuration file called config.yaml and paste in the content below.
Replace YOUR-ACCESS-TOKEN with your own value.
The configuration uses the filelog receiver, but you can use other OTel Collector receivers to collect logs.
1
2
3
4
5
6
7
8
9
10
11
12
13
14
15
16
17
18
19
20
21
22
23
24
25
26
27
exporters:
  otlp:
    endpoint: "ingest.lightstep.com:443"
    headers:
      "lightstep-access-token": "YOUR-ACCESS-TOKEN"

processors:
  batch:

receivers:
  filelog:
    start_at: beginning
    include:
      - /space.log
    include_file_path: true
    operators:
      - type: regex_parser
        regex: '^(?P<sev>[A-Z]*) (?P<msg>.*)$'
        severity:
          parse_from: attributes.sev

service:
  pipelines:
    logs:
      receivers: [filelog]
      processors: [batch]
      exporters: [otlp]
Step 2: Create sample logs
In the same directory, create a file called space.log and paste in these sample logs:
1
2
3
4
5
6
7
8
DEBUG Initializing sequence: {capacitor: nominal, containment: ok}
INFO Spaceship 'Lightstep' reached orbit around Saturn.
WARN Solar flare activity detected.
ERROR Communication with mission control lost: Signal interference detected.
ERROR Life support failure in sector 2.
INFO Astronaut training completed in sector 4.
ERROR Navigation malfunction: Unable to plot course through asteroid field.
FATAL Reactor core meltdown. Evacuate the ship immediately!
Step 3: Send logs
In the same directory, enter the commands below to start sending logs to Cloud Observability.
The commands pull the Docker image, run the OTel Collector in a container, and mount config.yaml and space.log as volumes.
1
2
$ docker pull otel/opentelemetry-collector-contrib
$ docker run -v "$(pwd)"/config.yaml:/etc/otelcol-contrib/config.yaml -v "$(pwd)"/space.log:/space.log otel/opentelemetry-collector-contrib
The second command returns information similar to this output:
1
2024-XX-XXT14:26:22.518Z	info	fileconsumer/file.go:260	Started watching file	{"kind": "receiver", "name": "filelog", "data_type": "logs", "component": "fileconsumer", "path": "/space.log"}
Step 4: View logs
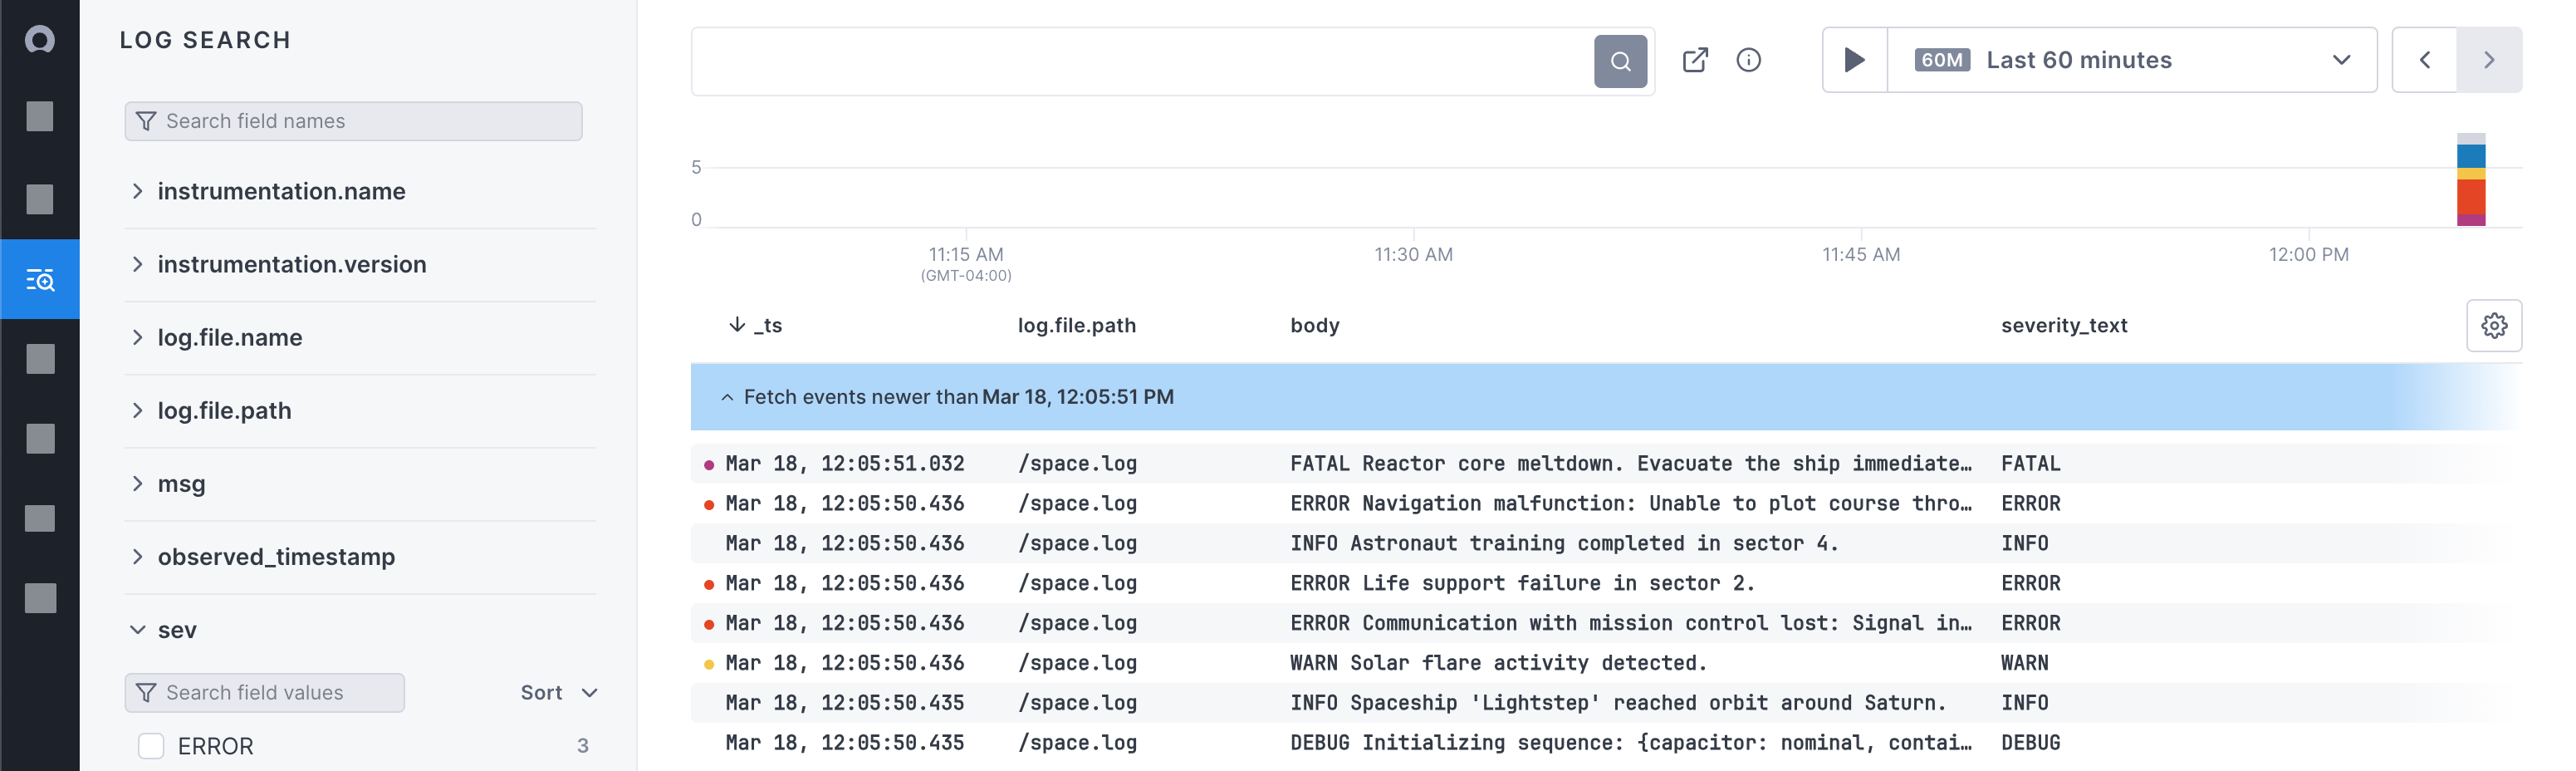
Go to Cloud Observability and click Logs. By default, Cloud Observability shows all logs written in the past hour:
To search the body attribute, click the search box and enter sector. Cloud Observability shows two results.
You can also use the sidebar to filter logs by other attributes. For example, click sev > INFO. Cloud Observability adds && sev==INFO to the search box and returns the one relevant log.
Next steps
You’re all set with logging basics in Cloud Observability. Visit these pages to learn more:
- Log integrations - Configure tools such as Logstash and OpenTelemetry Collector to send logs to Cloud Observability.
- Explore logs - Learn more about searching logs in Cloud Observability’s logs tab.
- Query logs - Learn how to query logs in Cloud Observability’s alerts, dashboards, and notebooks.
Updated Mar 15, 2024