
Cloud Observability collects and analyzes telemetry data across infrastructure, application, runtime, cloud, and other third-party services. By unifying logs, metrics, and traces into one workflow, you can make connections across telemetry types and systems, detect and mitigate changes faster, and gain visibility into distributed systems.
Data sources
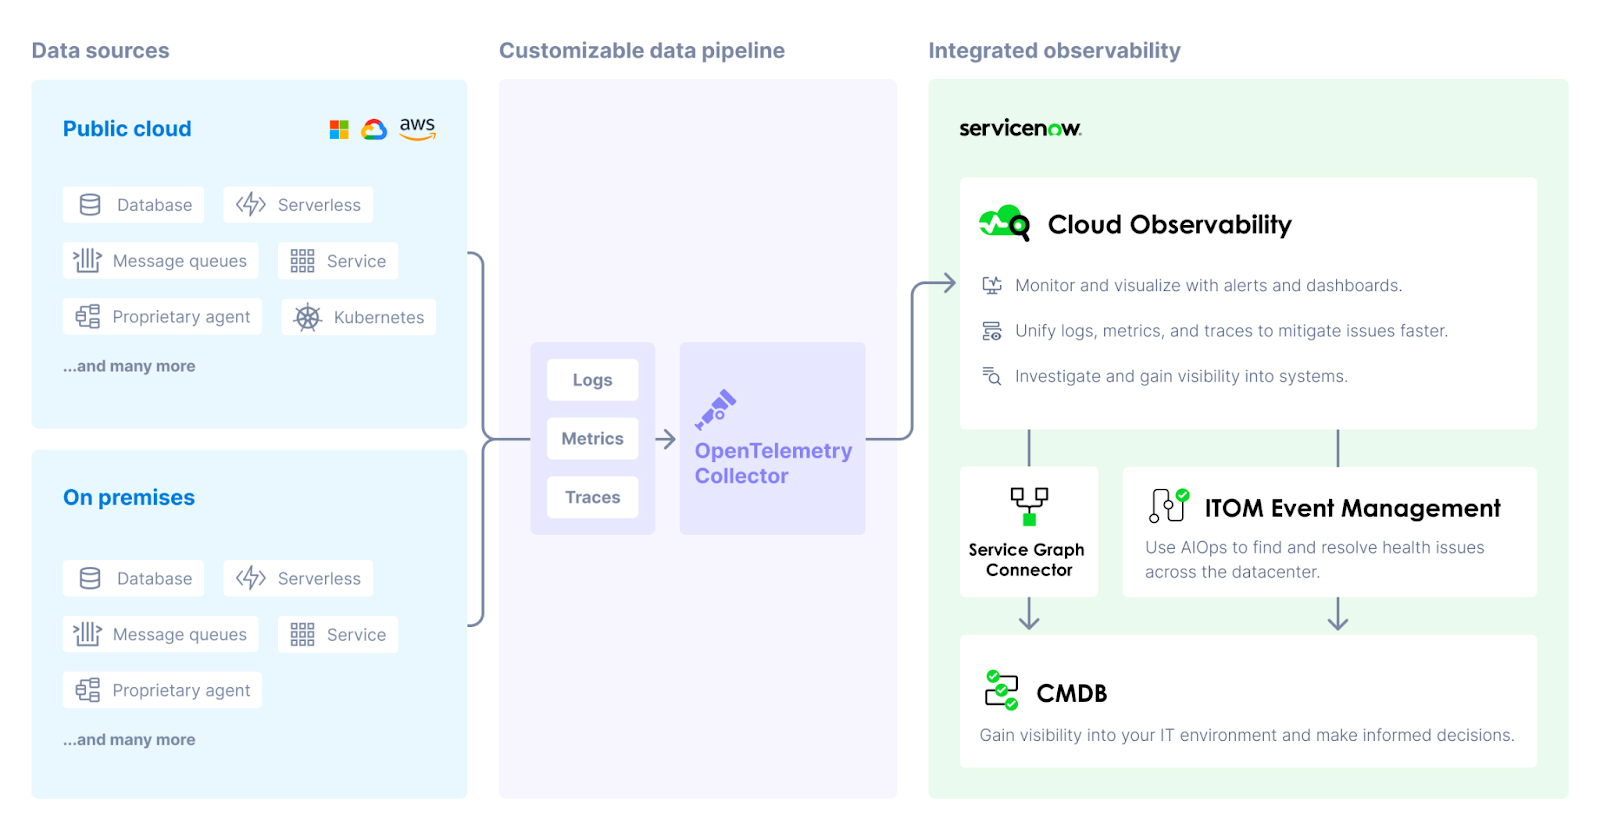
Cloud Observability can ingest telemetry data (logs, metrics, and traces) from most any part of your system (in the cloud or on-premises) that emits data. Data is stored and retained based on your retention policy.
Most ingestion paths use the OpenTelemetry Collector, a vendor-agnostic agent that receives, processes, and exports data to Cloud Observability.
Learn more about data ingestion.
Logs
Send logs to Cloud Observability with tools such as Logstash, the Collector, and Vector. Cloud Observability stores logs by timestamp in a time series database. In Cloud Observability, the logs tab lets you search logs, filter logs, live tail logs, and more. You can also make connections across telemetry types by connecting logs to traces and viewing logs related to your span and metric charts.
Cloud Observability offers log rehydration, a process that can help you lower storage costs and explore older logs by moving them from cold to hot storage.
Metrics
Cloud Observability ingests infrastructure metrics from hundreds of sources. Metrics are stored as time series in our next-gen time series database (TSDB). Our TSDB was designed and built by the same people who created Google’s planet-scale Monarch system and offers high throughput for reliable monitoring. Once your metrics are stored, Cloud Observability’s correlation feature can map that data to your trace data, correlating deviations in metric charts to performance issues from traces throughout your deep system.
Search our integrations to learn how to ingest metrics from the apps in your system.
Instrumentation for traces
You instrument your services to create and collect application-level telemetry data. This instrumentation lives in your microservices, functions, web, mobile clients, anywhere your system accesses functionality.
OpenTelemetry provides APIs, libraries, and instrumentation resources to capture telemetry data from your applications. You can start with auto-instrumentation to collect data from libraries and frameworks used in your system. You can then add more targeted instrumentation in areas of your system where additional data would prove helpful.
Learn more about instrumentation.
Data pipeline
The Collector runs in your system and ingests data, optionally processes it (sampling, data transformation), and then exports it to the Cloud Observability platform. When you use our Helm charts to install the Collector, it’s automatically configured to provide the best out-of-the-box experience in Cloud Observability.
The configurable pipeline in the Collector controls the data sent to Cloud Observability. You can send logs, metrics, or traces, or any combination of the three. You can also enable extensions that provide functionality other than the processing of data, like health monitoring, service discovery, or data forwarding.
Integrated observability
Cloud Observability ingests the data from the Collector and analyses it to find examples of application errors, high latency, or other interesting events. It builds complete traces and dynamic service diagrams, deduces correlations among the data, and monitors for changes in performance that trigger configured alerts.
Cloud Observability’s alerts and dashboards help you monitor and visualize logs, metrics, and traces in one place. Alerts and dashboards rely on the same Unified Query Builder and Unified Query Language, so you don’t have to learn new workflows or query languages for different features and telemetry types.
When you detect changes, Cloud Observability offers several ways to help you investigate and mitigate issues faster. Explore specific telemetry in Cloud Observability’s Trace View and logs tab. You can also make connections across logs, metrics, and traces by:
- Connecting logs to traces.
- Correlating metrics and spans from chart deviations.
- Creating notebooks to centralize investigations and save data for post-mortems.
- Viewing logs related to metric and span charts.
The ServiceNow Service Graph Connector for OpenTelemetry allows you to map data sources currently reporting to Cloud Observability as configuration items (CIs) in the ServiceNow CMDB. Visibility into these sources in the CMDB allows you to monitor your cloud-based infrastructure in the same way as your on-premise systems.
See also
About sending data to Cloud Observability
Send data to the ServiceNow CMDB
Updated Sep 26, 2023