
The ServiceNow Service Graph Connector for OpenTelemetry allows you to map data sources currently reporting to Cloud Observability as configuration items (CIs) in the ServiceNow CMDB. Visibility to these sources in the CMDB allows you to monitor your cloud-based infrastructure in the same way as your on-premise systems.
This topic provides the pre-installation planning you need to do before installing the Connector to ensure your data is correct. For detailed instructions on installing and configuring the Connector, see Service Graph Connector for OpenTelemetry on the ServiceNow documentation site.
Send telemetry data to Cloud Observability
Cloud Observability can ingest telemetry data sent from your system using OpenTelemetry. Most ingestion paths use the OpenTelemetry Collector, a vendor-agnostic agent for receiving, processing, and exporting telemetry data. Systems running in a Kubernetes environment also use the OpenTelemetry Operator. For viewing trace data from cloud-based services, you instrument your service with OpenTelemetry and then use the Collector to retrieve, process, and export that data.
We strongly recommend all cloud customers follow the Kubernetes Quickstart to deploy the Collector, which automatically configures Kubernetes clusters and workloads to send telemetry in the right format for the SGC.
Use the following table to determine how best to get your telemetry data into Cloud Observability.
| Send data from: | What you’ll use: | What you’ll see: | Docs: |
|---|---|---|---|
| Cloud infrastructure | Cloud Observability + info from your provider | Metrics | Ingest metrics from Amazon Ingest metrics from GCM Ingest metrics from Azure AKS Secondary: Integrations |
| Kubernetes infrastructure | Collector + Operator | Metrics (including Prometheus) Logs |
Quick Start Secondary: Use the OpenTelemetry Collector Integrations |
| Other infrastructure (databases/mainframes/log collectors /network proprietary agents, etc.) |
Collector | Metrics Logs |
Quickstart: Collector for infrastructure metrics Integrations Send logs to Cloud Observability Already using the collector? Secondary: Use the OpenTelemetry Collector |
| Application services | OpenTelemetry instrumentation Collector Operator (if on Kubernetes) |
Metrics Logs Traces |
Quickstart: Tracing instrumentation Quickstart: Collector for application data Secondary: Use the OpenTelemetry Collector |
| Already using the Collector | Configure the Collector | Already using the collector? |
Verify data is present and accurate
Once you have data coming into Cloud Observability, you should verify that it’s correct and complete in Cloud Observability before you send it to the Service Graph Connector. How you do that depends on the type of telemetry you’re verifying.
Infrastructure and application metrics
- Use our pre-built dashboards for AWS and OpenTelemetry to see that metric data is correct.
- Cloud Observability provides a metric details section where you can view all reporting metrics and their metadata.
Service topology
In a dashboard or notebook, create a dependency map. The service diagram shows all reporting services and their dependencies.
Logs
Visit the logs tab to view and search incoming logs.
Gather identifiers needed during installation
You’ll need the following values to install the Service Graph Connector:
-
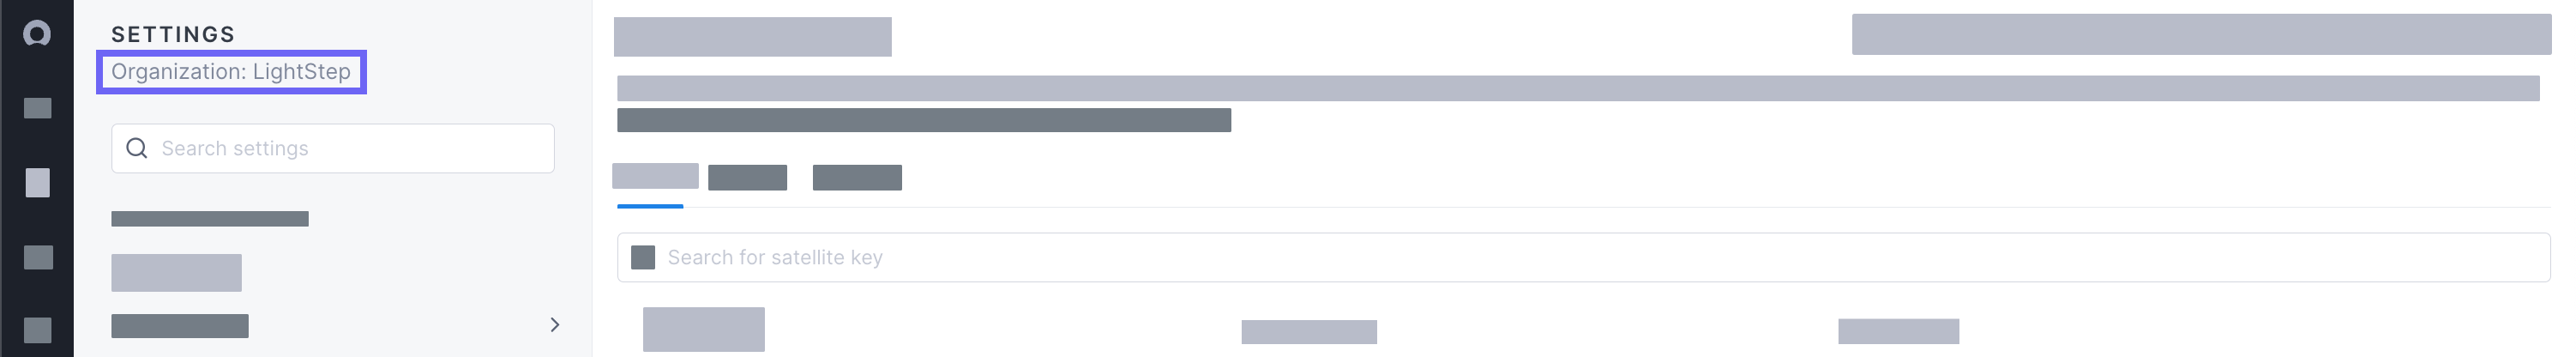
Organization name: Find your organization in Settings.
-
Cloud Observability API key: Create a new API key for the Connector. Note that the key expires after one year.
You can now continue on to the installation of the Service Graph Connector.
Send alert notifications
Send notifications for Cloud Observability alerts directly to ServiceNow Event Management by connecting alerts to a notification destination. Notification destinations can be automatically created in the Guided Setup of the Service Graph Connector for OpenTelemetry.
To resolve issues faster, learn how to add CIs to alerts, further integrating Cloud Observability alerts and ServiceNow Event Management.
To further refine alert management and issue resolution, you can utilize labels to tag alerts with specific identifiers, such as service IDs or machine IDs. This practice allows for enriched event data within the ServiceNow CMDB, making it easier to correlate alerts with specific CIs. For guidance on adding and managing labels for alerts, visit Use Labels to Tag Dashboards and Alerts.
See also
Use the OpenTelemetry Collector
Quickstart Kubernetes: Collector and Operator
Updated Jul 7, 2023