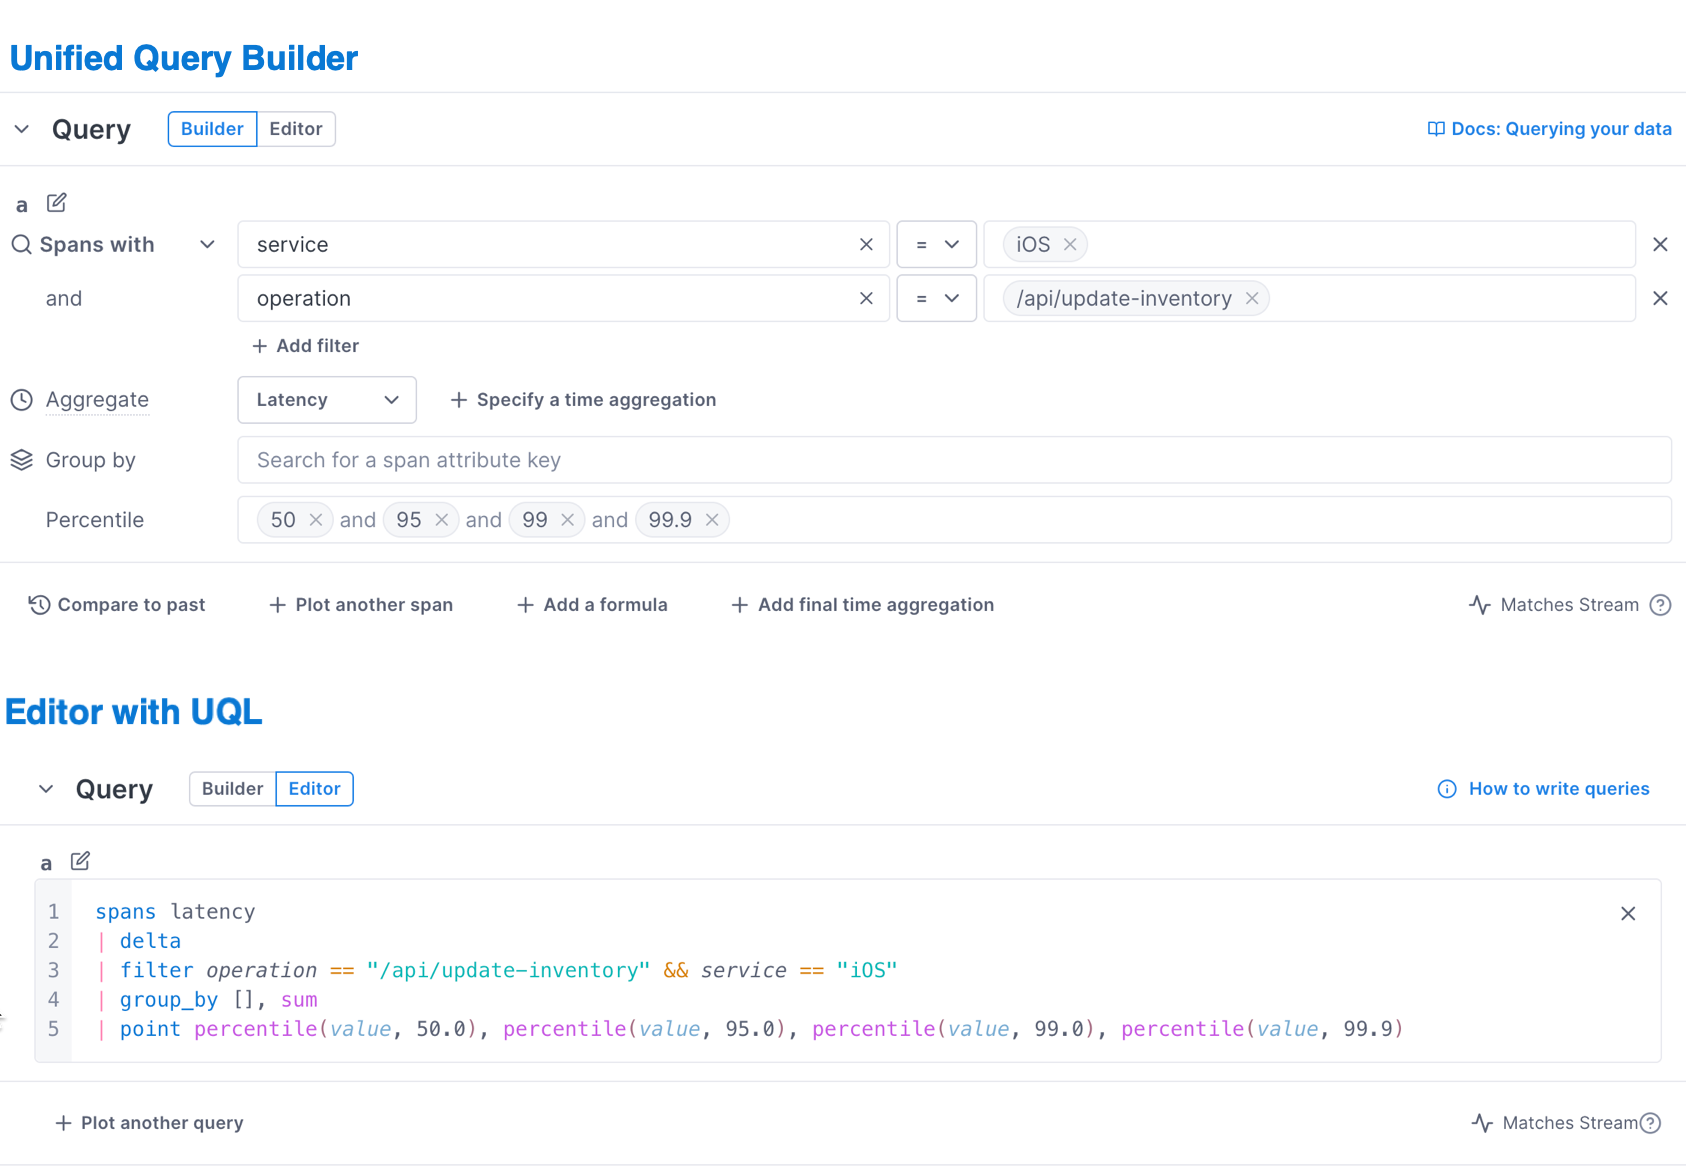
Query logs, metrics, and spans with Cloud Observability’s Unified Query Builder (UQB) or Unified Query Language (UQL).
Overview
Query logs, metrics, and spans to create panels in alerts, dashboards, and notebooks. Cloud Observability offers two ways to query data:
The UQB is the fastest way to start. The UQB lets you click to build queries and offers the functionality needed for most queries. Use the UQB when starting a panel or investigation to learn about your data and Cloud Observability’s query language.
Cloud Observability’s UQL lets you create more fine-grained queries. You can use UQL in the editor, with our APIs, or with integrations such as Terraform. Use UQL when refining queries and optimizing panels in alerts, dashboards, and notebooks.

Switch between UQB and UQL
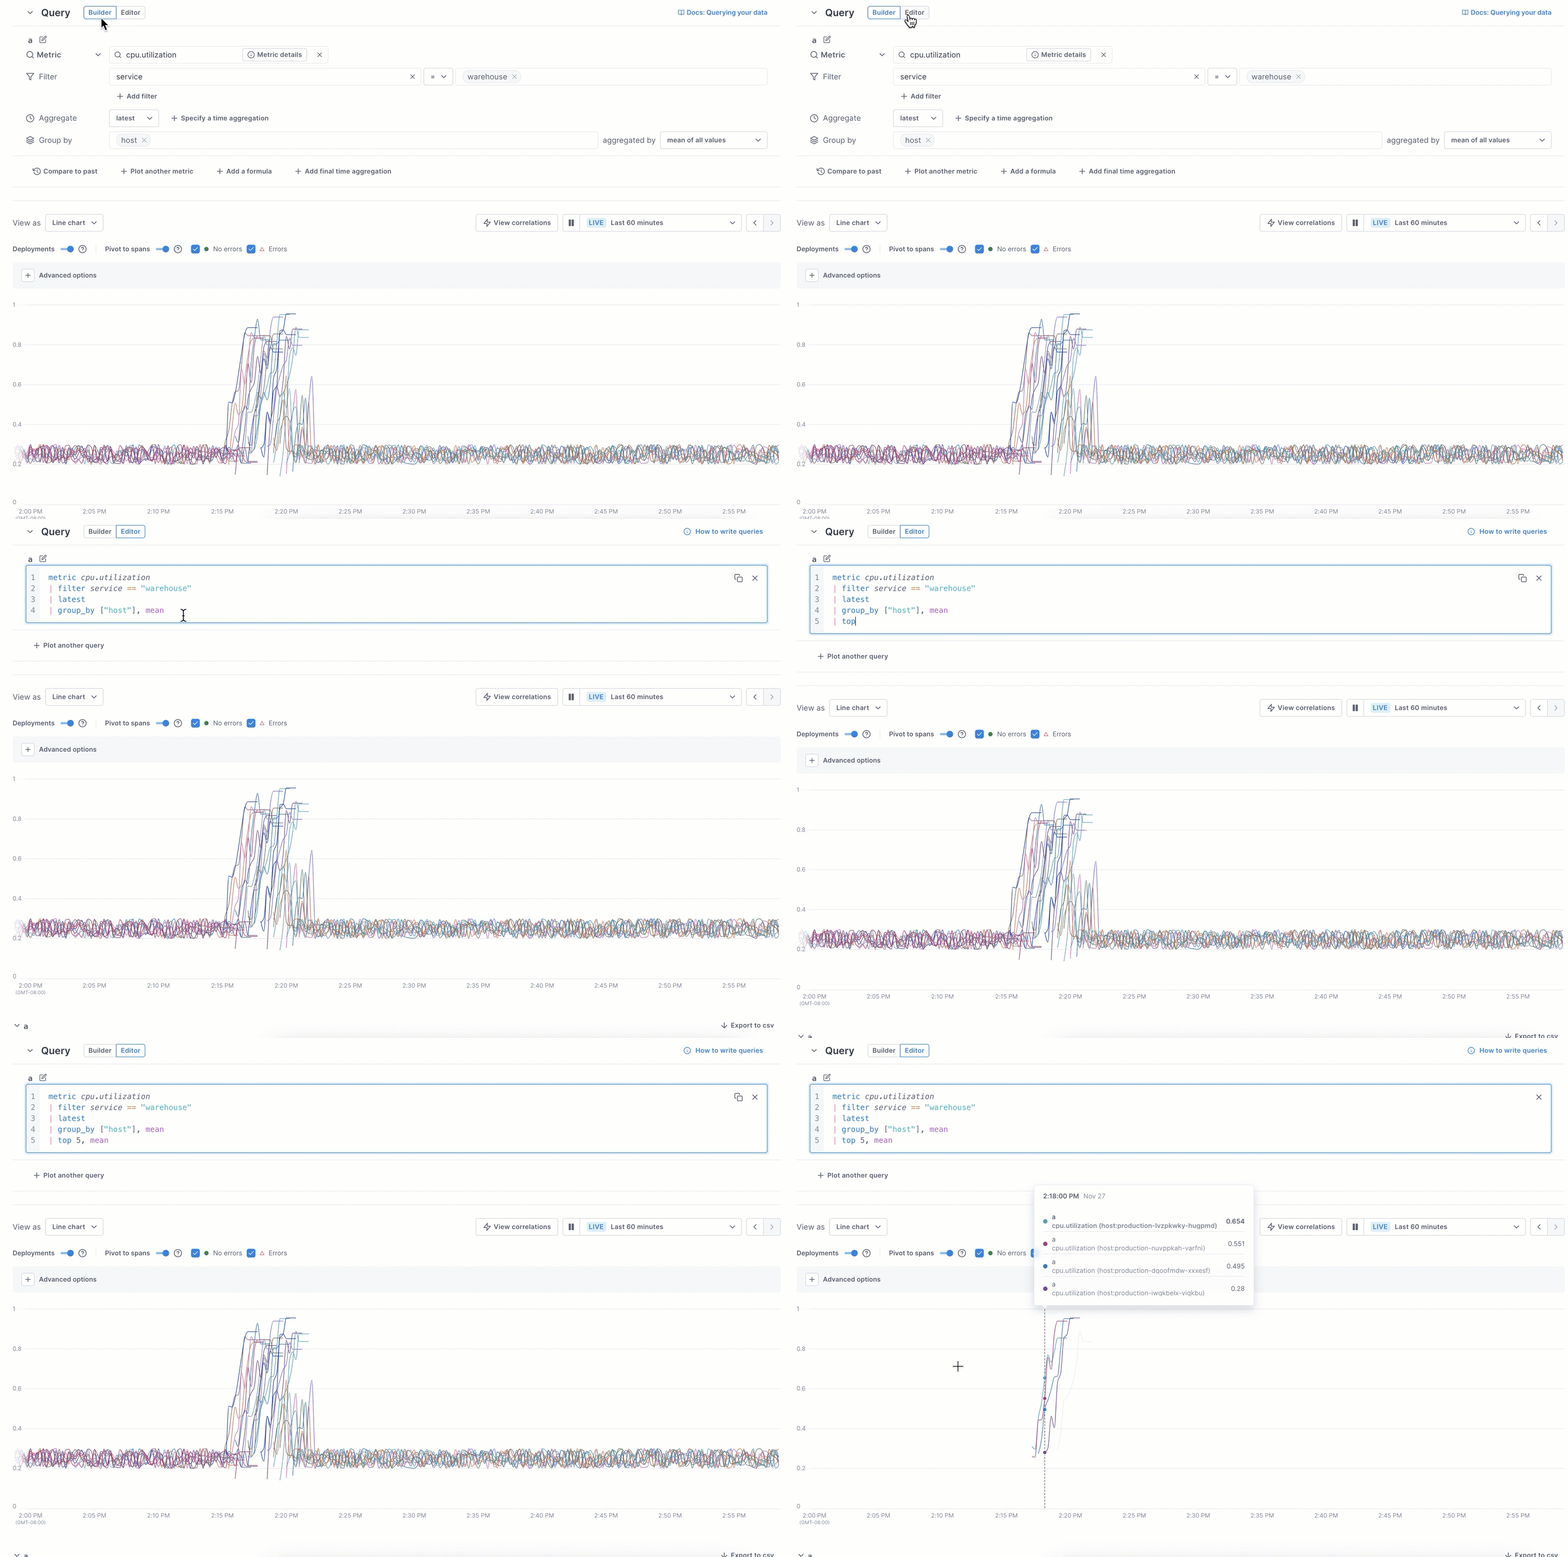
You may want to start creating queries in the UQB and refine queries using UQL. Cloud Observability lets you switch between the two query methods to get more insights.
In the example below, the UQB query shows too many lines to focus on the highest CPU-utilization spikes. Switching to the editor and using UQL lets you view just the top five.

Learn more
To get started with the UQB, visit Use the Unified Query Builder. For more about UQL in the editor, visit these links:
Once you query your data, check out Cloud Observability’s different visualization types.
See also
Understand data retention in Cloud Observability
Updated Dec 6, 2023
