
Cloud Observability has a number of tools that help you in all your observability flows, whether it’s continual monitoring, triaging an incident, root cause analysis, viewing overall service health, or managing your team’s observability practices.
Monitoring
Monitoring your resources and transactions is a key part of observability. At a glance, you need to know if your transactions through your system are performant and that your resources (services, virtual memory) that those transactions consume are healthy. Unified dashboards let you view logs, metrics, and traces in one place. And after a deployment (even a partial deploy), you can use Cloud Observability to ensure things are staying on track.
Unified dashboards
Using the unified dashboard experience, you can monitor log, metric, and span charts in one place. 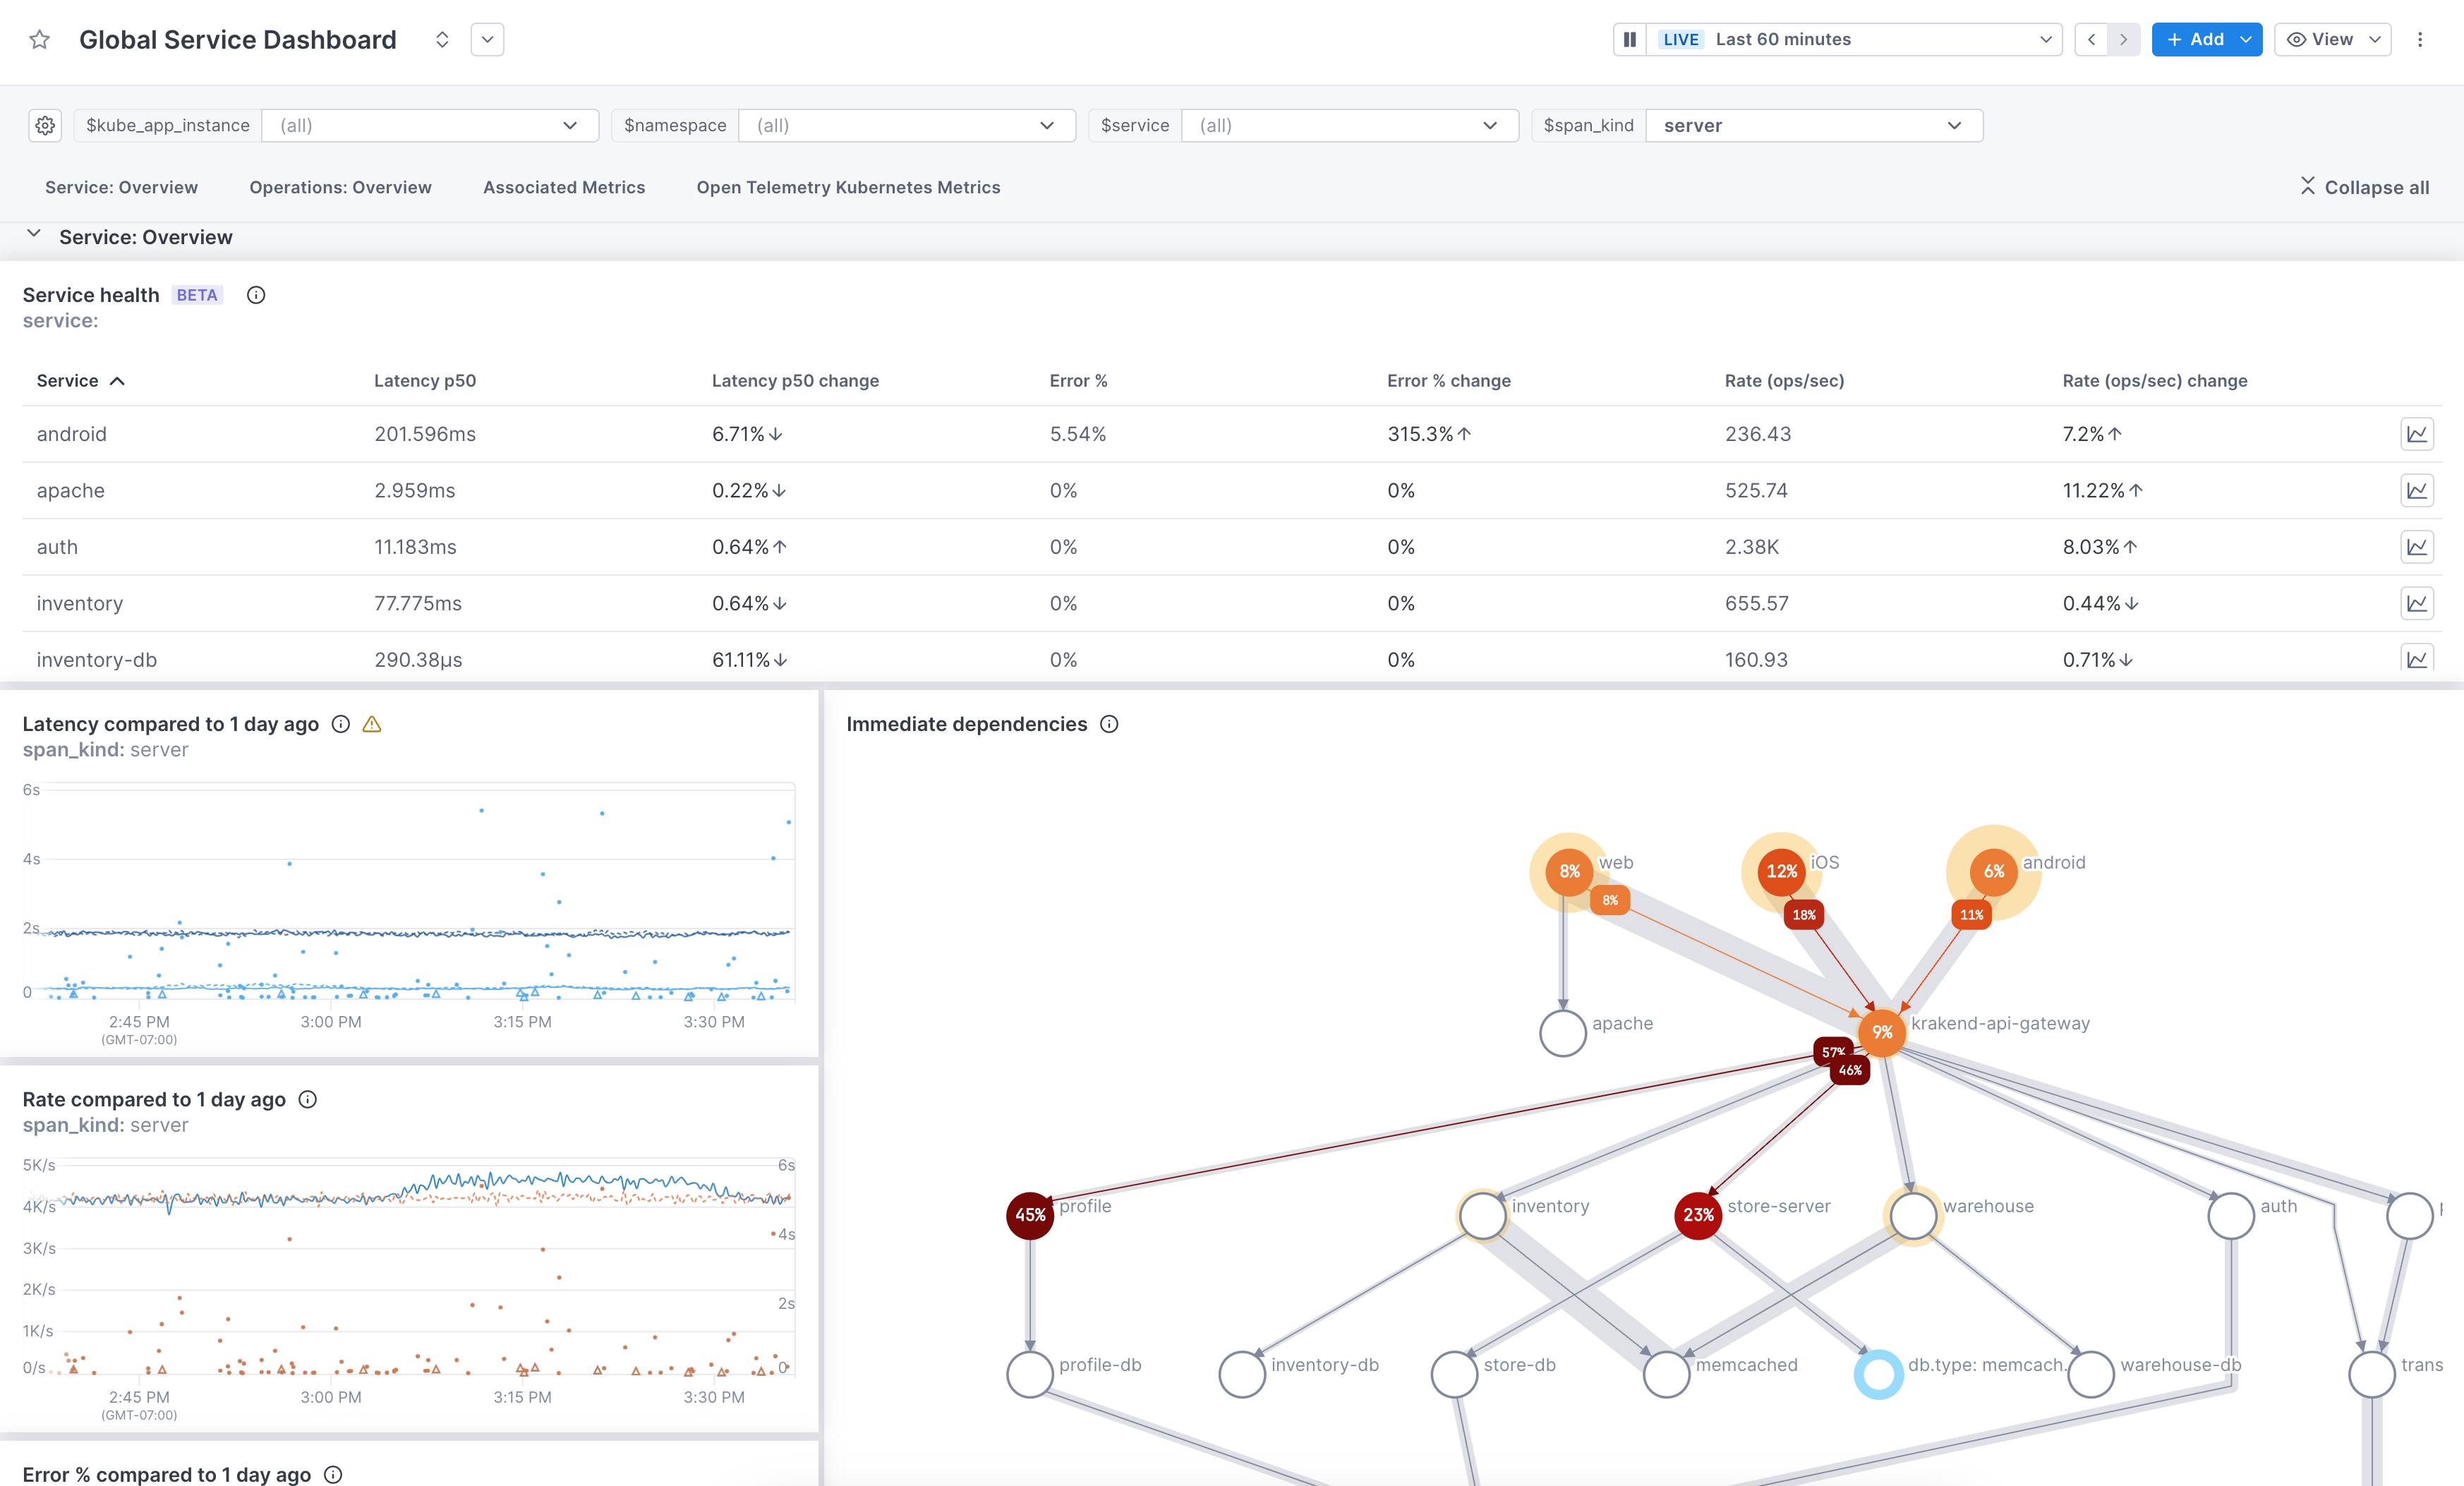
As a starting point, you can use our pre-built dashboards without having to query your data. Start with one of these then customize it to fit your needs. You can edit the description, labels, and sections, add/delete visualizations, and change chart queries. Pre-built dashboards are available for every service reporting to Cloud Observability. Use the Global Service dashboard to view all your services from one dashboard. Change the service variable value to view a specific service. Or you can use the individual service dashboards to view a single service.
Pre-built dashboards are also available for AWS CloudWatch Metric Streams metrics and for a metric integration that uses the OTel Collector.
You can manually create charts for a dashboard using a query builder that works for logs, metrics, and spans. Use filters and groupings to see just the data you want. 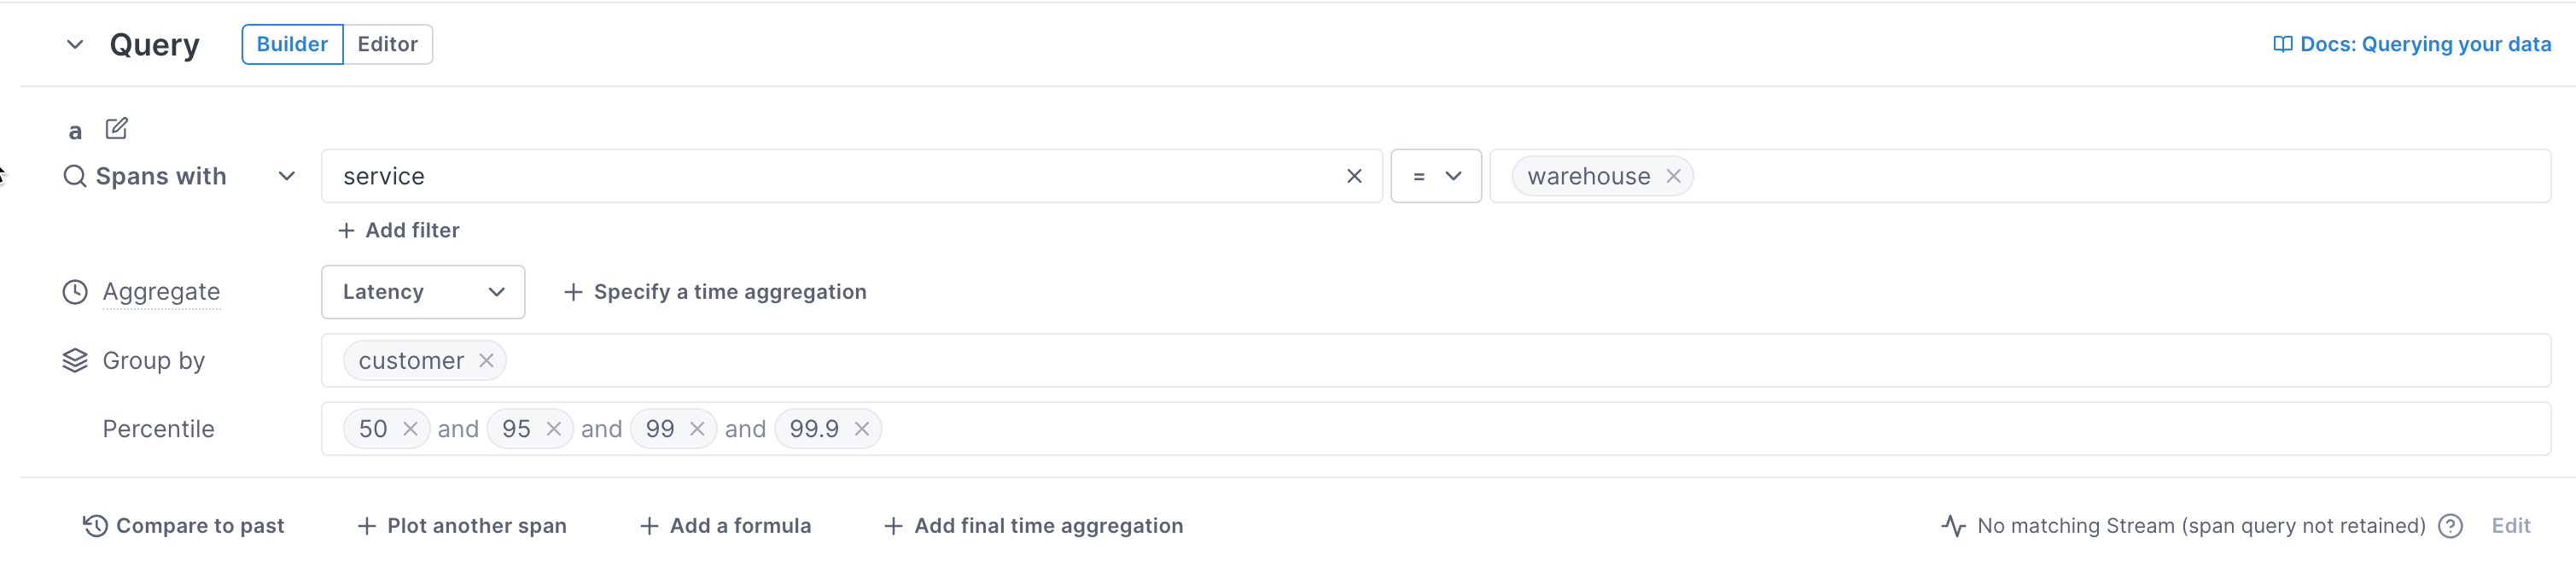
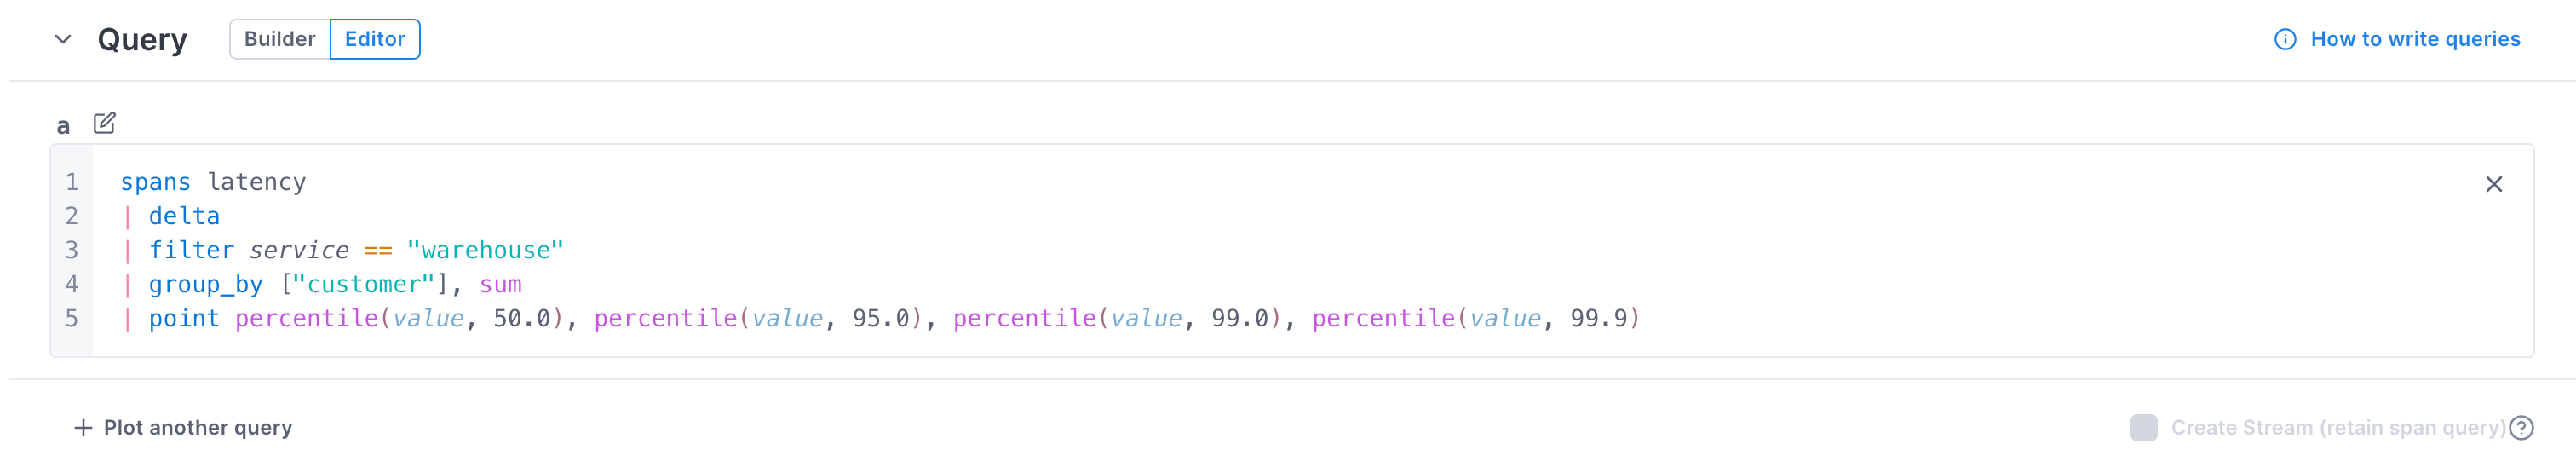
Instead of the builder, you can use the Unified Query Language (UQL) in the editor to build more fine-grained queries on logs, metrics, and spans.
For span data, exemplars are mapped in the chart, providing direct access to traces. A table below the chart provides a quick view into the data.
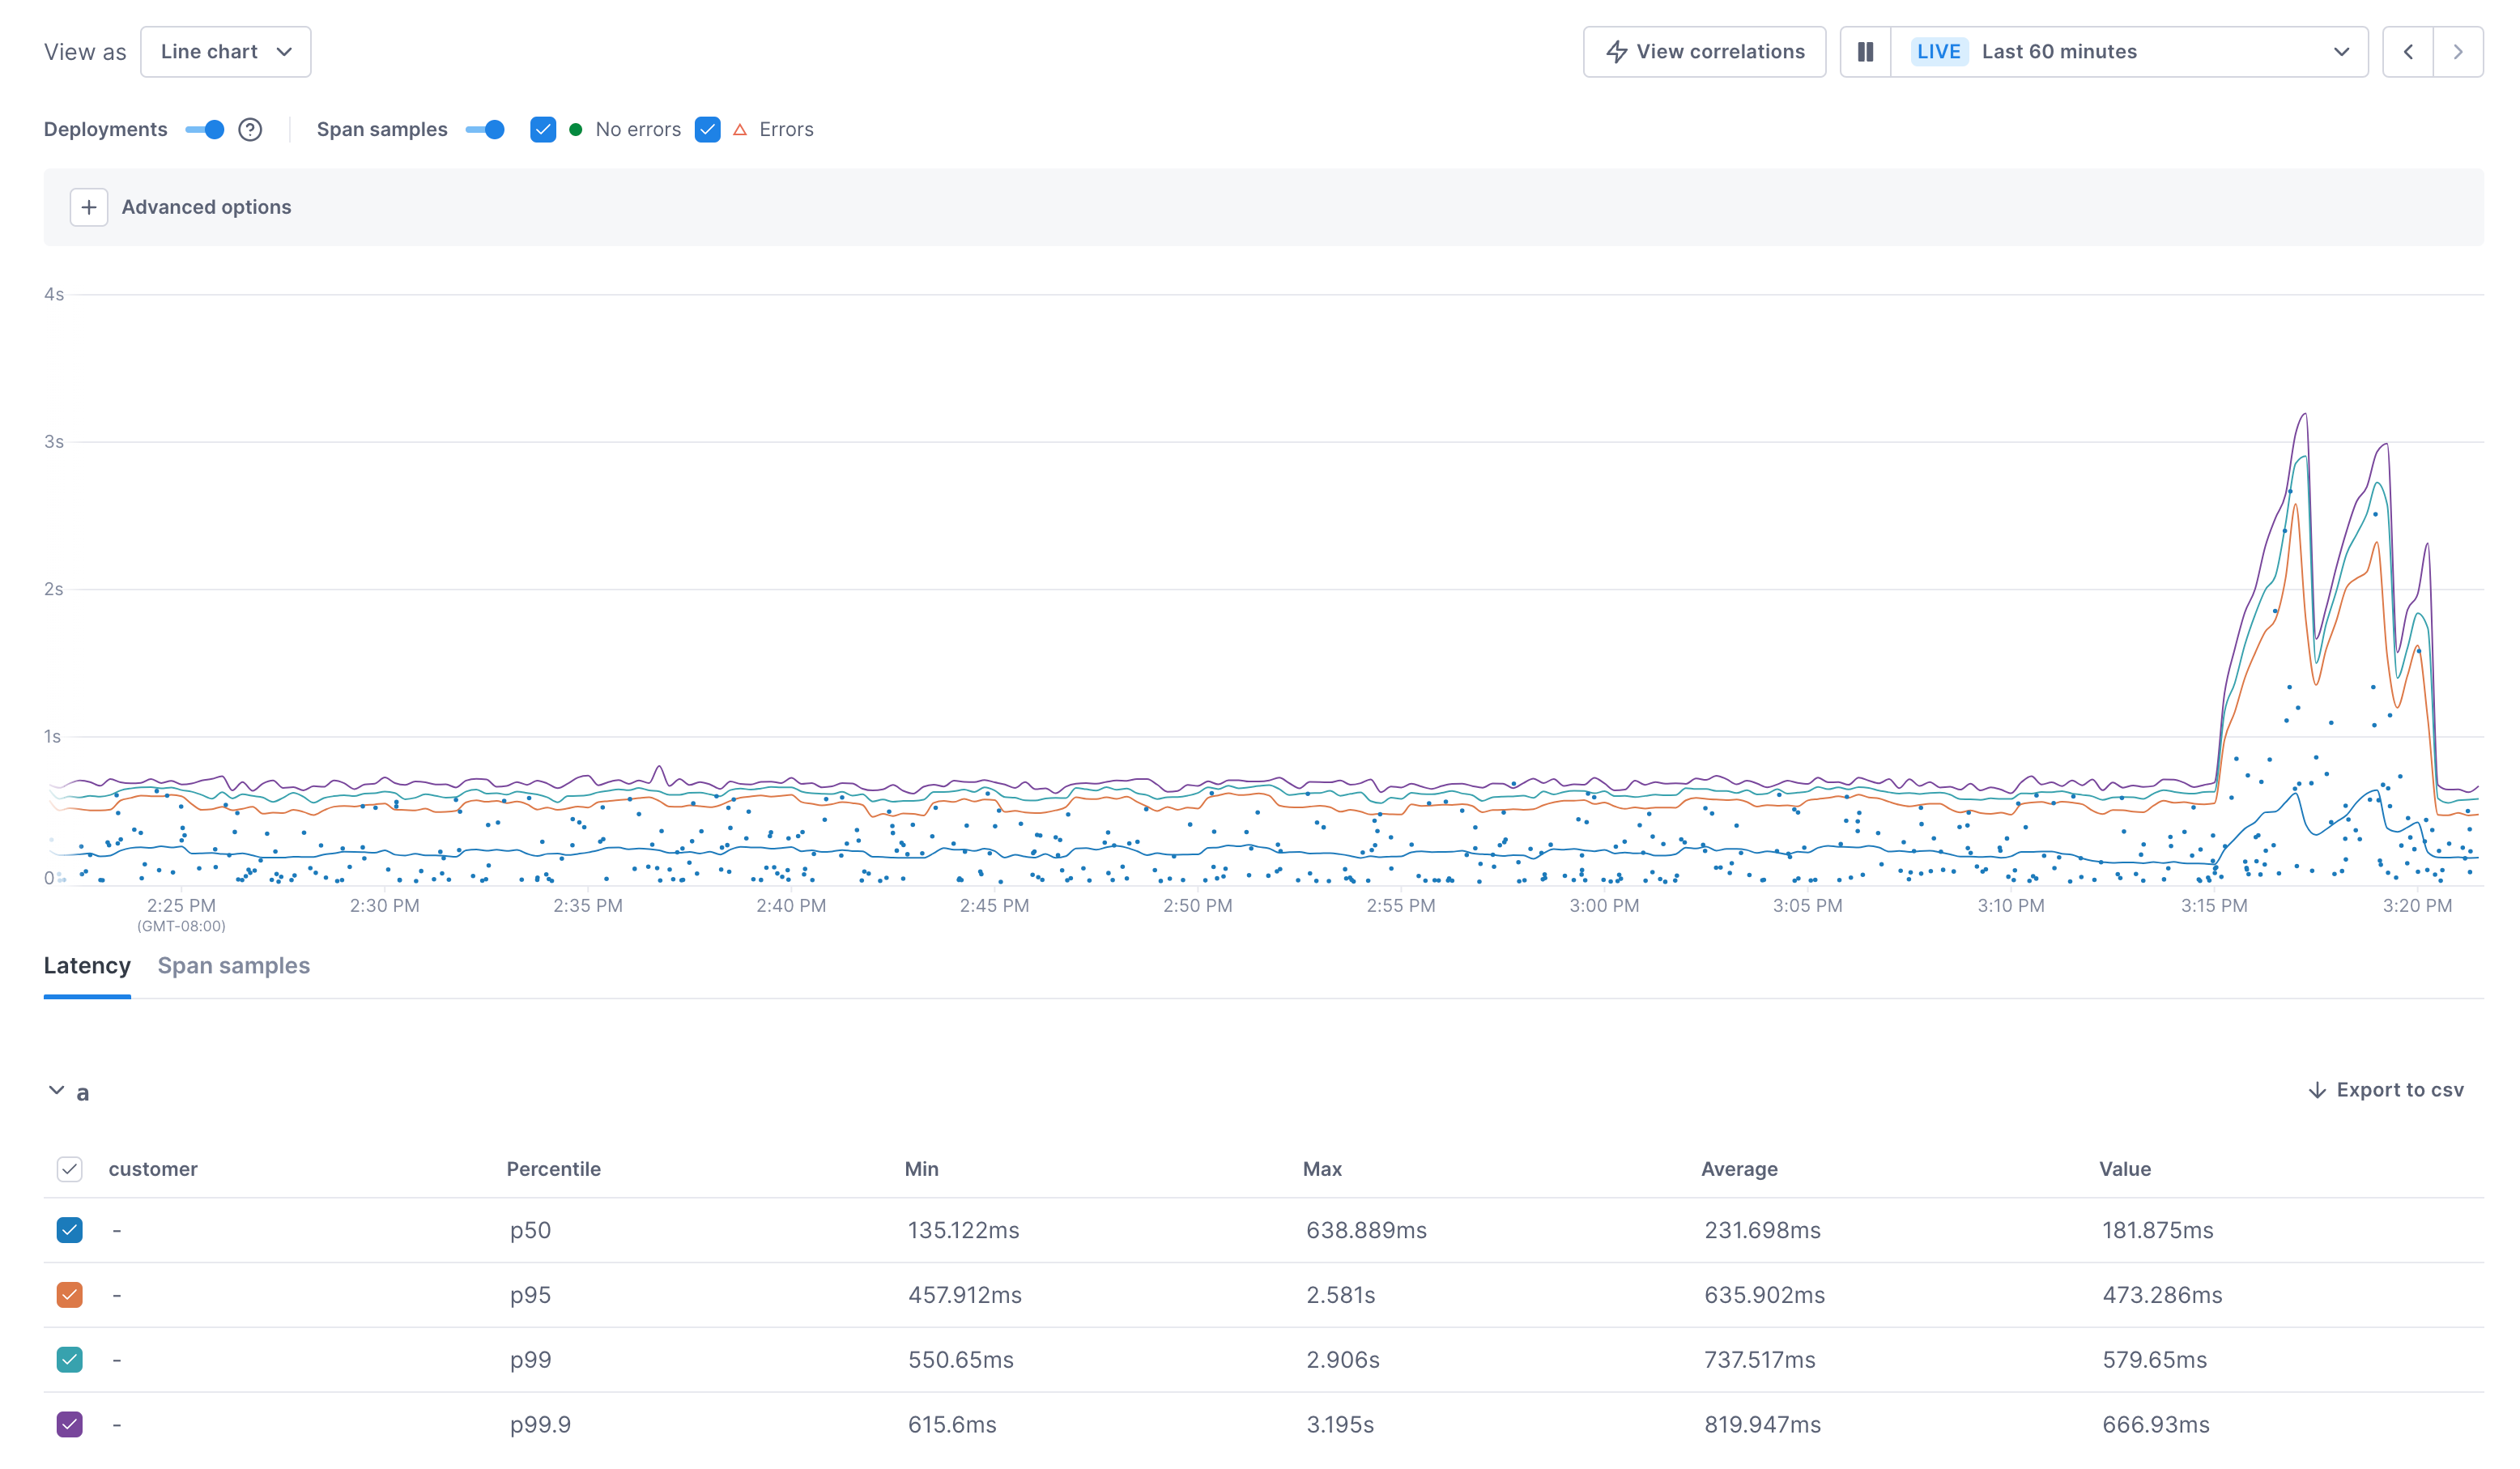
You can click into a chart and immediately start your investigation using Cloud Observability’s correlation feature.
Using Terraform? You can use the Cloud Observability Terraform provider to create and manage your dashboards and panels. You can also export existing dashboards into the Terraform format.
Learn more:
- Create and manage unified dashboards
- Create and manage charts
- Learn about UQL
- Investigate deviations
Set up alerts
You create alerts by setting thresholds on log, metric, and span queries. 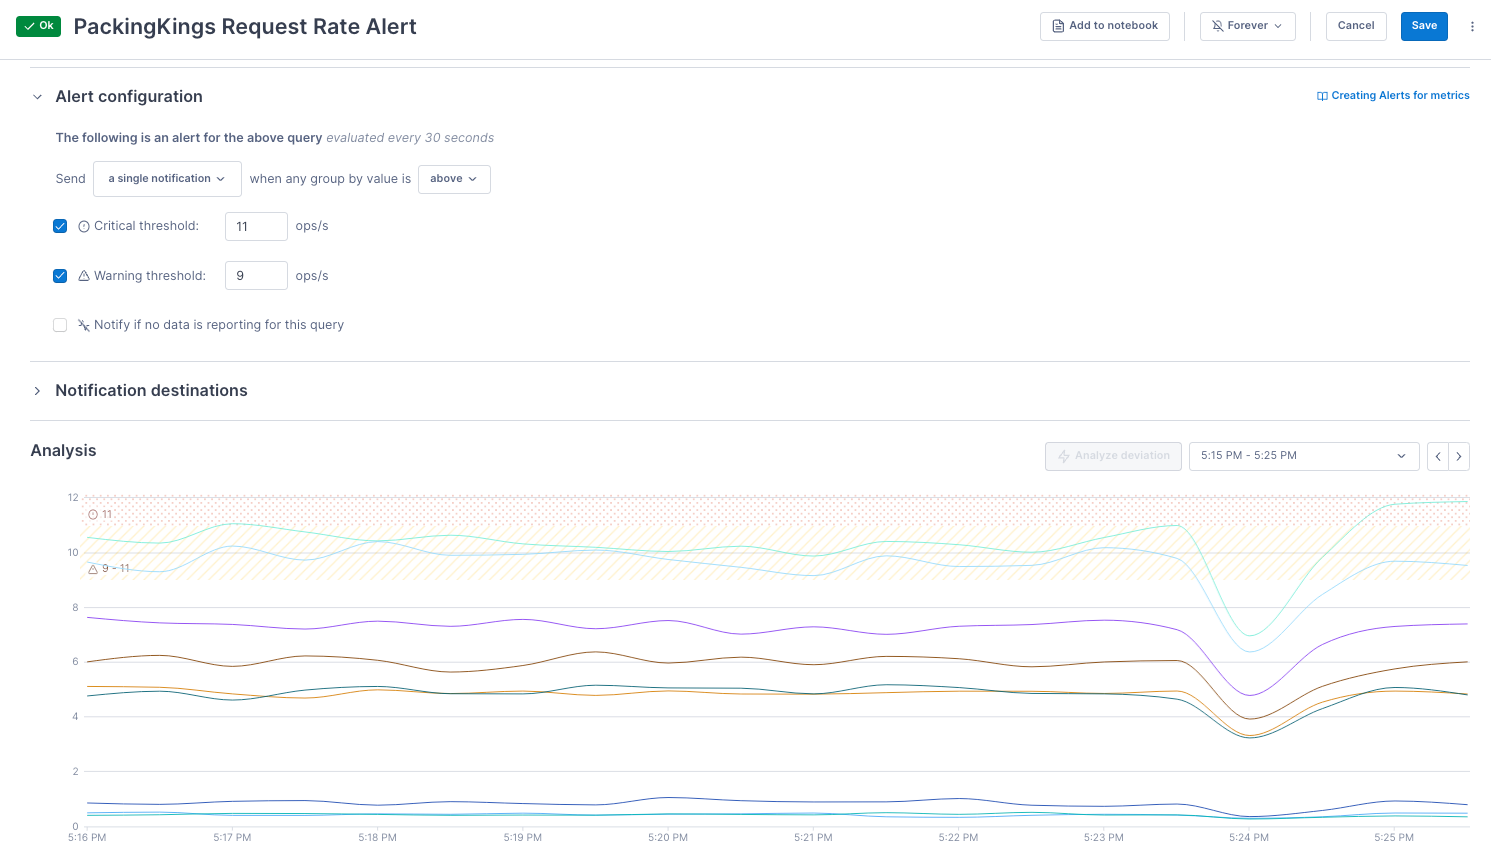
Notification destinations determine where the alert should be sent. Cloud Observability supports PagerDuty, Slack, and BigPanda out-of-the-box. You can use webhooks to integrate with other third-party destinations. 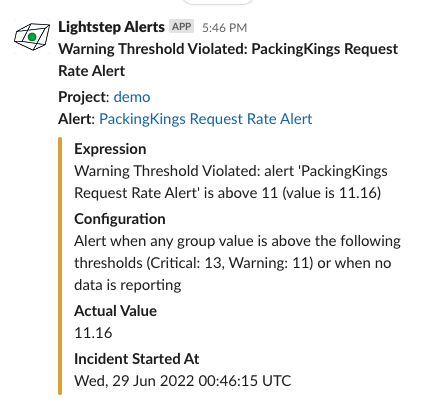
Learn more:
Investigate root causes
Cloud Observability helps you find the possible causes of performance and error issues. It can correlate spikes in metric performance or errors with changes in span data that occurred at the same time. Using span data, Cloud Observability analyzes traces to determine service dependencies that may be causing latency or errors in services further up or down the stack.
Triage incidents using notebooks
When you begin an investigation, you often need to run a number of queries to reach a hypothesis about the origin of an issue. Notebooks allow you to query logs, metrics, and spans in one place to reach that hypothesis and then share those findings with other team members. 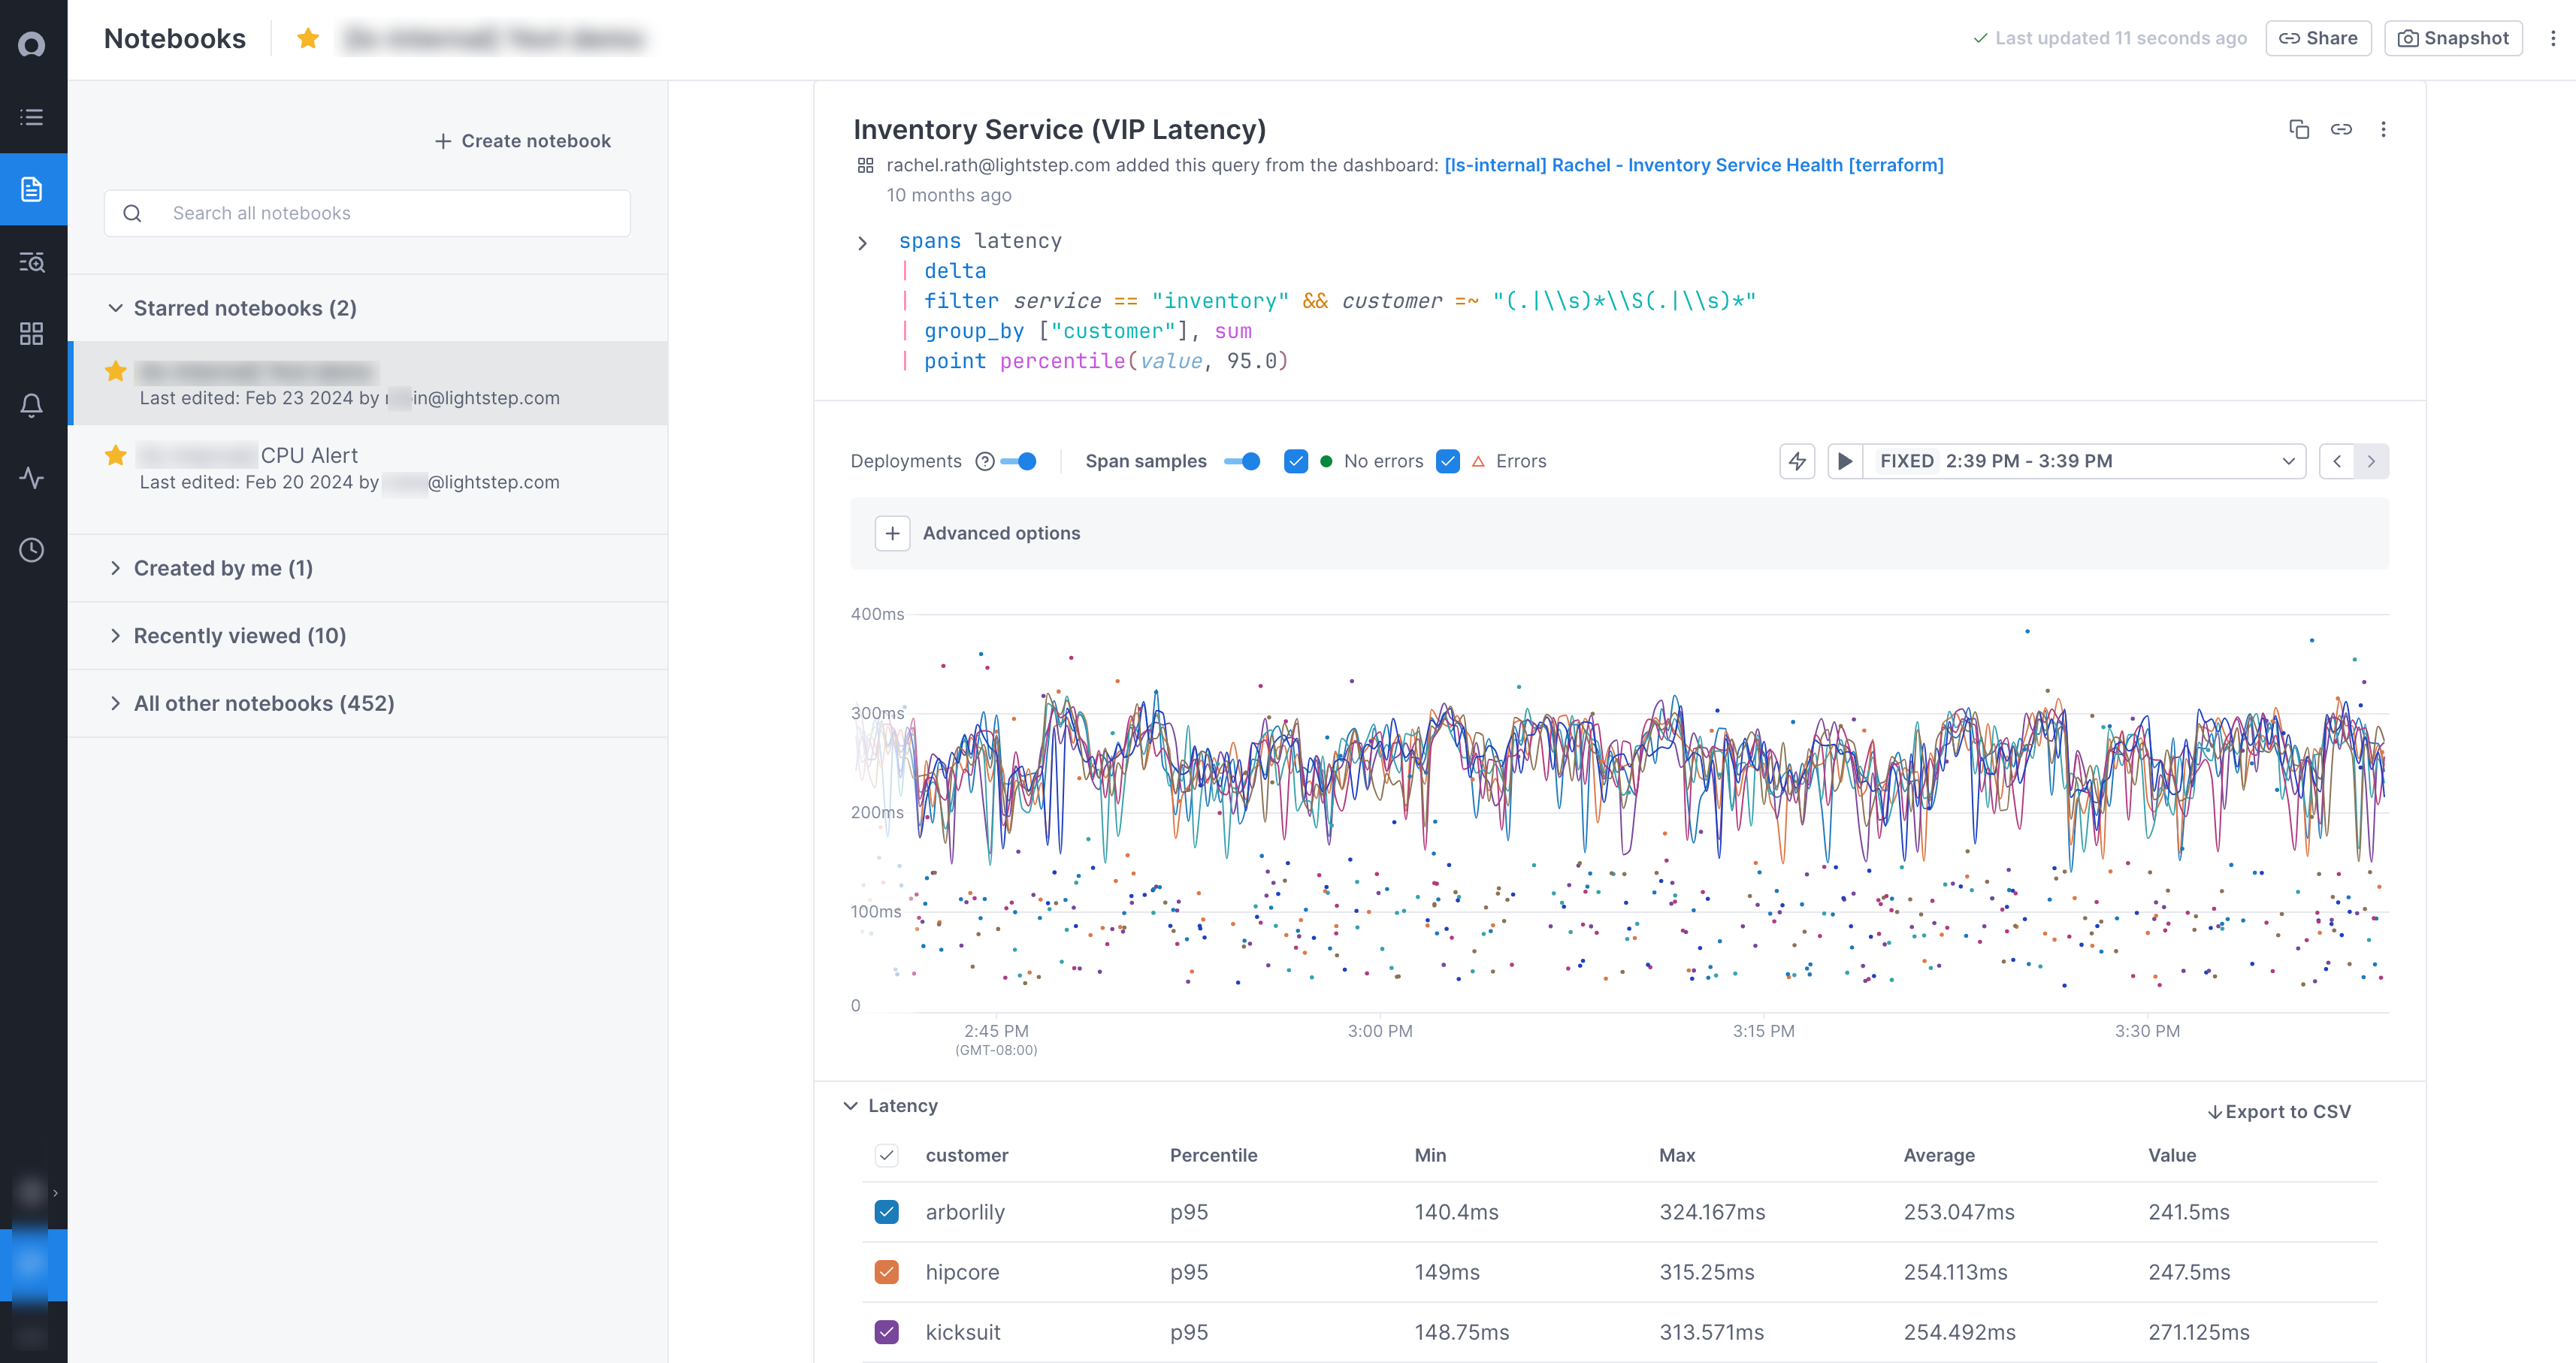
Once you mitigate the issue, you can transfer your learnings from notebooks to begin deeper root cause analysis.
Learn more: Use notebooks in your investigation
Find potential causes of change
Cloud Observability’s correlation feature relates metric and span data to help find the cause of metric deviations. It determines the service that emitted a metric, searches for performance changes on Key Operations from that service at the same time as the deviation, and then uses trace data to determine what caused the change.
You access the correlation feature from any chart on a dashboard, notebook, or alert. A side panel displays attributes on spans that experienced a change in performance at the same time as a deviation on the chart. You can copy queries for these attributes and paste them into a notebook, where you can continue your investigation.
Learn more: Investigate a deviation
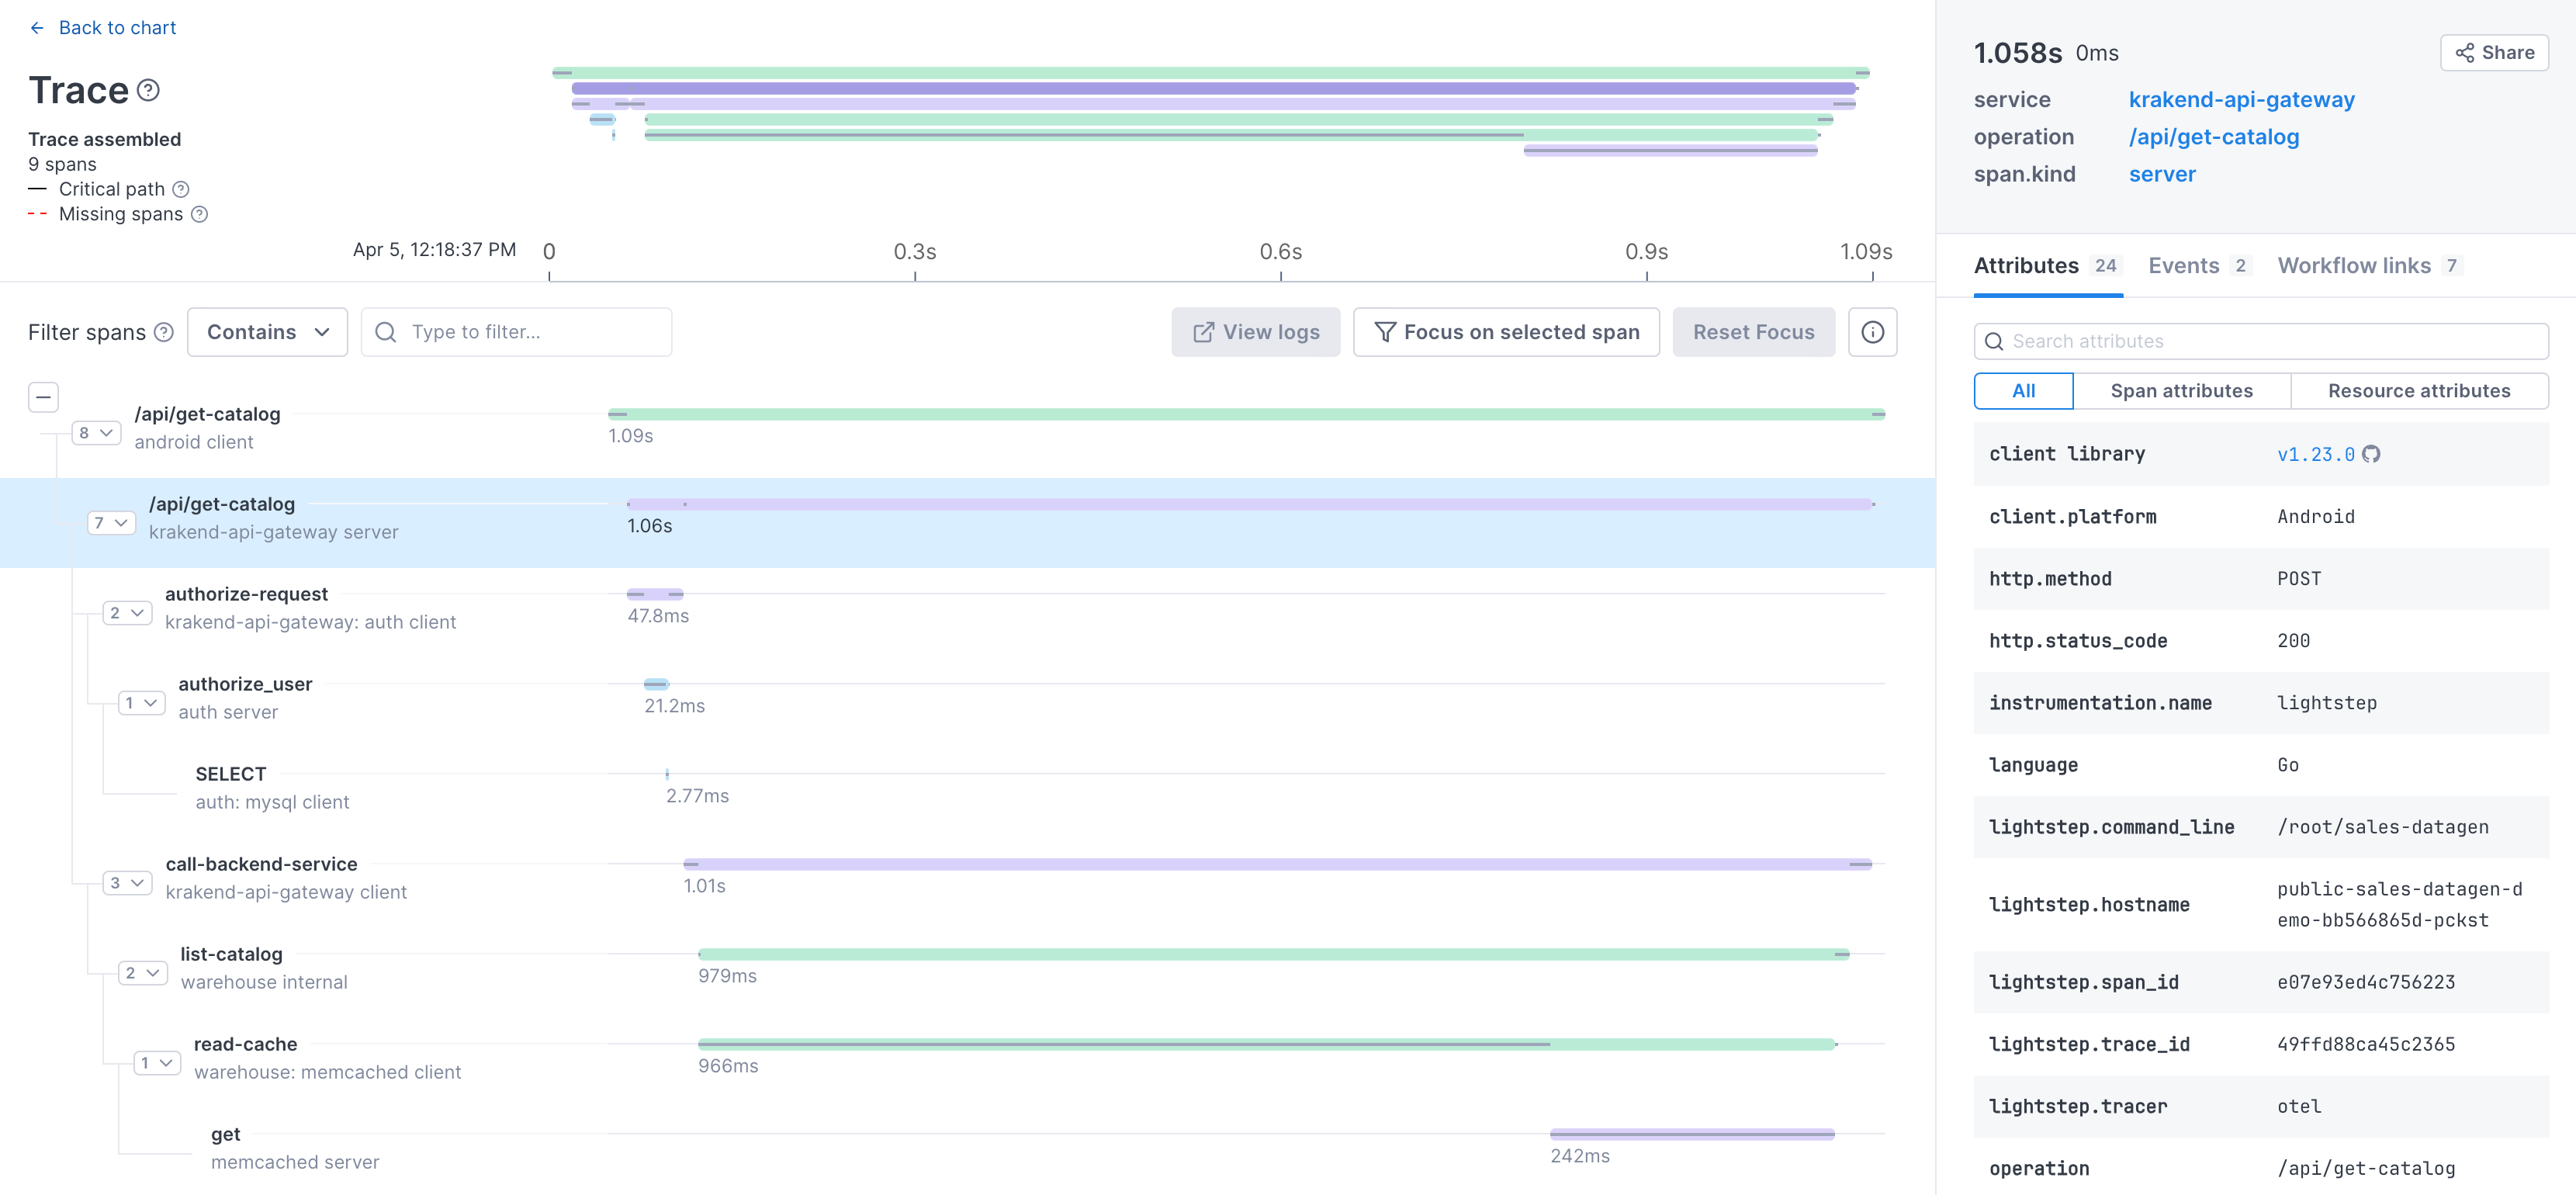
View a full trace
From all tools that you might use in your investigation, you can click through to a full-stack trace of a request. A side panel provides details of each span in the trace, allowing you to view its attributes, logs, and other details. The Trace view illustrates the critical path for you (the time when an operation in a trace is actually doing something) so you can immediately see bottlenecks in the request. The Trace view is where you can prove out your hypotheses.
View and explore logs
View, query, and explore logs in Cloud Observability’s logs tab. The tab lets you search logs, filter log fields, live tail logs, and more. Use it to monitor performance and troubleshoot issues.
Learn more: Explore logs
View service health
You can add a Service health panel to your dashboard where you can view SLI (latency, error, and rate) data for all your services.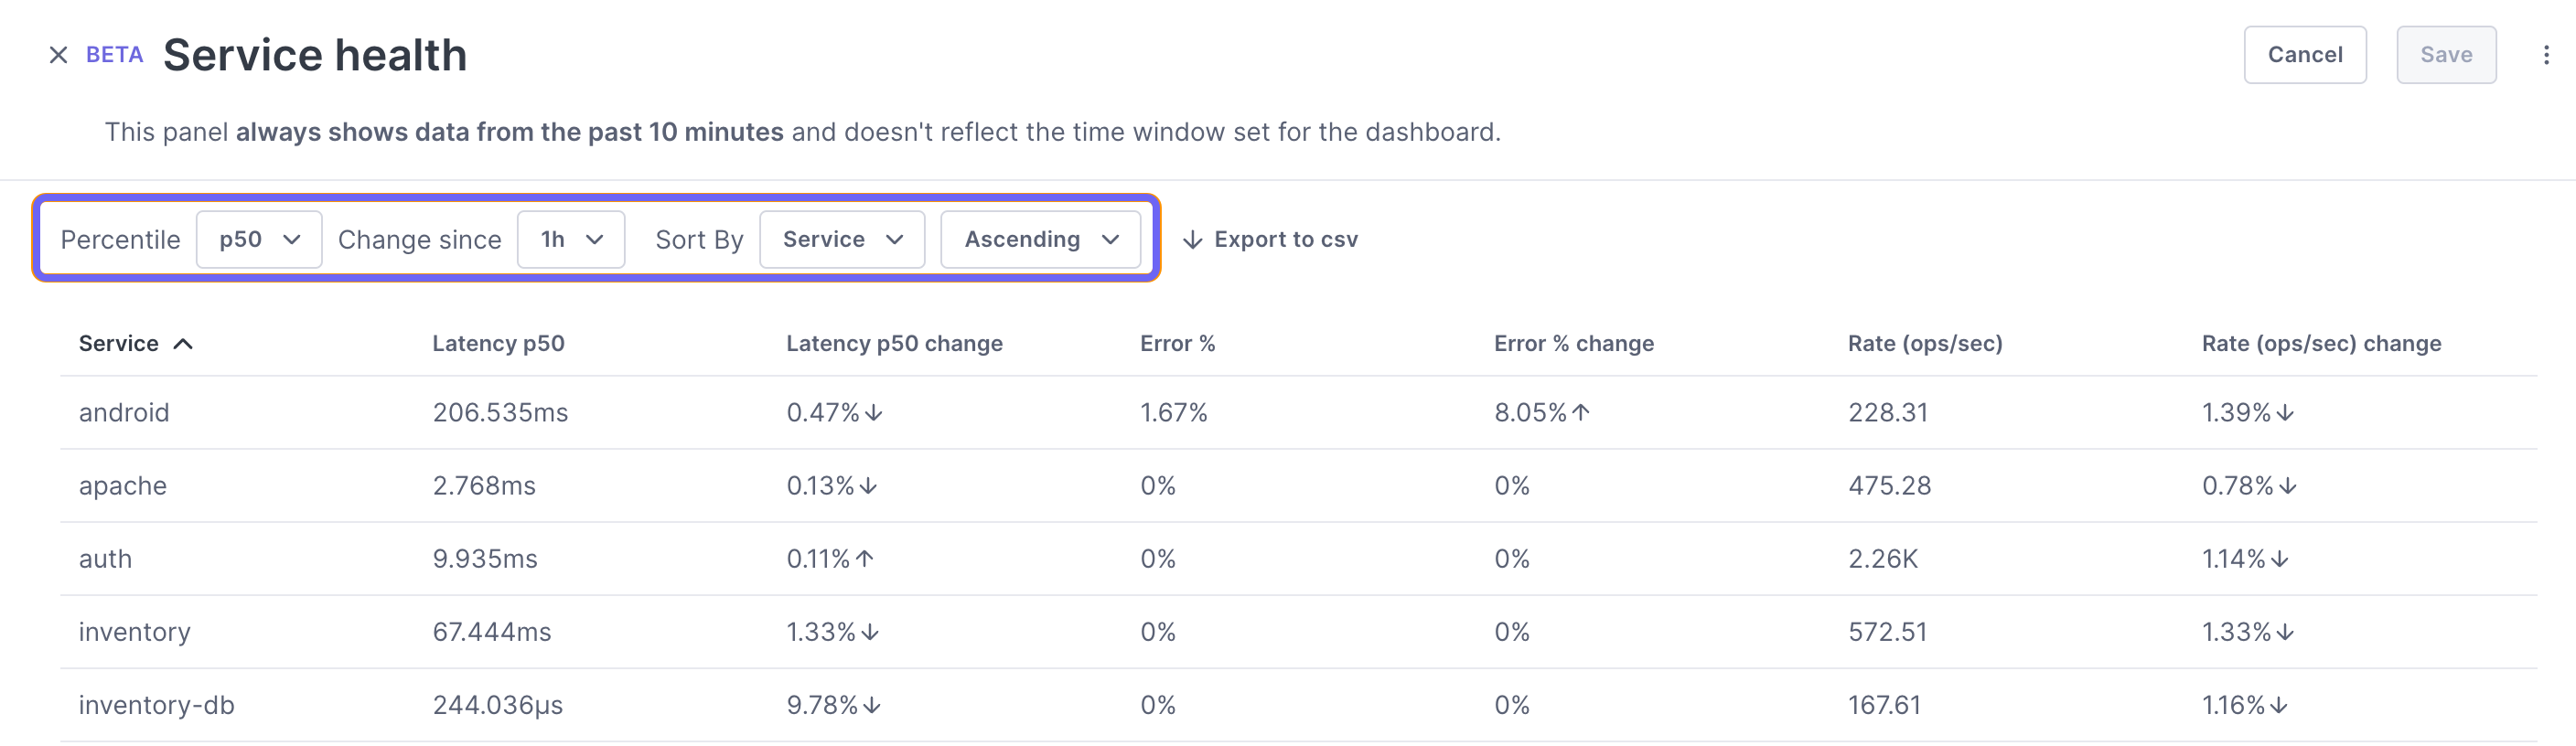
The Service Directory view lets you see at a glance how services reporting to Cloud Observability are performing. At a glance, you can view changes to performance on a service’s operations. 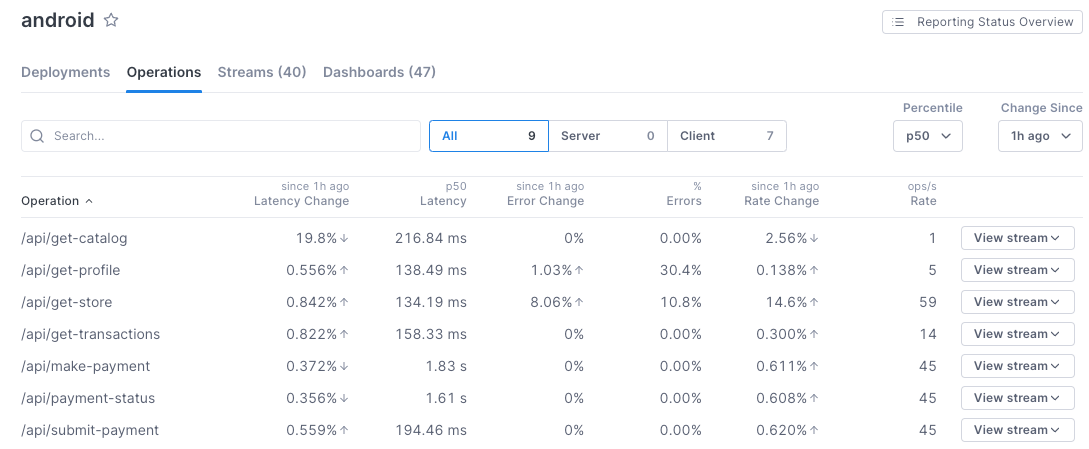
You can also see how well a service is instrumented for tracing, and where you can make improvements. 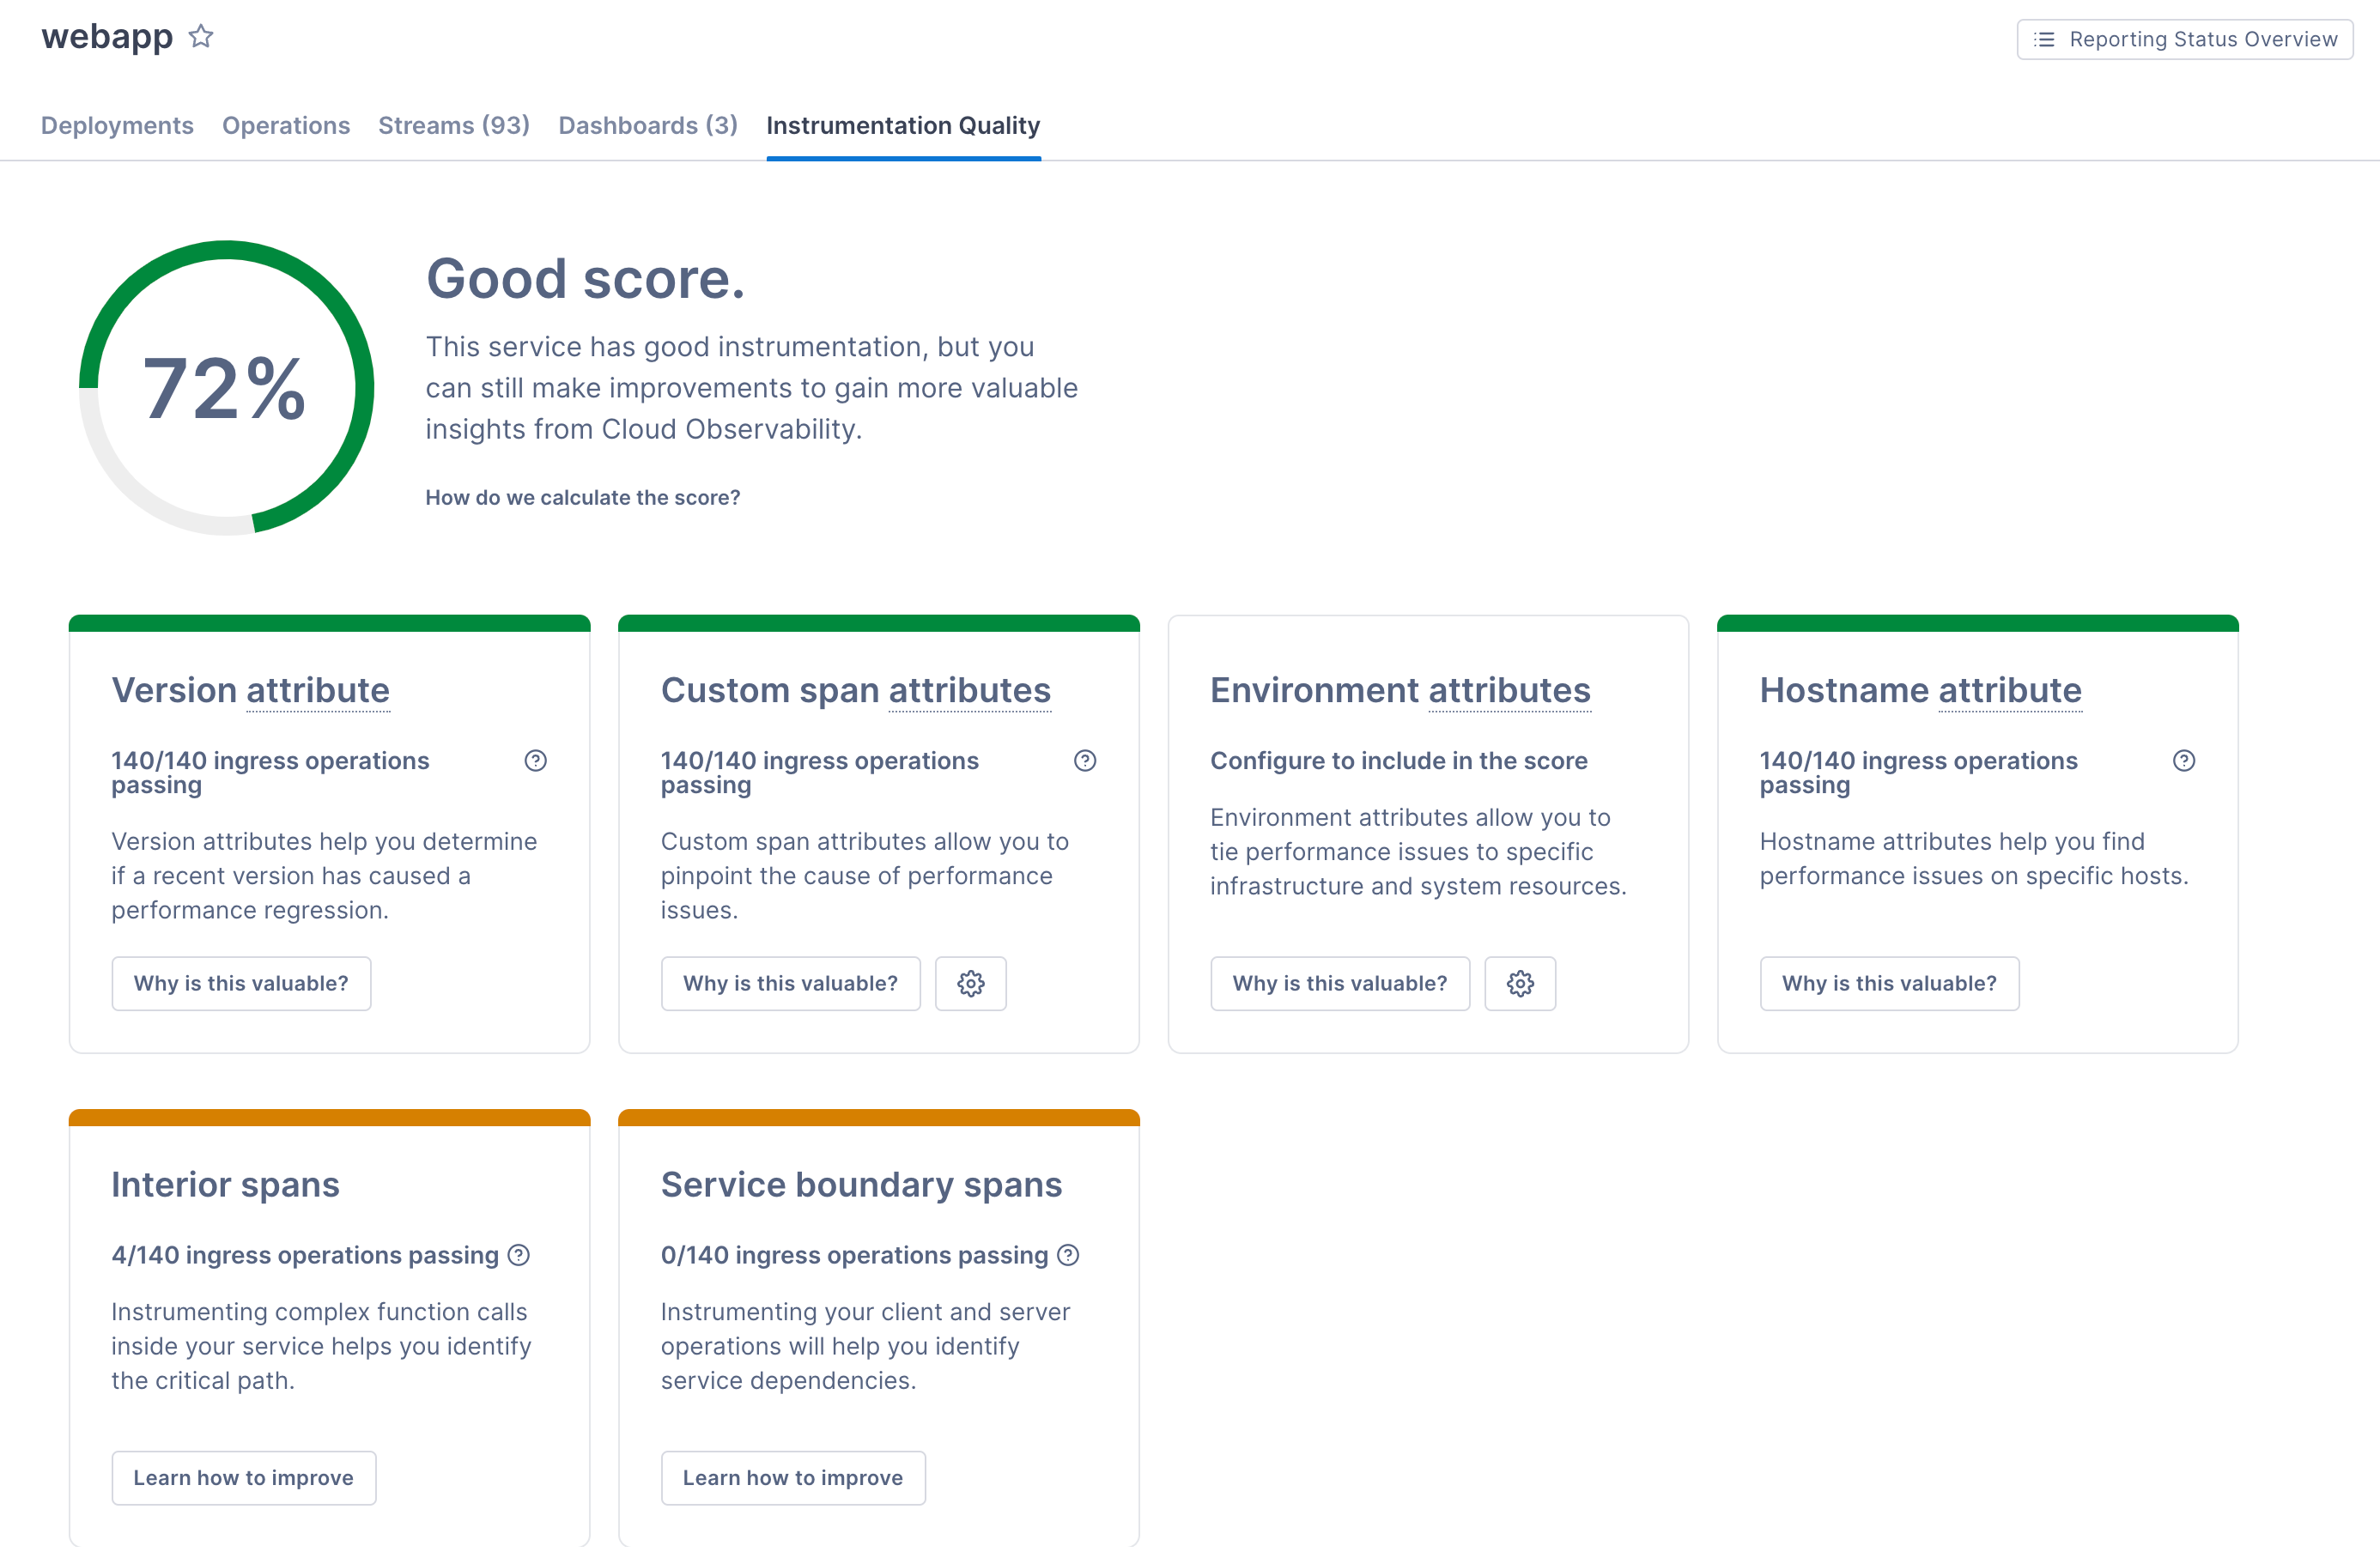
Learn more: View service health
See also
Updated Dec 6, 2023