
View, manage, and investigate Cloud Observability alerts.
View alerts and status
Use the Alerts page to find, react to, and fix problems in your system.
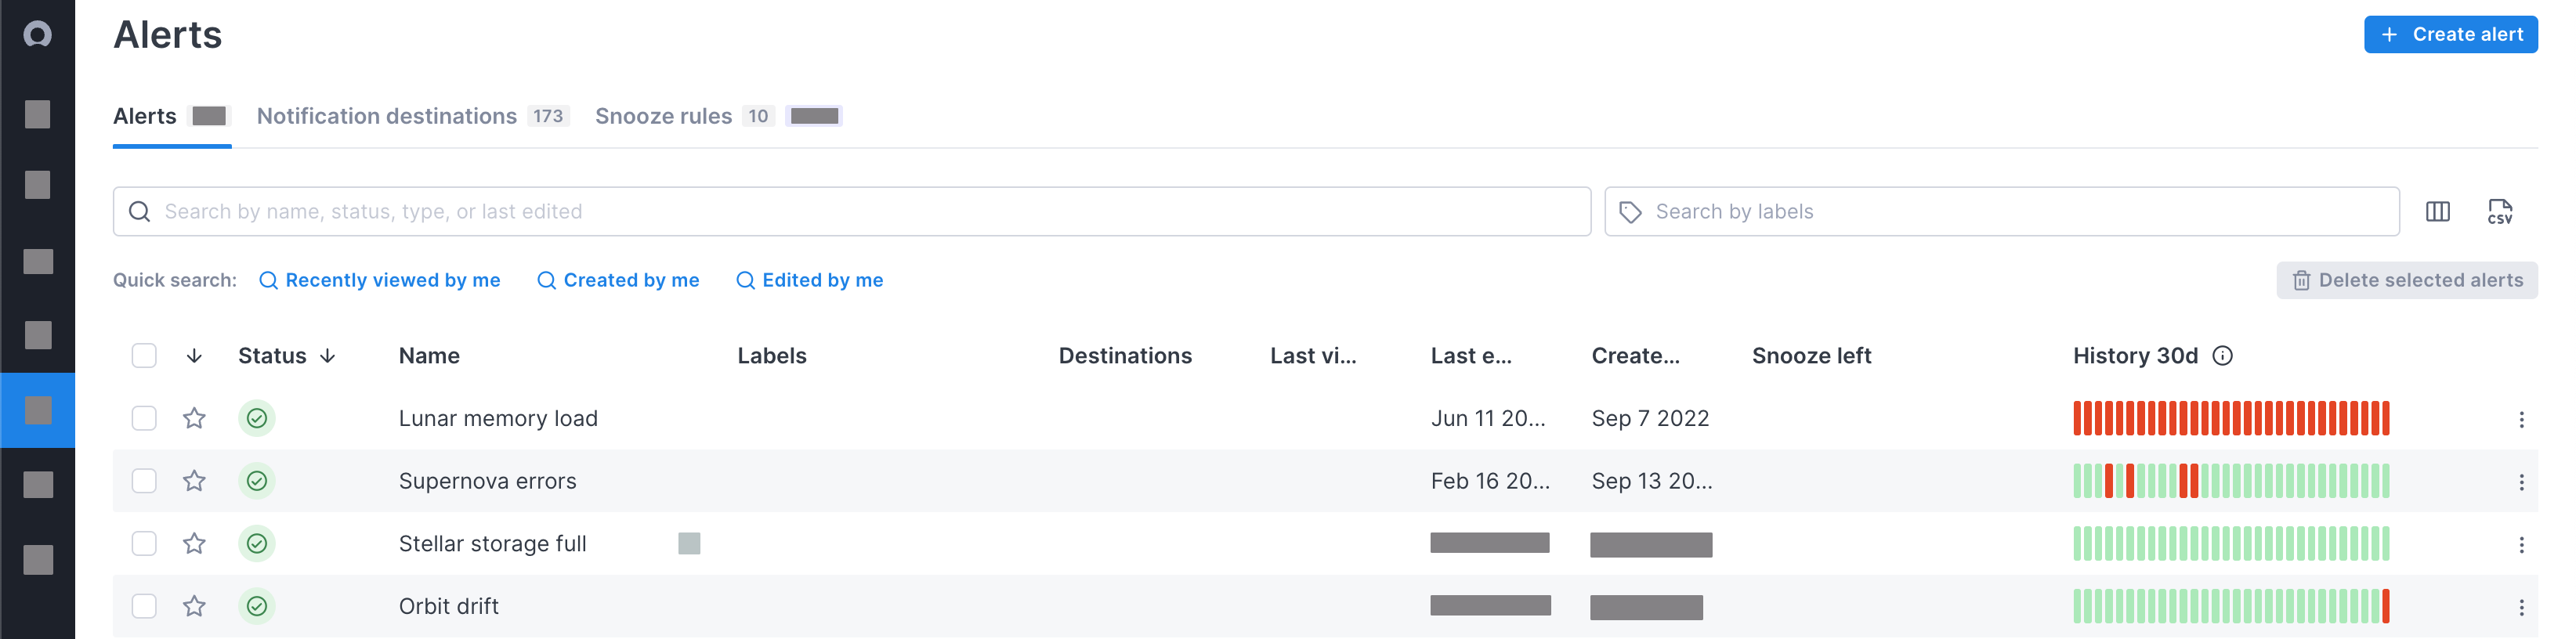
The Alerts page lists configured alerts, their status, and details. To open the page, select Alerts in Cloud Observability’s sidebar.
Customize the page’s table and columns with Reset layout. Select the Reset layout button next to the search bar to hide and show columns, reorder columns, and restore the table’s defaults.
Alert statuses
By default, the Alerts page lists all alerts by status, with Warning and Critical alerts at the top. Alerts have the following statuses:
-
Critical
The alert violates the critical threshold.
-
No data
The alert has no data to evaluate. Cloud Observability isn’t receiving any relevant data for the alert.
-
Ok
The alert is active and is in a nontriggered state. Cloud Observability is analyzing inbound traffic against the alert criteria.
-
Unknown
The alert exists, but it’s not active yet. Try refreshing the page to get the alert’s latest status.
If the status remains Unknown, select the alert. The message Your alert will activate in X days when Cloud Observability has enough data to run the alert query indicates the number of days until Cloud Observability activates the alert.
-
Warning
The alert violates the warning threshold.
If the alert is grayed out, the alert is in a snoozed state.
You can also visualize and track alerts and their statuses on dashboards. Learn about alerts lists.
Alert history
Use the History 30d column to view alert history. Alert history can help you with the following:
- See patterns in alert behavior.
- View overall system health and stability over time.
- Find specific days to investigate for efficient problem-solving.
The History 30d column visualizes the alert’s status over the past month. Every bar represents one day and shows the alert’s severest status. For example, if an alert had Ok and Critical statuses four days ago, the bar for that day is Critical.
Point to a bar to see the exact date and status.
Manage alerts
Delete alerts
Delete alerts to update your monitoring strategy and help alert recipients focus on the most important notifications.
Follow these steps to delete an alert:
- In Cloud Observability, select Alerts.
- On the Alerts page, find the relevant alert and select ⋮ > Delete.
-
In the Delete alert? dialog, select Yes, delete.
You won’t be able to recover your alert.
Cloud Observability deletes the alert and returns you to the Alerts page.
Snooze alerts
Snooze alerts to stop getting notifications and help prevent alert fatigue during scheduled maintenance, temporary issues, and ongoing investigations.
Cloud Observability offers two ways to snooze alerts:
-
Snooze - Snooze one alert for a specific timeframe.
Example: Snooze the Span ingestion rate alert for 4 hours.
-
Snooze rule - Snooze one or more alerts on specific or recurring schedules.
Example: Snooze alerts with the label
galactic-datacenterevery Monday from 9:00 to 10:00 p.m.
-
Follow these steps to snooze an alert for a specific timeframe:
- In Cloud Observability, select Alerts.
- On the Alerts page, find and select the relevant alert.
-
Select the Snooze drop-down, select the snooze timeframe, and select Apply.
Cloud Observability displays Snoozed until X.
- Return to the Alerts page to view your snoozed alert.
The snoozed alert is grayed out. Cloud Observability still updates the alert’s status but doesn’t send notifications. To see the time the snooze ends, point to the Snooze left column.
Follow these steps to manually unsnooze an alert:
- In Cloud Observability, select Alerts.
- On the Alerts page, find and select the relevant alert.
- Select the Snooze drop-down, select Off, and select Apply.
Cloud Observability displays Turned off snooze.
-
Follow these steps to snooze one or more alerts on a schedule:
- In Cloud Observability, select Alerts > Snooze rules.
- In the Snooze rules tab, select Create snooze rule and fill out the rule configuration page:
- Title - Enter a name for the snooze rule.
- Schedule - Choose One-time for the snooze rule to happen once, or choose Recurring for the snooze rule to repeat.
- Timezone - Select the time zone for the snooze rule. Use this setting to adapt to teams in different time zones.
-
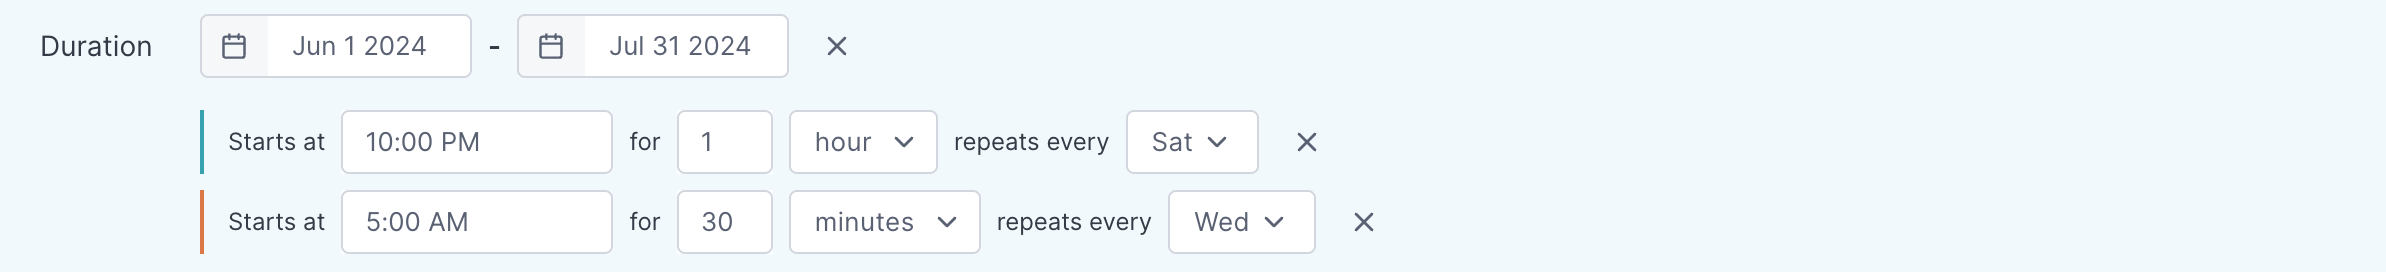
Duration - Set the start and end time for the snooze rule. For recurring snooze rules, add up to three occurrences.
Example: Snooze alerts for two months every Saturday from 10:00-11:00 p.m. and every Wednesday from 5:00-5:30 a.m.
-
Filters - Specify the alerts you want to snooze by filtering on alert names and labels.
Example: Snooze alerts named Solar flare activity and Asteroid traffic with the labels
galactic-datacenterortest-env.
-
Select Save to create your rule.
Cloud Observability returns you to the Snooze rules tab and displays Successfully created snooze rule - <rule name>.
When a snooze rule is active, the Alerts page still shows the latest alert status but doesn’t send notifications. To see the time the snooze rule ends, point to the Snooze left column.
Follow these steps to delete a snooze rule:
- In Cloud Observability, select Alerts > Snooze rules.
- In the Snooze rule tab, find the relevant alert and select ⋮ > Delete.
- In the dialog, select Yes, delete – you won’t be able to recover the snooze rule.
Cloud Observability deletes the snooze rule and returns you to the Snooze rules tab.
Investigate correlations
Use Cloud Observability’s correlation feature to investigate triggered alerts and find possible causes:
- In Cloud Observability, select Alerts.
- On the Alerts page, find and select the relevant alert.
- In the chart, select the area of the chart you want to analyze and then select View correlations.
Cloud Observability displays the View correlations panel and the results. To learn more about this feature, visit Investigate deviations.
The correlation feature works on metric and span alerts only.
Integrate and export alerts
Add alerts to notebooks
During investigations, add alert charts to notebooks to do the following:
- View alert charts alongside other charts.
- Run ad hoc queries without affecting alert configurations.
- Take notes in text blocks.
- Save your analysis for postmortems.
Follow these steps to add an alert chart to a notebook:
- In Cloud Observability, select Alerts.
- On the Alerts page, find and select the relevant alert.
- Select Add to notebook and either select an existing notebook or create a new one.
Cloud Observability opens the notebook in a new tab. The chart title matches the alert name, and the subtitle links to the original alert.
Export configurations to Terraform
If you use Terraform, streamline alert management by exporting baseline alerts or snooze rules to a Terraform file.
Because it’s easier to create alerts and snooze rules in a UI, create baseline configurations in Cloud Observability and export them to Terraform files. You can then copy and edit those files to create new Terraform configurations.
-
Follow these steps to export an existing Cloud Observability alert to a Terraform file:
- In Cloud Observability, select Alerts.
- On the Alerts page, find and select the relevant alert.
- Select ⋮ > Export to Terraform.
Cloud Observability creates a
.tffile you can download to any local directory. -
Follow these steps to export an existing Cloud Observability snooze rule to a Terraform file:
- In Cloud Observability, select Alerts > Snooze rules.
- In the Snooze rules tab, find and select the relevant snooze rule.
- Select the Save drop-down and select Save & export Terraform.
Cloud Observability creates a
.tffile you can download to any local directory.
See also
Manage notification destinations
Updated Mar 27, 2024