
Cloud Observability collects and analyzes telemetry data across infrastructure, application, runtime, cloud, and other third-party services. By unifying logs, metrics, and traces into one workflow, you can make connections across telemetry types and systems, detect and mitigate changes faster, and gain visibility into distributed systems. If you are interested, learn more about how Cloud Observability works.
This Quickstart demonstrates how to use the Kubernetes Operator for OpenTelemetry Collector to send infrastructure metrics, and optionally application traces and logs, to Cloud Observability using a Helm chart following Collector general guidelines. This tutorial walks you through how to use Opentelemetry Collector Receivers to send OTLP metrics. This method differs from the Prometheus quickstart which is recommended for use when you want exact duplication of your Prometheus installation. See Cloud Observability’s Technology Recommendations for recommended cloud environments.
A prerequisite of this quickstart is a running Kubernetes cluster. It can be either a standard Kubernetes distribution or a managed Kubernetes distribution like Azure AKS, Google GKE, or AWS EKS. If you’d just like to test locally, we recommend using minikube and the OpenTelemetry Demo.
For more on the Kubernetes Operator for OpenTelemetry Collector, see the official OpenTelemetry docs.
Prerequisites
- A Kubernetes cluster (either local using a tool like minikube or a cluster running in the cloud) with at least 2 CPUs and 4 GB of memory.
- Helm v3 or later.
- A Cloud Observability account
- A Cloud Observability access token for the Cloud Observability project you would like to use.
Verify your setup
-
Run the following command to verify you are connected to a Kubernetes cluster.
1
 kubectl cluster-info
If you see errors or cannot connect, follow the instructions from minikube or your cloud provider on authenticating with your cluster.
-
Next, verify Helm is installed.
1
 helm version
Verify you are on Helm v3.
We recommend using Helm to manage dependencies and upgrades. However, if you cannot deploy Helm charts, you can use the helm template command to automatically generate Kubernetes manifests from an existing chart.
Add Helm repositories and install charts
-
Run the following command to add the following Helm respositories and pull the latest charts:
These Helm charts configure your environment (especially the Collector) to work best with Cloud Observability.
1
2
3
4
5
 helm repo add jetstack https://charts.jetstack.io
 helm repo add open-telemetry https://open-telemetry.github.io/opentelemetry-helm-charts
 helm repo add prometheus https://prometheus-community.github.io/helm-charts
 helm repo add lightstep https://lightstep.github.io/otel-collector-charts
 helm repo update
-
Next, install the cert-manager charts on your cluster. The Cert Manager manages certificates needed by the Operator to subscribe to in-cluster Kubernetes events.
1
2
3
4
5
6
 helm install \
     cert-manager jetstack/cert-manager \
     --namespace cert-manager \
     --create-namespace \
     --version v1.8.0 \
     --set installCRDs=true
-
Create a namespace for ServiceNow Cloud Observability
1
 kubectl create ns sn-cloud-obs
- Install the OpenTelemetry Operator chart. The Operator automates the creation and management of collectors, autoscaling, code instrumentation, scraping metrics endpoints, and more.
1
2
3
4
5
 helm install \
     opentelemetry-operator open-telemetry/opentelemetry-operator \
     -n sn-cloud-obs \
     --set "manager.collectorImage.repository=otel/opentelemetry-collector-k8s" \
     --version 0.56.0
- Run the following command to verify both charts successfully deployed with a status that says
deployed:1
helm list -A
Send Kubernetes metrics to Cloud Observability
The OpenTelemetry Collector has several receivers and processors that let you collect and enrich Kubernetes data all with OTLP data. If you send OTLP data to a collector with these processors you are able to enrich your application’s telemetry with infrastructure metadata. Cloud Observability provides a Helm chart to automatically configure collectors to send these metrics to Cloud Observability.
-
Create a secret that holds your Cloud Observability Access Token.
1
2
 export LS_TOKEN='<your-token>'
 kubectl create secret generic otel-collector-secret -n sn-cloud-obs --from-literal="LS_TOKEN=$LS_TOKEN"
-
Install the
otel-cloud-stackchart. This chart automatically creates collectors to push Kubernetes metrics to your Cloud Observability project. This chart will install a singleton collector for Kubernetes cluster metrics and a daemonset collector to collect node and kubelet metrics (as well as any Prometheus instances with theprometheus.io/scrape: "true"annotation.)Make sure to replace
your-cluster-namewith the name of the cluster you are connected to.1 2 3 4
helm install otel-cloud-stack lightstep/otel-cloud-stack \ -n sn-cloud-obs \ --set clusterName=your-cluster-name # --set otlpDestinationOverride="ingest.eu.lightstep.com:443" \ # EU data center
-
Verify the pods from the charts have been deployed with no errors:
1
 kubectl get pods
You should see pods for a stats-collector and a daemonset for node metrics.
See metrics in Cloud Observability
-
In Cloud Observability, you can view Kubernetes metrics in either a notebook or dashboard.
When using notebooks you can click on any Kubernetes metrics in the
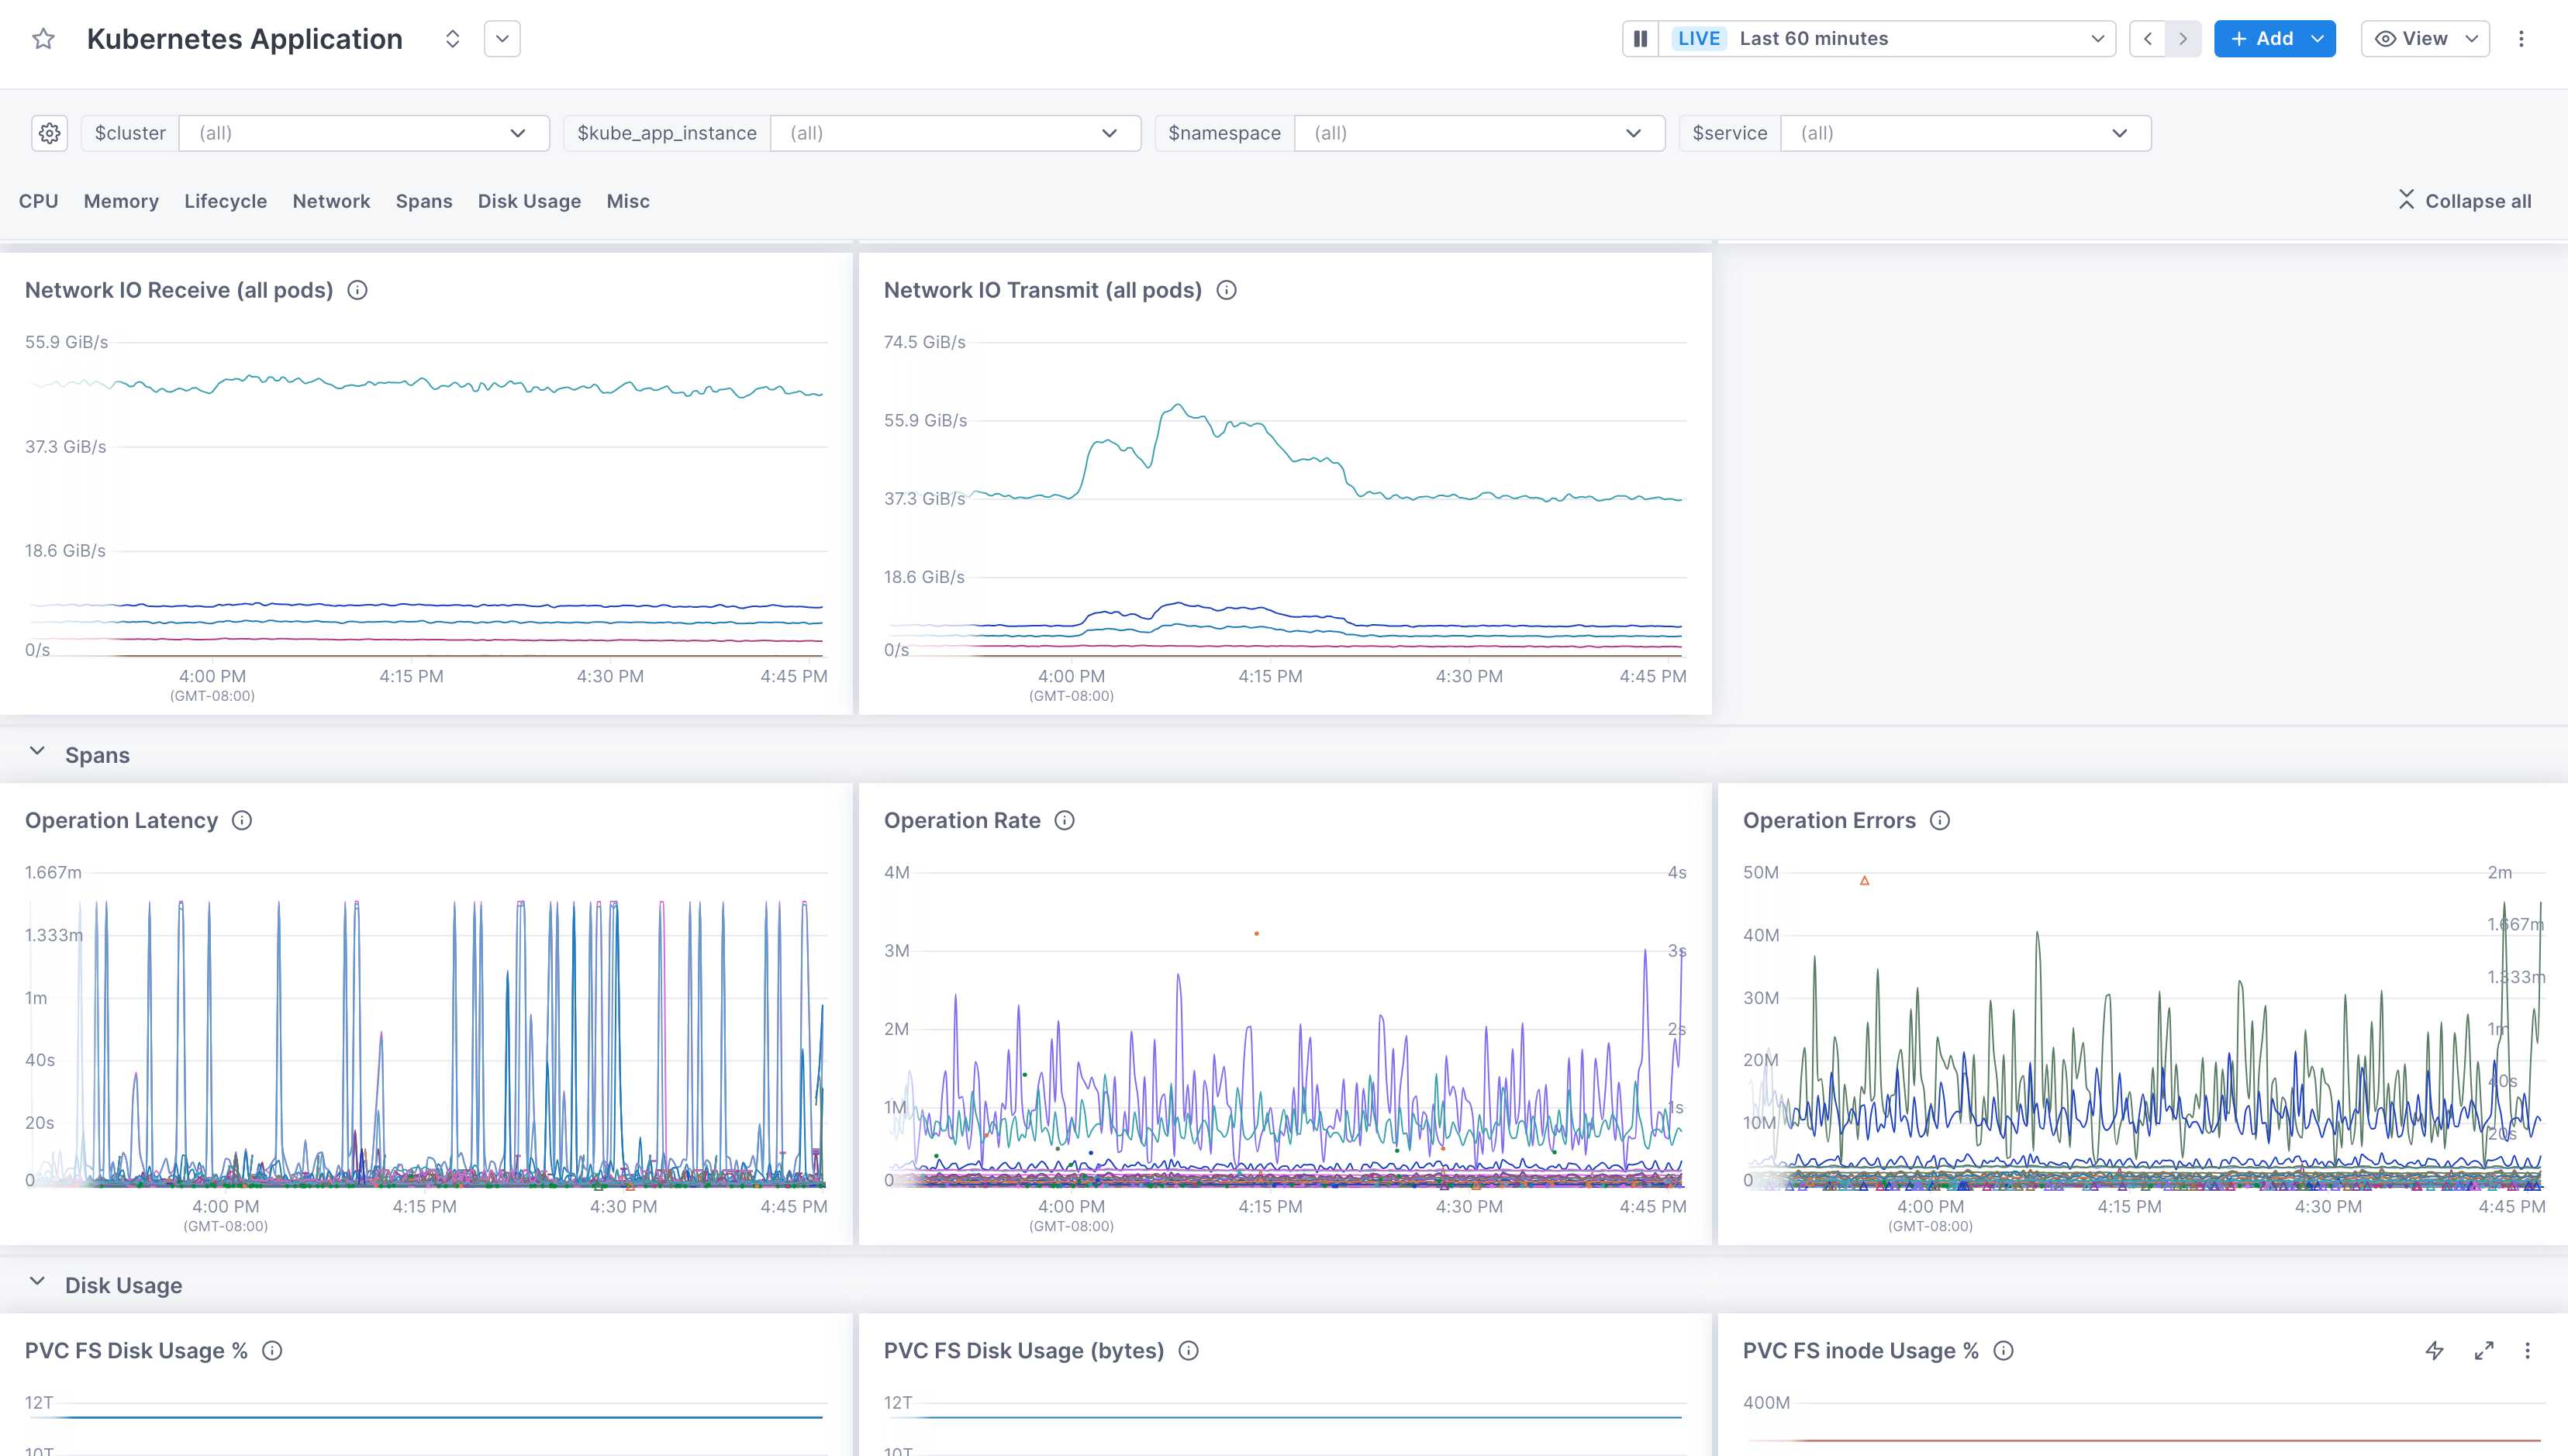
all telemetrydropdown.For dashboards, there are several pre-built dashboards that display Kubernetes metrics. For example, to see Pod metrics, in the Dashboard view, click Create a pre-built dashboard, and choose “Kubernetes Application”.
Send traces to Cloud Observability
Send data from your applications to Cloud Observability
You can also use the Operator to deploy a collector configured to send trace data to Cloud Observability. The chart configures a collector for tracing following general guidelines.
-
Run the following command to deploy a new Collector configured for trace data into the cluster. Or you can change the
tracesCollectortoenabled:trueif you are overriding the chart with a values file.1 2 3 4 5
helm upgrade otel-cloud-stack lightstep/otel-cloud-stack \ -n sn-cloud-obs \ --set tracesCollector.enabled=true \ --set clusterName=your-cluster-name # --set otlpDestinationOverride="ingest.eu.lightstep.com:443" \ # EU data center
Make sure to replace
your-cluster-namewith the name of the cluster you are connected to. -
Next, verify that the Collector configured for tracing has been deployed:
1
 kubectl get services
You should see a new service with the name
otel-cloud-stack-traces-collectorwith ports4317/TCPand8888/TCPopen. -
Configure your OpenTelemetry-instrumented applications running in the cluster to export traces to an OTLP/gRPC endpoint
otel-cloud-stack-traces-collector:4317. More information is available on how to instrument applications in the Quickstart: Instrumentation documentation or follow the instructions below to deploy the demo application.
The Operator, for languages like Java, .NET, Node, and Python, supports auto-instrumenting code running in clusters. This lets you deploy SDKs automatically without any code changes. More details are available in the OpenTelemetry Community Docs.
Send data from the OpenTelemetry Demo
If you don’t have existing services that are instrumented, you can deploy a demo microservice environment to your cluster in order to see data. This demo is maintained by the OpenTelemetry Community and uses the collectors and configuration you deployed with the otel-cloud-stack Helm chart.
Before proceeding, we recommend creating a separate sandbox or development project for testing with non-production data.
If you create a new project, you will need to update the access token value you set in previous steps.
-
Create a new
values.yamlwith the following content. This configures the OpenTelemetry Demo Helm chart to send metrics and traces to the collectors deployed by theotel-cloud-stackchart:1 2 3 4 5 6 7 8 9 10 11 12 13 14 15 16 17 18 19 20 21 22 23
opentelemetry-collector: config: exporters: logging: verbosity: normal otlp/traces: endpoint: otel-cloud-stack-traces-collector:4317 tls: insecure: true otlp/metrics: endpoint: otel-cloud-stack-daemon-collector:4317 tls: insecure: true service: pipelines: metrics: receivers: [otlp] processors: [batch] exporters: [logging, otlp/metrics] traces: receivers: [otlp] processors: [batch] exporters: [logging, otlp/traces]
-
Deploy the demo environment with your
values.yamlfile.1
helm upgrade my-otel-demo open-telemetry/opentelemetry-demo --install -f values.yaml
-
After a few minutes, you should see new services, spans, and metrics in your Cloud Observability project.
Send logs to Cloud Observability
Send Kubernetes Events and pod logs to Cloud Observability
You can also use the Operator to deploy a collector configured to send log data to Cloud Observability. The chart configures a collector for logging following general guidelines and will forward Kubernetes events and pod logs by default.
-
Run the following command to deploy a new Collector configured for logging data into the cluster.
1
2
3
4
5
6
 helm upgrade otel-cloud-stack lightstep/otel-cloud-stack \
   -n sn-cloud-obs \
   --set logsCollector.enabled=true \
   --set tracesCollector.enabled=true \
   --set clusterName=your-cluster-name
   # --set otlpDestinationOverride="ingest.eu.lightstep.com:443" \ # EU data center
Make sure to replace
your-cluster-namewith the name of the cluster you are connected to. -
Next, verify that the Collector configured for logging has been deployed:
1
 kubectl get services
You should see a new service with the name
otel-cloud-stack-logs-collector. -
After a few minutes, you should see logs in Cloud Observability.
Troubleshooting
The first thing you should do when troubleshooting collector issues is make sure data from your network can reach Cloud Observability. Your firewall or cloud configuration may be preventing a connection.
The default OTLP Exporter from a Collector enables gzip compression and TLS.
Depending on your network configuration, you may need to enable or disable
certain other gRPC features. This
page
contains a complete list of configuration parameters for the Collector gRPC
client.
In the event that you are unable to establish a connection to the Cloud Observability
platform, you can use curl to verify HTTP/2 connectivity to our collectors.
Run the following command, replacing <YOUR_ACCESS_TOKEN> with your project’s
access token:
1
2
curl -D- -XPOST --http2-prior-knowledge -H "lightstep-access-token: <YOUR_ACCESS_TOKEN>" https://ingest.lightstep.com/access-test # US data center
# curl -D- -XPOST --http2-prior-knowledge -H "lightstep-access-token: <YOUR_ACCESS_TOKEN>" https://ingest.eu.lightstep.com/access-test # EU data center
You should see the following output, or something similar:
1
2
3
4
5
6
7
HTTP/2 200
content-length: 2
content-type: text/plain
date: Thu, 09 May 2024 15:39:14 GMT
server: envoy

OK
If you do not see this output, or the request hangs, then something is blocking HTTP2 traffic from transiting your network to ours.
If you see HTTP/2 401, your request succeeded, but your token was not accepted.
Some things to check:
- Validity of your access token.
- Ensure proxies are passing through the
lightstep-access-tokenheader.
Alternatively, to exercise the full gRPC request/response cycle, you can try emitting a single span to your project using the otel-cli tool. Refer to this example image and commands for running the CLI tool in Kubernetes and Docker on GitHub. Only send test spans to a non-production project.
For additional troubleshooting recommendations, see Troubleshooting Missing Data in Cloud Observability.
See also
Use the OpenTelemetry Collector
Quickstart Kubernetes: Collector and Operator
Updated Jun 6, 2025