
View and search logs to monitor performance and troubleshoot issues.
This page describes Cloud Observability’s logs tab. You can also explore logs with Cloud Observability’s Unified Query Builder and Unified Query Language.
As of March 12, 2024, all non-logging customers have trial access to Cloud Observability logs. Use trial access to explore logging before committing to a full subscription. To get full access, contact Customer Success.
Access the logs tab
To access the logs tab, go to Cloud Observability and select Logs in the sidebar.
You can also access the logs tab from many charts in alerts, dashboards, and notebooks. To open the tab and view logs from your chart’s time range, select data in the chart and select Search logs.
Select time ranges
Use the time picker
By default, Cloud Observability shows data from the past 60 minutes. To change the time range, select the time-picker drop-down and:
- Set relative time ranges in minutes, hours, days, or weeks.
-
Enter custom time ranges.
The time picker saves custom time ranges and shows them under Recently used.
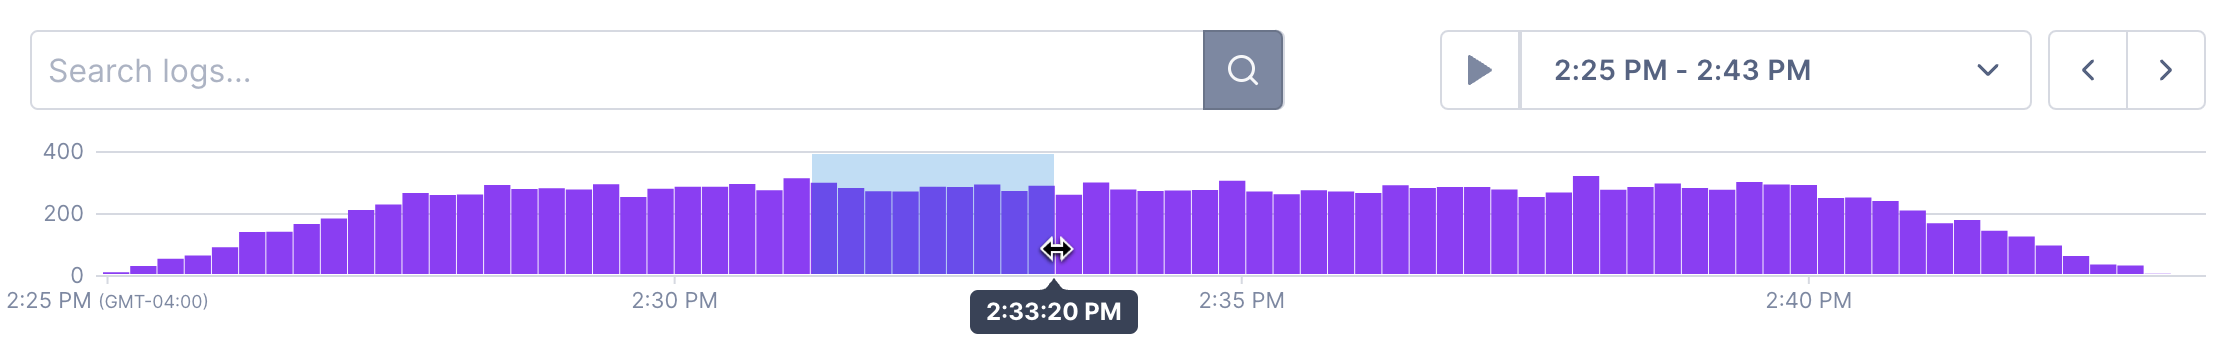
You can also select the < > controls next to the drop-down to move back and forward in time.
The image below shows how to drag across the logs chart to select a time range. To see the number of logs in a bar, point to that bar.
View live logs
Live tail auto-refreshes the logs tab with incoming logs. Use it to view and troubleshoot logs in near real time.
To use Live tail, select Play next to the time picker. To stop live tailing logs, select Pause.
Search logs
Search body attributes
Search for words, phrases, and numbers in the body attribute.
Cloud Observability tokenizes the body attribute to improve search performance and help you find information.
To search the body attribute in the logs tab, enter a word, phrase, or number in the search box.
Combine several search terms with OR (||) or AND (&&).
body searches rely on UQL’s phrase_match logic, but the syntax is different for ease of use.
For example, instead of entering filter phrase_match(body, "cosmo") in the logs tab, enter cosmo.
The examples below work with these sample logs:
1
2
3
body: cosmo the cat, user: galaxy
body: spacecat/cosmology, user: star
body: spacecat, user: cosmos
Basic search i
Find logs where cosmo appears in the body attribute.
This search returns the first two sample logs.
The search only covers the body attribute, so the log with user: cosmos isn’t in the results.
1
cosmo
Basic search ii
Find logs where cosmo the appears in the body attribute.
This search returns only the first sample log.
1
"cosmo the"
Combine searches with OR
Find logs where cosmo or spacecat appears in the body attribute.
This search returns all three sample logs.
1
cosmo || spacecat
Combine searches with AND
Find logs where cosmo and spacecat appear in the body attribute.
This search only returns the second sample log.
1
cosmo && spacecat
No results example
Find logs where star appears in the body attribute.
This search returns no results because star is only in the user attribute.
star never appears in the body attribute.
1
star
Filter other attributes
Explore and filter log attributes other than the body attribute.
Cloud Observability displays log attributes other than body in the sidebar.
To search those attributes, add filters to the search box using comparison operators (==, !=, <, <=, >, >=)
or regular expressions (=~, !~).
Combine several filters with OR (||) or AND (&&).
The examples below work with these sample logs:
1
2
3
body: cosmo the cat, user: galaxy, hostname: abc-light-years
body: spacecat/cosmology, user: star, hostname: def-ship
body: spacecat, user: cosmos, hostname: abc-light-years
Basic filter i
Find logs where the hostname attribute equals abc-light-years.
This filter returns the first and last sample logs.
1
hostname==abc-light-years
Basic filter ii
Find logs where the hostname attribute doesn’t equal abc-light-years.
This filter returns the second sample log.
1
hostname!=abc-light-years
Regex filter
Find logs where light appears in the hostname attribute.
This filter returns the first and last sample logs.
1
hostname=~".*light.*"
Combine filters with OR and AND
Find logs where the hostname attribute equals abc-light-years or def-ship,
and the user attribute equals star.
This filter returns the second sample log.
1
(hostname==abc-light-years || hostname==def-ship) && user==star
Filter logs and search body
Find logs where the hostname attribute equals abc-light-years or def-ship,
and the body attribute contains cosmo.
This search returns the first two sample logs.
1
(hostname==abc-light-years || hostname==def-ship) && cosmo
You can also use the log tab’s sidebar to do the following:
- Select to filter logs - Point to attribute values and select only or exclude to add filters to the search box.
- Sort attribute values - Select Sort to organize attribute values by frequency, rarity, or name.
- Pin attributes - Select the pin icon to move the attribute to the top of the sidebar and keep it there.
Export and share searches
Build on search results in other Cloud Observability features and collaborate with team members.
In the logs tab, select the export icon to view these options:
-
Add searches to Cloud Observability notebooks or dashboards. Notebooks help you explore and investigate logs alongside metrics and traces. And dashboards help you monitor specific logs alongside metrics and traces.
Log searches use a condensed Unified Query Language (UQL) syntax. When you add log searches to notebooks or dashboards, Cloud Observability converts searches into full UQL queries. The conversion helps you integrate and further explore logs in notebooks and dashboards.
-
Copy the UQL version of your search to use it in other Cloud Observability features. For example, select Copy raw query to convert
cosmo && service.name==galaxyinto this UQL query:1
logs | filter (phrase_match(body, "cosmo") && ("service.name" == "galaxy")) -
Copy a link to your search and search results and share it with your team members. Cloud Observability preserves the time range you selected.
-
For offline analysis or reporting, export your search results to a CSV file. Cloud Observability only exports the most recent 1,500 logs associated with your search.
Save and favorite
Save and favorite queries to easily access your most-used queries.
Follow these steps to save and favorite a query:
- In Cloud Observability, select Logs.
- Enter a query in the search box.
For example,
error==true && meteor. - Select the star icon and enter a name for your query.
-
Select Save to save your query and return to the logs tab.
Cloud Observability displays Query saved, and your query appears in the logs sidebar under Queries > My starred queries. Note that Cloud Observability only saves the query’s syntax, not the original search’s time range.
If you save a query that’s already saved, Cloud Observability adds the existing saved query to My starred queries. If you rename the query, Cloud Observability renames the original saved query. That behavior prevents Cloud Observability from creating duplicate saved queries in one project.
To view and work with saved queries, select Queries in the logs tab sidebar. The Queries tab displays the following:
- My starred: Favorited queries.
- Created by me: Queries you’ve saved.
- Recently viewed: Queries you’ve recently run in the logs tab.
- All other queries: Queries saved by other project users.
Here are some actions you can take in Queries:
- Select a query to put it in the log tab’s search box.
- Point to a query to see who last edited it and when.
-
Select ⋮ to edit, copy, or delete queries.
Copy copies the full UQL query to use in alerts, dashboards, and notebooks.
Get log and trace details
Cloud Observability has several features to help you further explore logs:
| Feature | What it is | How to use it |
|---|---|---|
| Log viewer | Log viewer shows a log’s attributes in JSON and tabular format. Use it to get more details about a log. | Select any log to open the Log viewer. |
| Open linked trace | Open linked trace shows how a log fits into Cloud Observability’s Trace view. Use Open linked trace to explore and resolve issues by connecting logs to traces. Open linked trace only works for logs configured with a span ID. |
Select any log to open the Log viewer. Then select Open linked trace to open Cloud Observability’s Trace view in a new tab. |
| See in context | See in context shows logs with timestamps up to five minutes before the selected log. Use it to explore and troubleshoot issues. | Select any log to open the Log viewer. Then select See in context to see related logs in a new tab. |
See also
Updated May 22, 2024