
Developer mode only accepts span data. Metrics and logs aren’t supported.
Developer Mode isn’t supported for organizations hosted in the EU data center.
It can be hard to implement tracing while you’re implementing a service. You don’t want to have to deploy and then search through traces to find how your changes may have affected performance.
Developer Mode allows you to run a Satellite locally to view traces generated from your instrumented code as you write it. Reliable feedback helps build confidence that your code is correct, by quickly verifying your instrumentation using a console-like output.
Developer Mode has two parts: a Developer Satellite that runs locally on your laptop and a UI for displaying a live stream of events. Configure your tracer to send to localhost and see your traces live every time you execute code. It’s an easy way to get feedback on your traces as you develop.
Use Developer Mode when you want to:
- See traces in real time, while you code services
- Test and debug instrumentation of services
- Triage and fix broken context and tracing bugs
- Experiment with tracing and run tutorials
To use Developer Mode, you need to start your Developer Satellite and configure a tracer to work with it. Once you do, you can use Cloud Observability to view traces from your code immediately.
You need to have Docker installed, as the Satellite runs in a Docker container. If you are running on Windows, you need to install a Windows Subsystem for Linux and configure it to work with Docker.
Prerequisites
- Docker. You can download Docker here:
- Windows only:
- Windows 10 version 1803 or later
- Windows Subsystem for Linux (WSL)
These instructions assume Ubuntu.
Windows pre-installation
You need to install and configure the WSL and Docker to work correctly with the Satellite.
No pre-install steps are required for macOS.
-
If this is the first time you’re installing Docker for Windows and the WSL, ensure you’ve rebooted your PC.
-
In the Docker for Windows settings, enable Expose daemon on
tcp://localhost:2375without TLS. -
Open PowerShell, and load the WSL by running
bash. - Run the following commands in your bash prompt:
1
2
3
4
5
6
7
8
9
10
11
12
13
14
15
16
17
18
19
20
21
22
23
24
25
26
27
28
29
30
31
32
33
 # Update the apt package list.
 sudo apt-get update -y

 # Install Docker's package dependencies.
 sudo apt-get install -y \
     apt-transport-https \
     ca-certificates \
     curl \
     software-properties-common

 # Download and add Docker's official public PGP key.
 curl -fsSL https://download.docker.com/linux/ubuntu/gpg | sudo apt-key add -

 # Verify the fingerprint.
 sudo apt-key fingerprint 0EBFCD88

 # Add the `stable` channel's Docker upstream repository.
 #
 # If you want to live on the edge, you can change "stable" below to "test" or
 # "nightly". I highly recommend sticking with stable!
 sudo add-apt-repository \
     "deb [arch=amd64] https://download.docker.com/linux/ubuntu \
     $(lsb_release -cs) \
     stable"

 # Update the apt package list (for the new apt repo).
 sudo apt-get update -y

 # Install the latest version of Docker CE.
 sudo apt-get install -y docker-ce

 # Allow your user to access the Docker CLI without needing root access.
 sudo usermod -aG docker $USER
-
Close and re-open your PowerShell window, and re-run
bash. - Execute the following command:
echo "export DOCKER_HOST=tcp://localhost:2375" >> ~/.bashrc && source ~/.bashrcThis points the docker client to the docker daemon running in Windows.
Start the Developer Satellite
You need to start your local Satellite and then configure a language-specific tracer to work with your code to report to your Satellite.
-
In Cloud Observability, click the Developer Mode button in the Navigation bar.
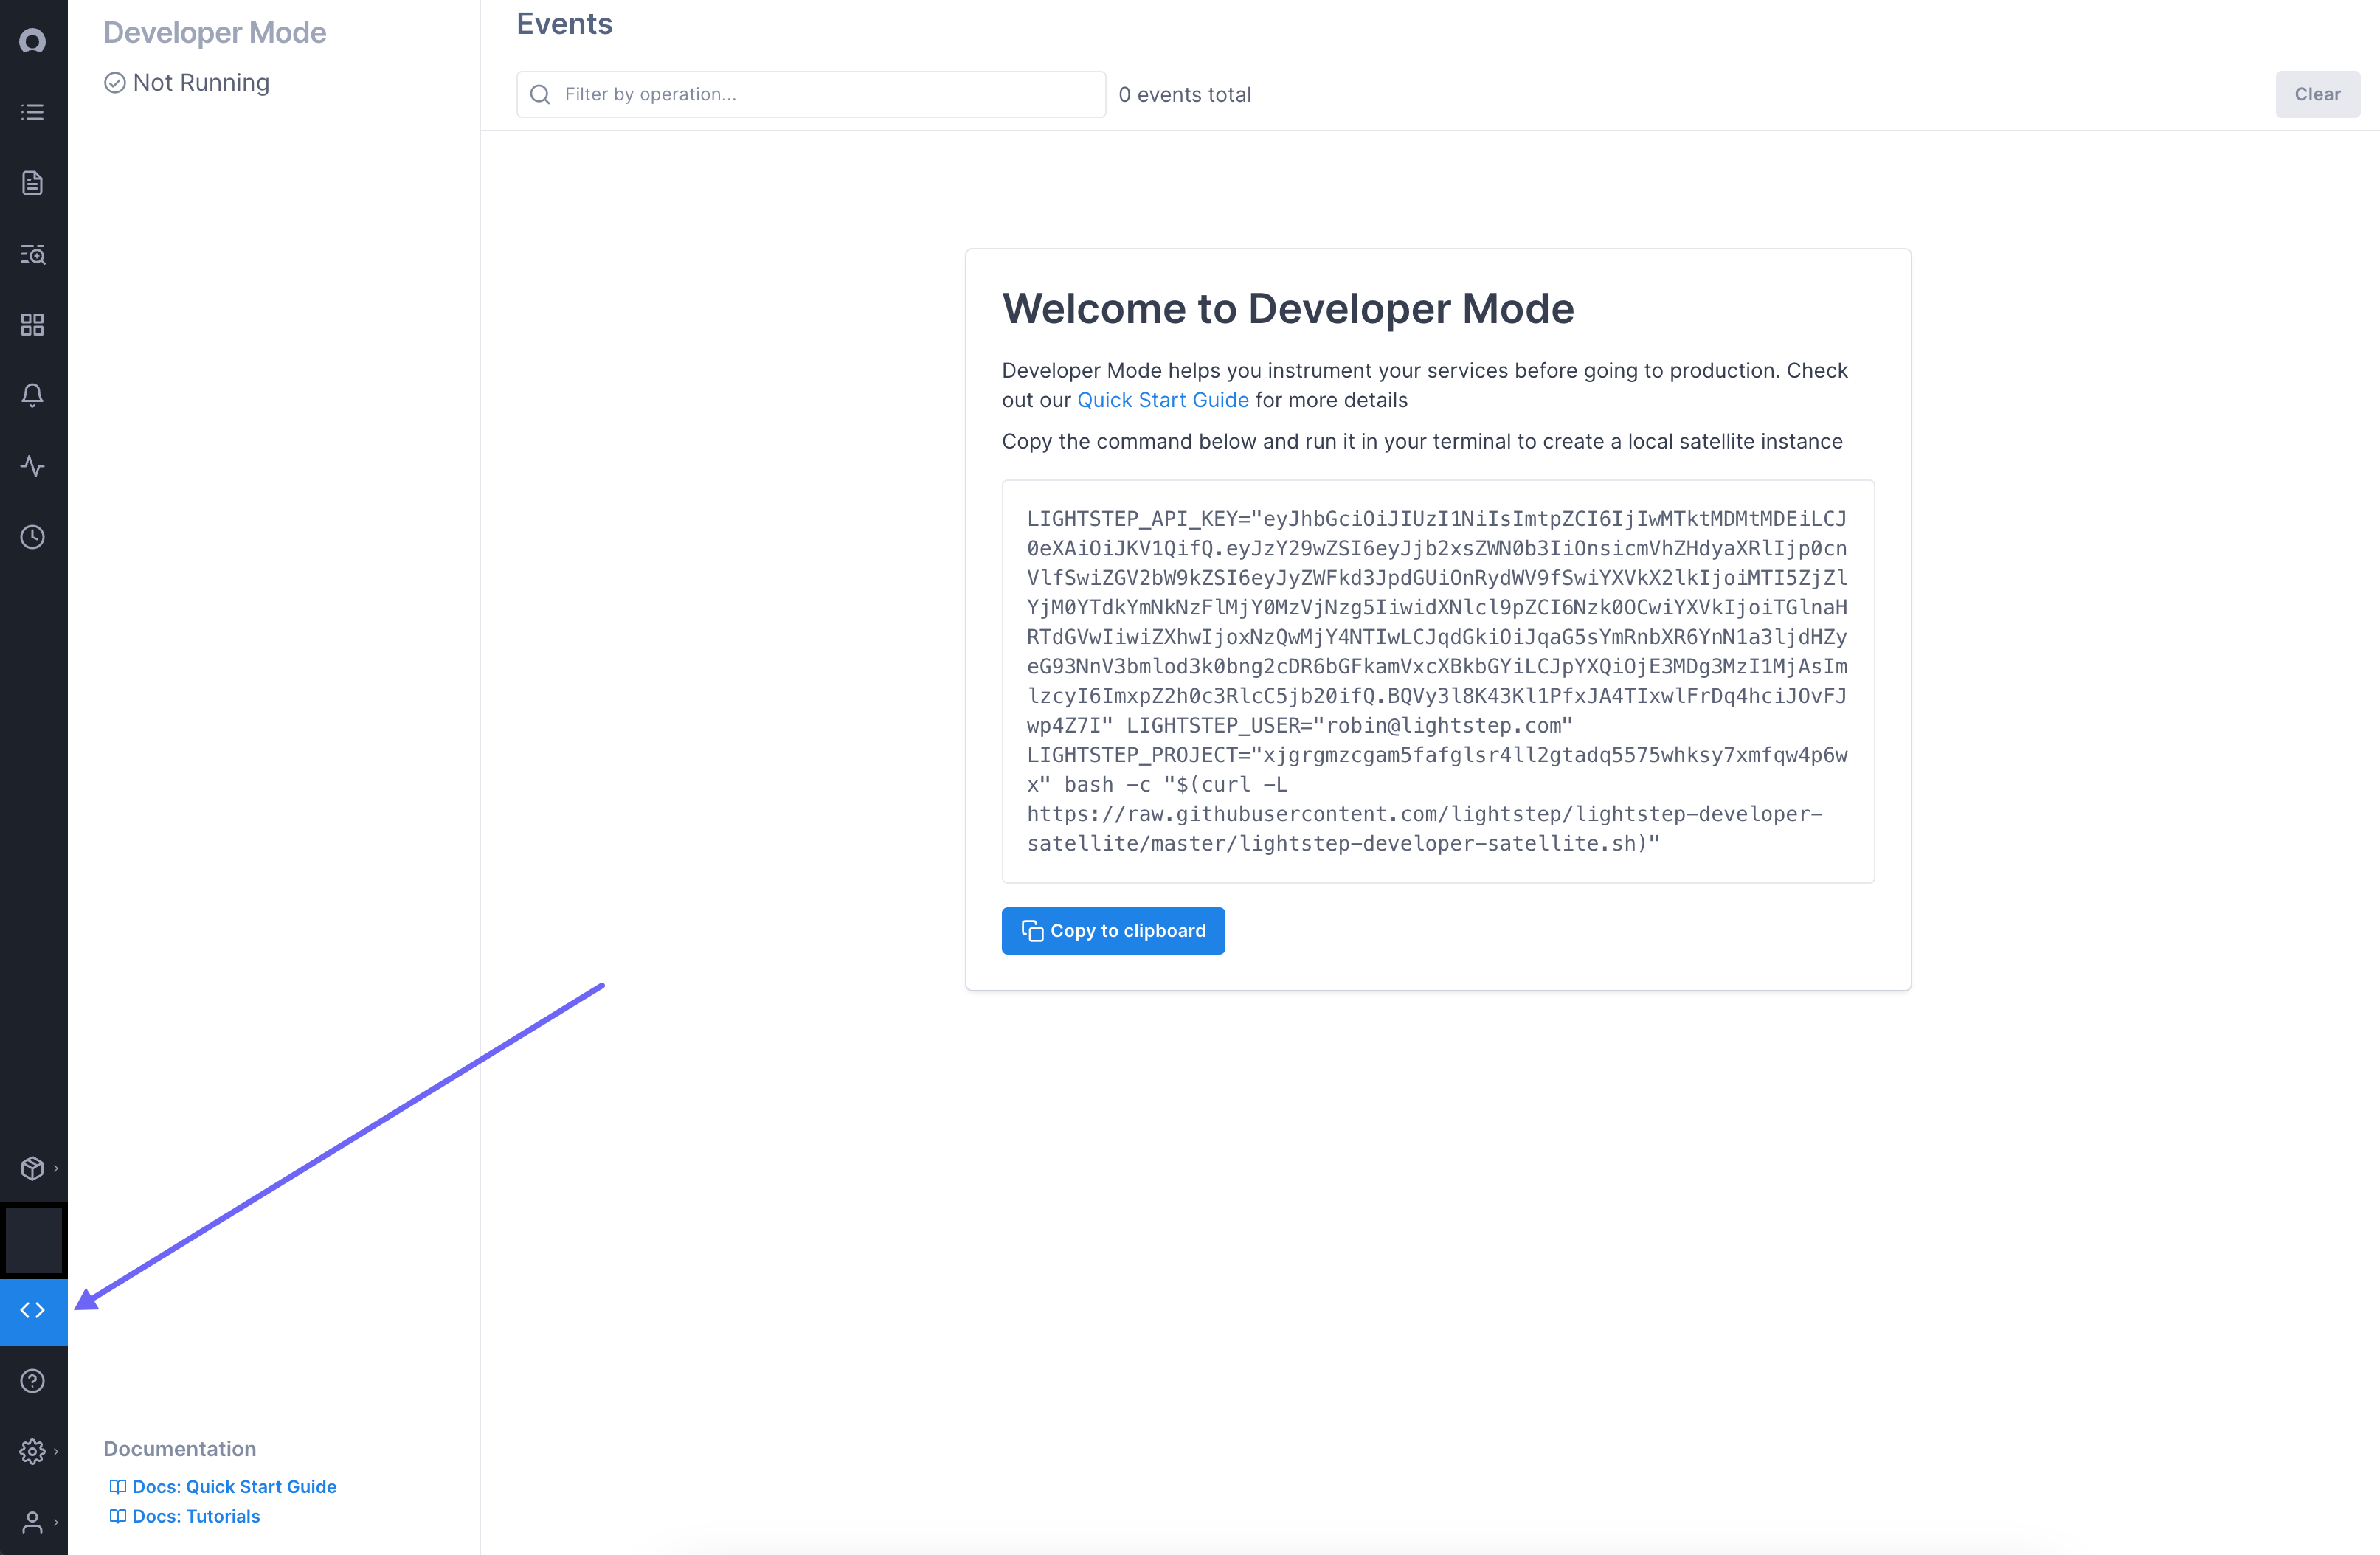
An API key, a project ID, and a link to a script to configure the Satellite are shown.
-
Click Copy to Clipboard.
-
Open the Terminal, paste, and run the code. The Satellite is installed and started. Cloud Observability automatically creates a developer project for you named
lightstep-dev-<generated ID>, for example,lightstep-dev-db633a2dand your Developer Satellite is configured to work with this project.Cloud Observability automatically refreshes to show that the Satellite is connected.
If your Satellite doesn’t connect, check out the Troubleshoot Developer Mode topic.
You can learn how to start, stop, and manage your Developer Satellite here.
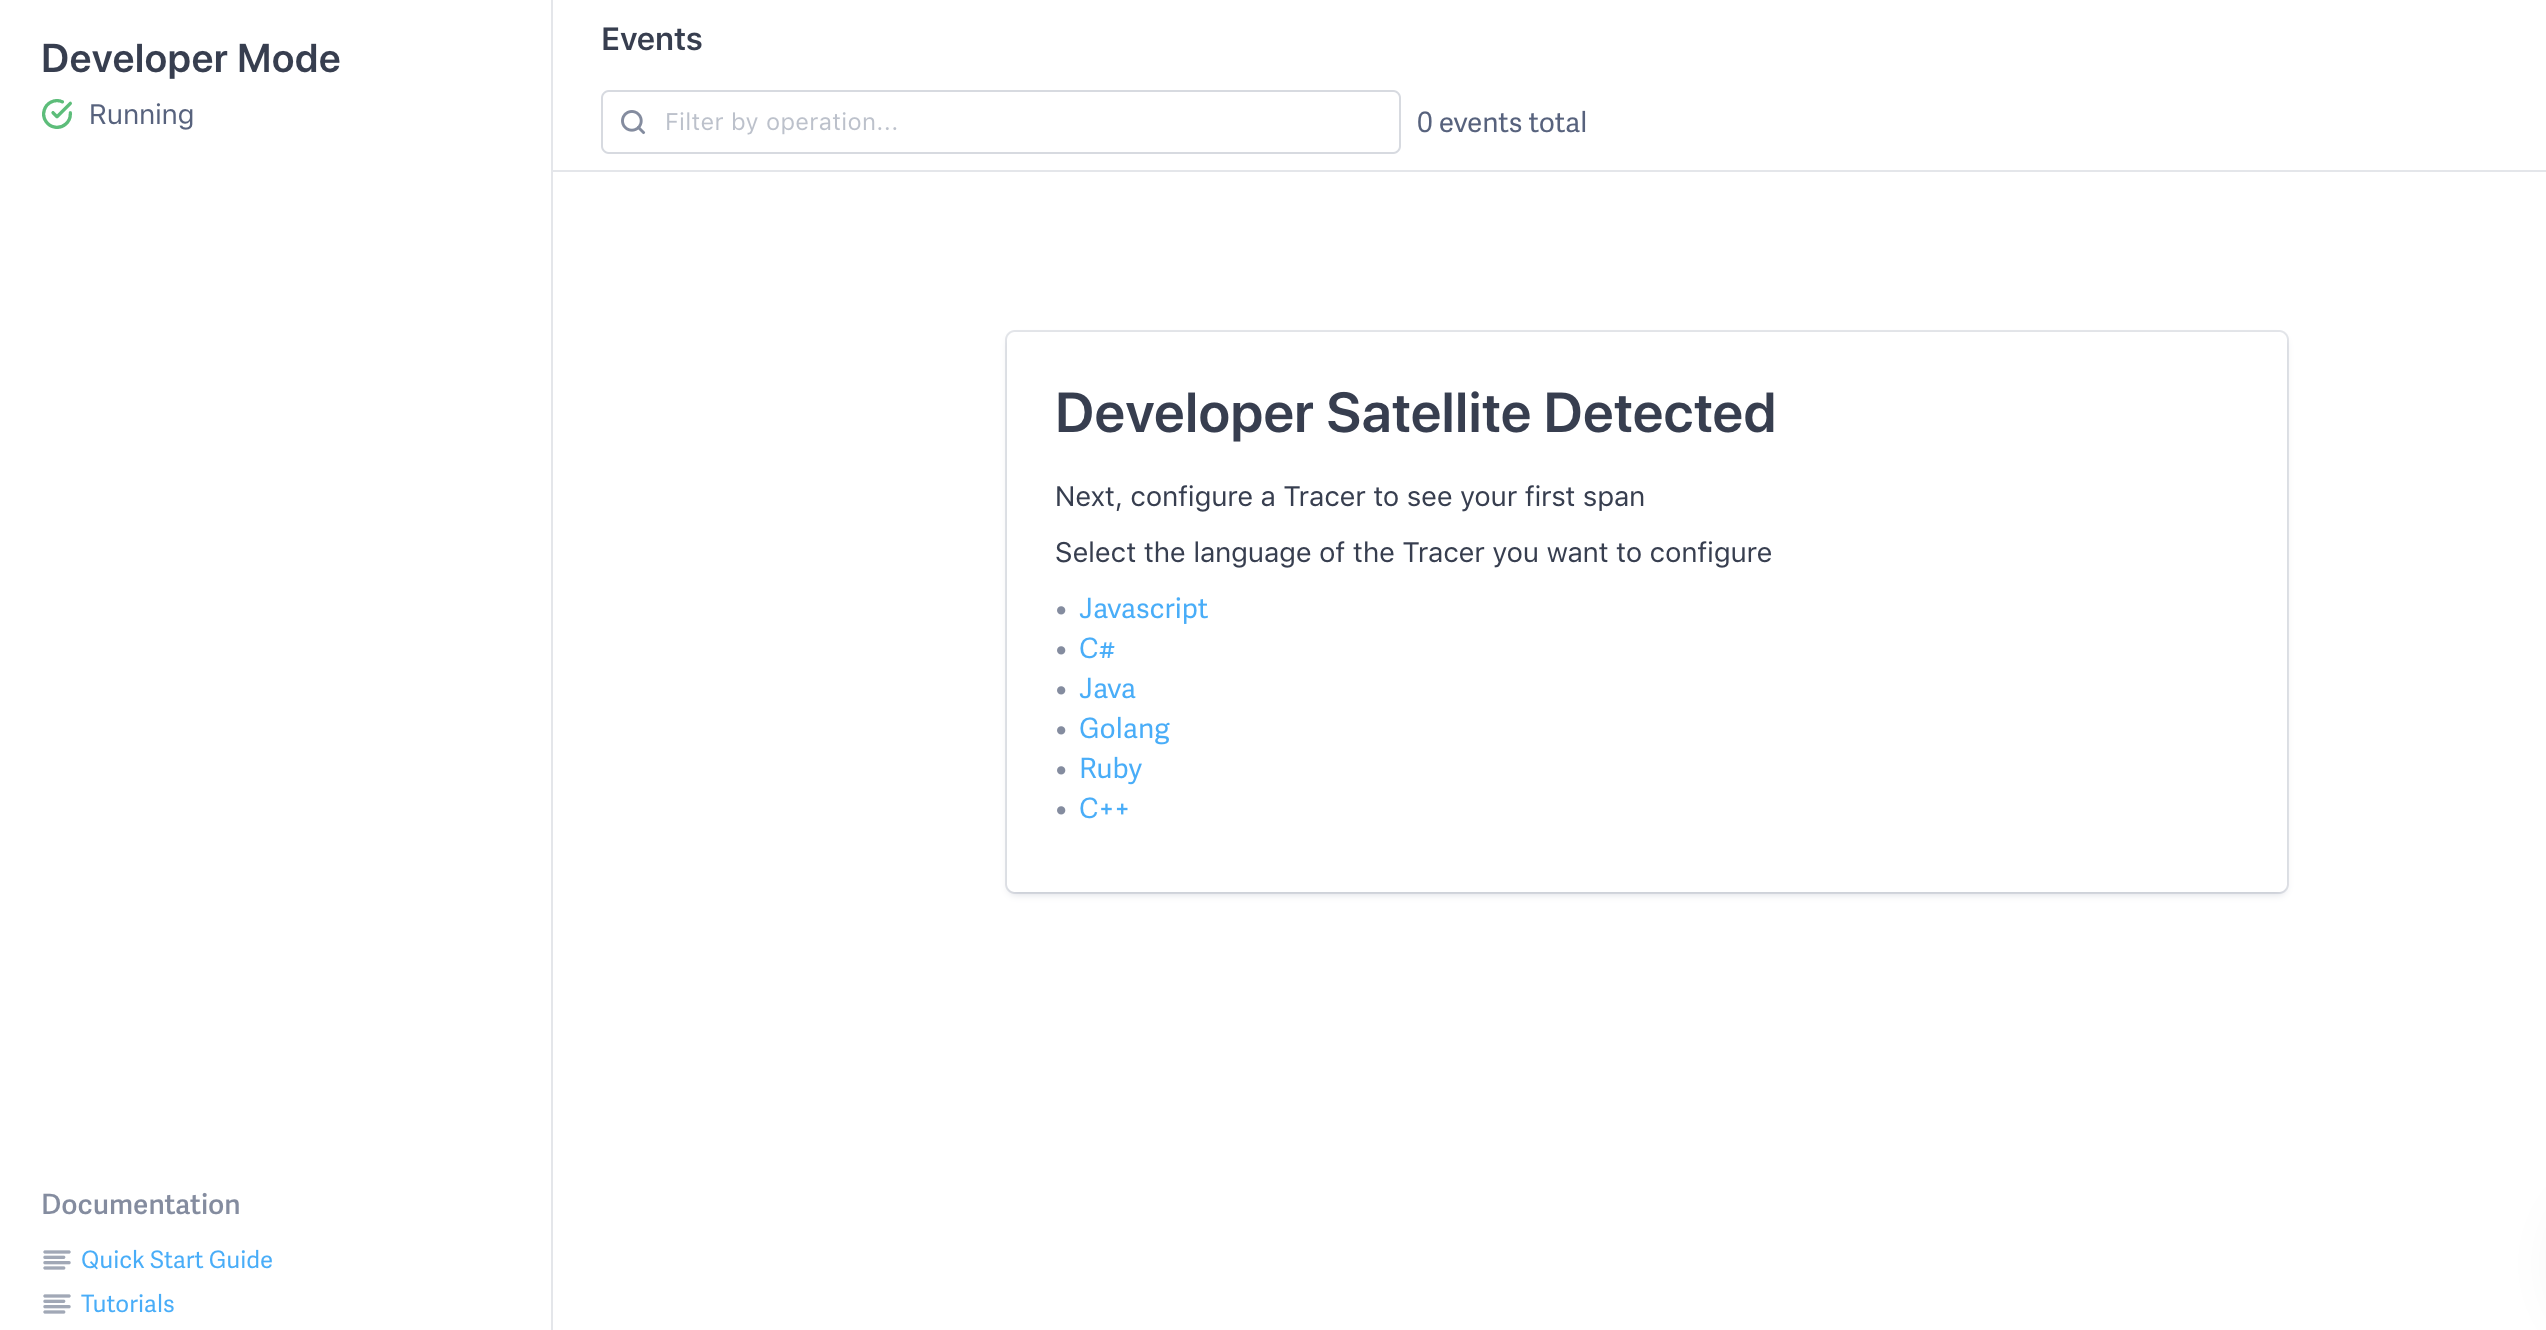
Configure your tracer
You need a tracer to collect data from your operations. Follow the instructions in Quickstart: Instrumentation, but be sure to use these Developer Satellite-specific configurations:
1
2
3
4
host: localhost
port: 8360
access_token: developer
appcontext: Http2UnencryptedSupport = true.
Here’s an example (access_token is set at the container level):
1
2
3
4
5
6
7
8
9
10
11
12
13
14
15
16
17
18
19
20
21
22
23
24
25
26
using System;
using System.Diagnostics;
using OpenTelemetry;
using OpenTelemetry.Resources;
using OpenTelemetry.Trace;
namespace nettest414
{
    class Program
    {
        static void Main(string[] args)
        {
            AppContext.SetSwitch("System.Net.Http.SocketsHttpHandler.Http2UnencryptedSupport", true);
            using var otel = Sdk.CreateTracerProviderBuilder()
                .AddSource("test")
                .SetResourceBuilder(ResourceBuilder.CreateDefault().AddService("test"))
                .AddOtlpExporter(opt => opt.Endpoint = new Uri("http://localhost:8360"))
                .Build();
            using (var sample = new ActivitySource("test"))
            {
                using var activity = sample.StartActivity("test");
                activity.AddTag("foo", "bar");
            }
            Console.WriteLine("Hello World!");
        }
    }
}
You’re all set to use Developer Mode!
Use Developer Mode
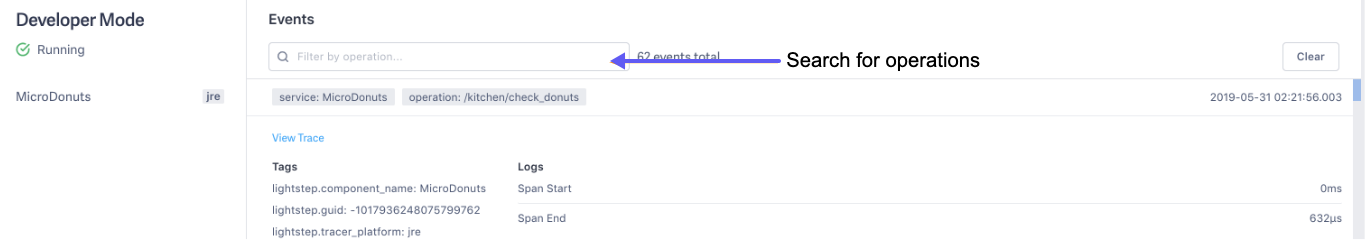
Once you run an instrumented app reporting to Developer Mode, you’ll see a list of services in the left pane. Click on a service to see the spans reported by that service, along with information for each individual span such as the associated attributes (including the attributes added by OpenTelemetry) and log information.
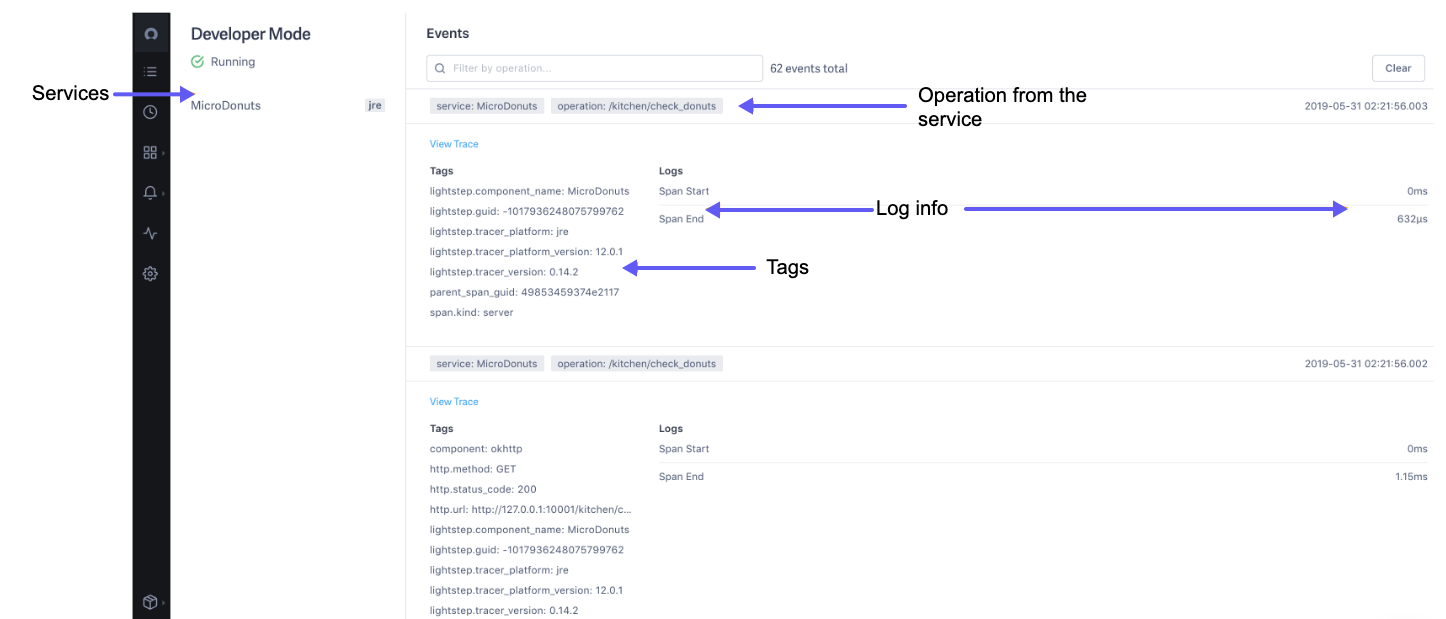
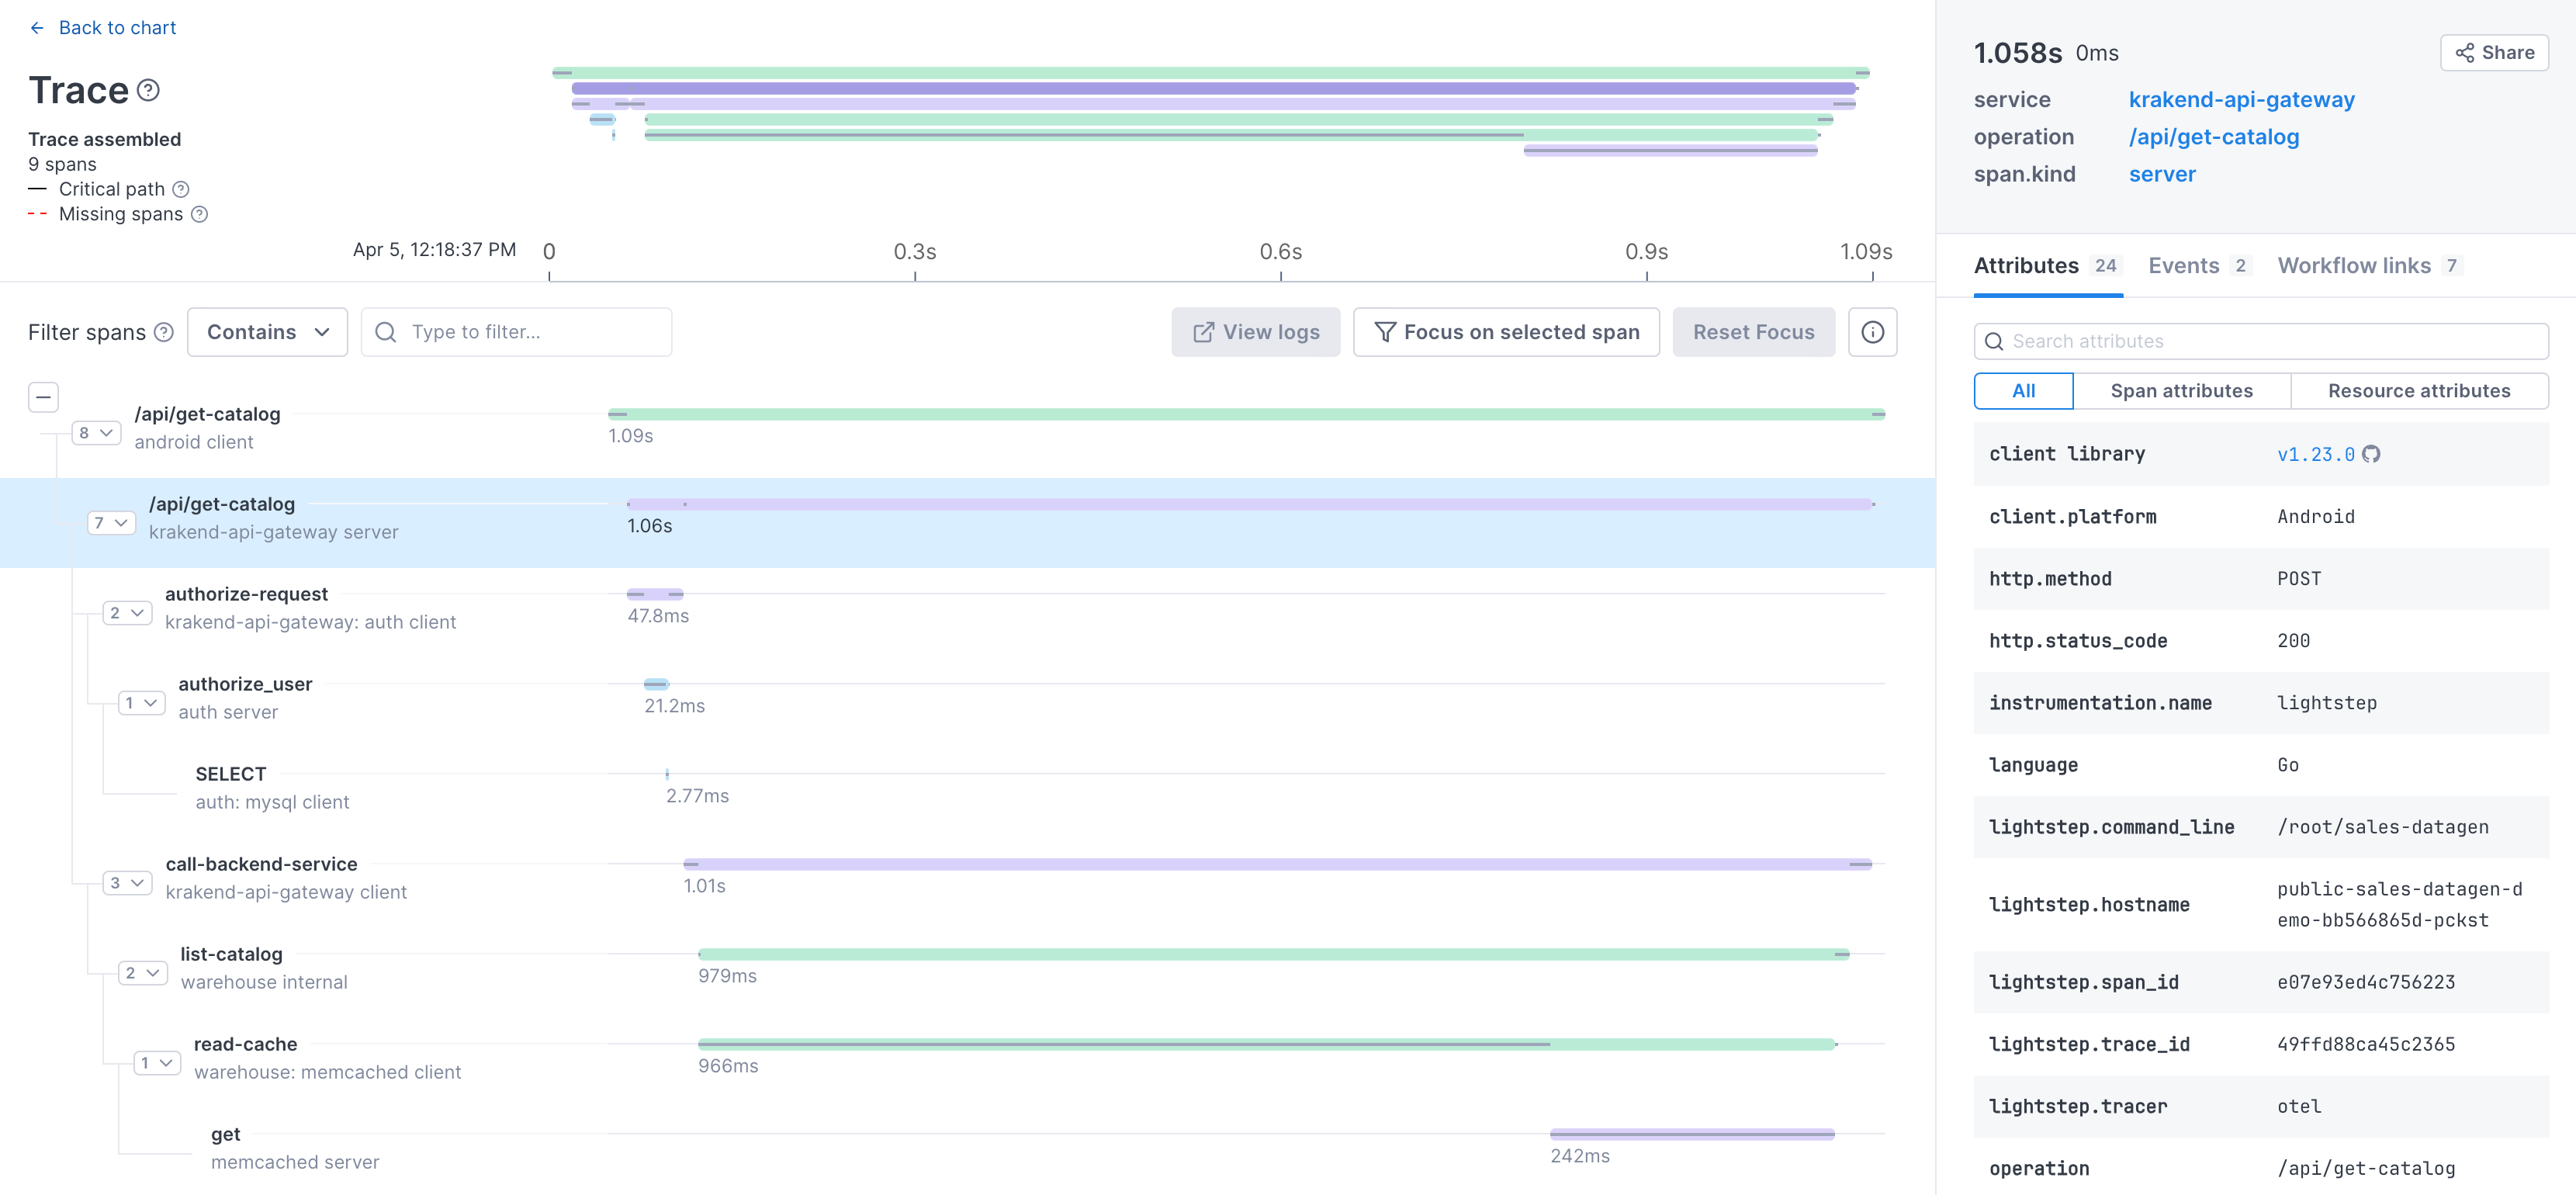
Click View Trace to see the spans included in the trace.
You can search for operations in the event stream using the search bar at the top.
You can share the URL for a Developer Mode trace with other users in your organization. Just copy the URL from your browser, and they’ll see the same trace that you see.
Remember when using Developer Mode:
-
Developer Mode is intended to facilitate initial local instrumentation setup by isolating your local development using a console-like view.
-
Cloud Observability only displays data from the Developer Satellite in the Developer Mode window. Other windows like Explorer and Service Directory will not display traces from your local environment.
Updated Jun 14, 2021