
We will be introducing new workflows to replace the tri-chart and its alerting features. As a result, they will soon no longer be supported. Instead, use unified dashboards and alerts.
About Stream alerts
You create alerts on your Stream data by configuring thresholds on Streams that when crossed, trigger an alert. You can configure thresholds based on latency, error rate, or operation rate.
This topic is about creating alerts for Streams. You can also create alerts for span data, where you can create complex queries and set multiple thresholds for your alert.
Cloud Observability continually monitors the data sent from the Microsatellites and checks that data against the configured thresholds. Alert messages indicate what threshold has been crossed and include sample traces indicative of the problem.
Using Terraform? You can use the Cloud Observability Terraform provider to create and manage your alerts and destinations. You can also use it to export existing alerts into the Terraform format.
For example, the Android Stream has an alert set for when the error percentage rate is above 5% for longer than 5 minutes. The alert is sent to the #team-android Slack channel every 5 minutes until it’s resolved.
Alert payloads include links to the project and stream and also direct links to traces that violate the alert for quick resolution. Click on a trace link and go to the Explorer view for real-time exploration and to the Service Directory where you can check for latency or error rate changes. 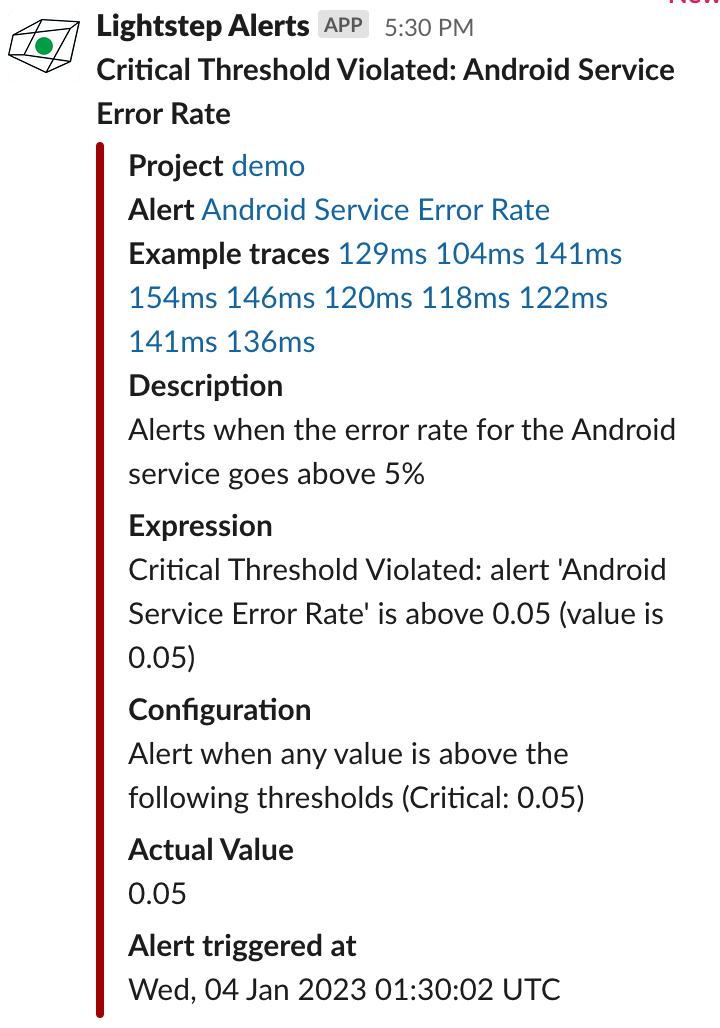
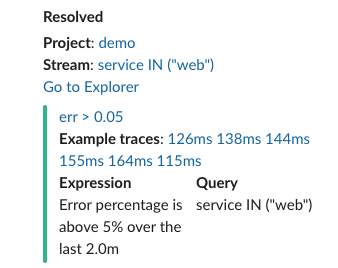
Once the system is below the threshold, Cloud Observability sends an alert saying that the alert is resolved.
All alerts (for both metric, span, and Stream-based) are listed on the Alerts tab of the Alerts view. You can see the status of every alert and you can also delete alerts from here. 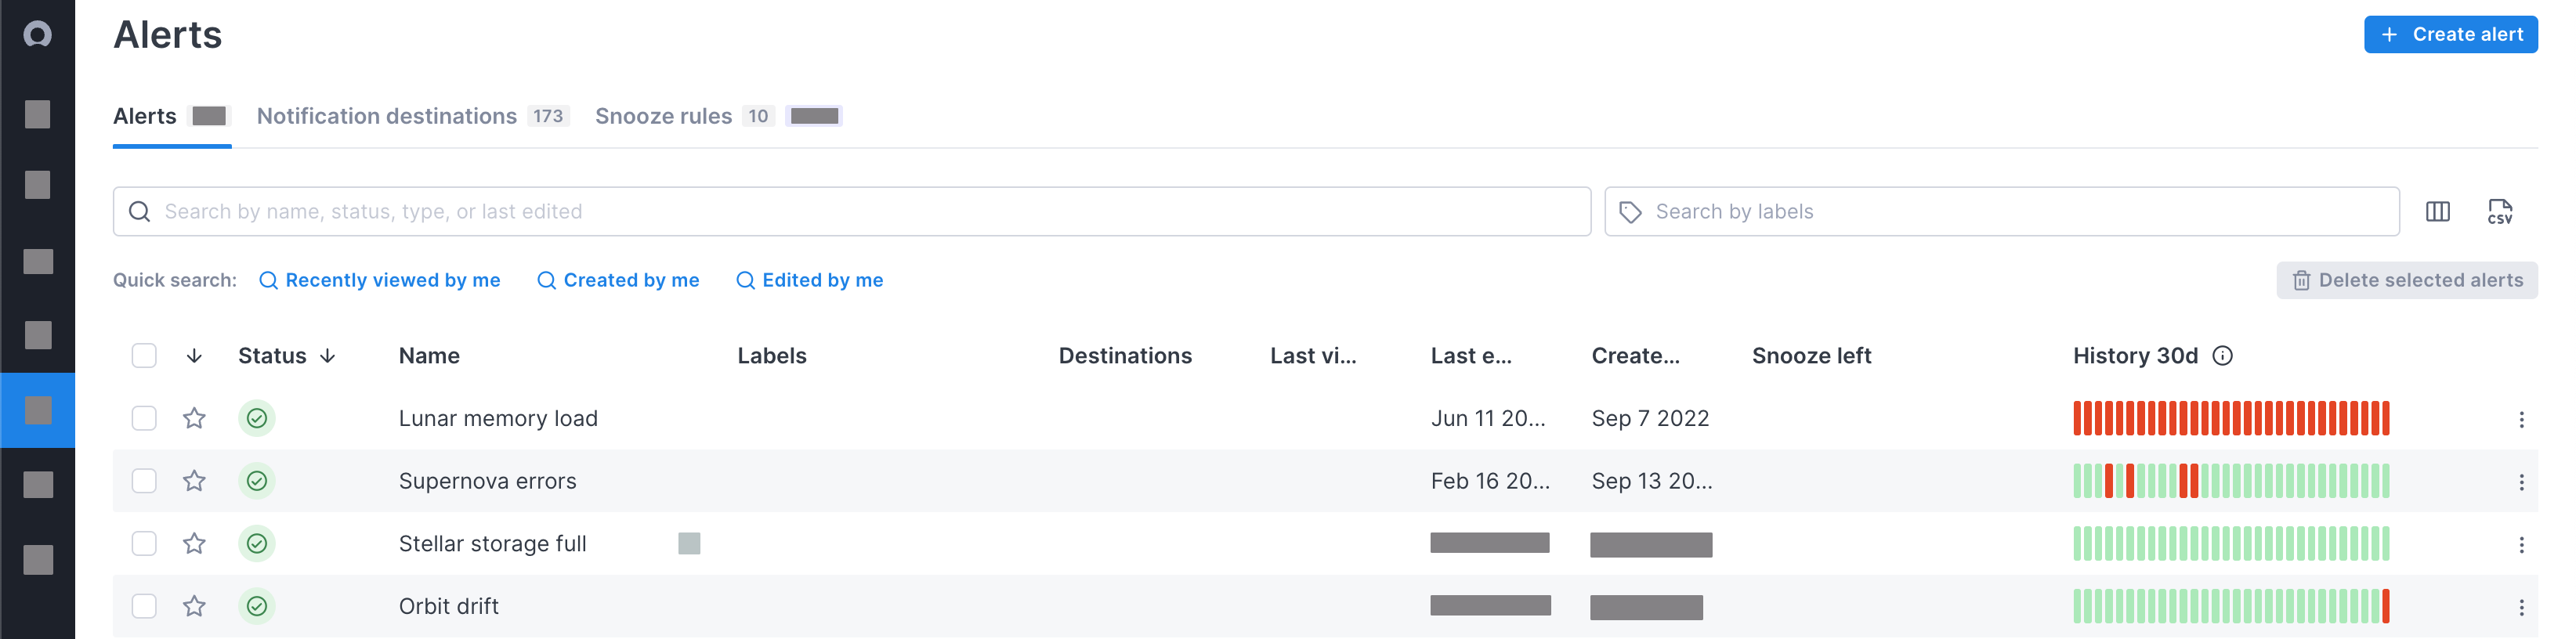
Cloud Observability doesn’t send an alert for Stream-based alerts when no data is reporting.
Create a Stream alert
You create alerts by setting thresholds against error percentile, latency, or operations per second on any Stream, and then adding a notification destination that routes the alert to the right channel.
You can create multiple alerts for a Stream. For example, you might create one alert for a “warning” threshold and another for a “critical” threshold. Or you might want to have different thresholds for multiple percentiles (e.g. the 99th percentile can exceed 100ms, but your 50th percentile should never exceed 50ms).
You can also create and manage alerts using our Public API.
Configure an alert
Once you create an alert, you can leave it without a notification destination and monitor the alert manually from within Cloud Observability, or you can add a destination.
To configure an alert:
-
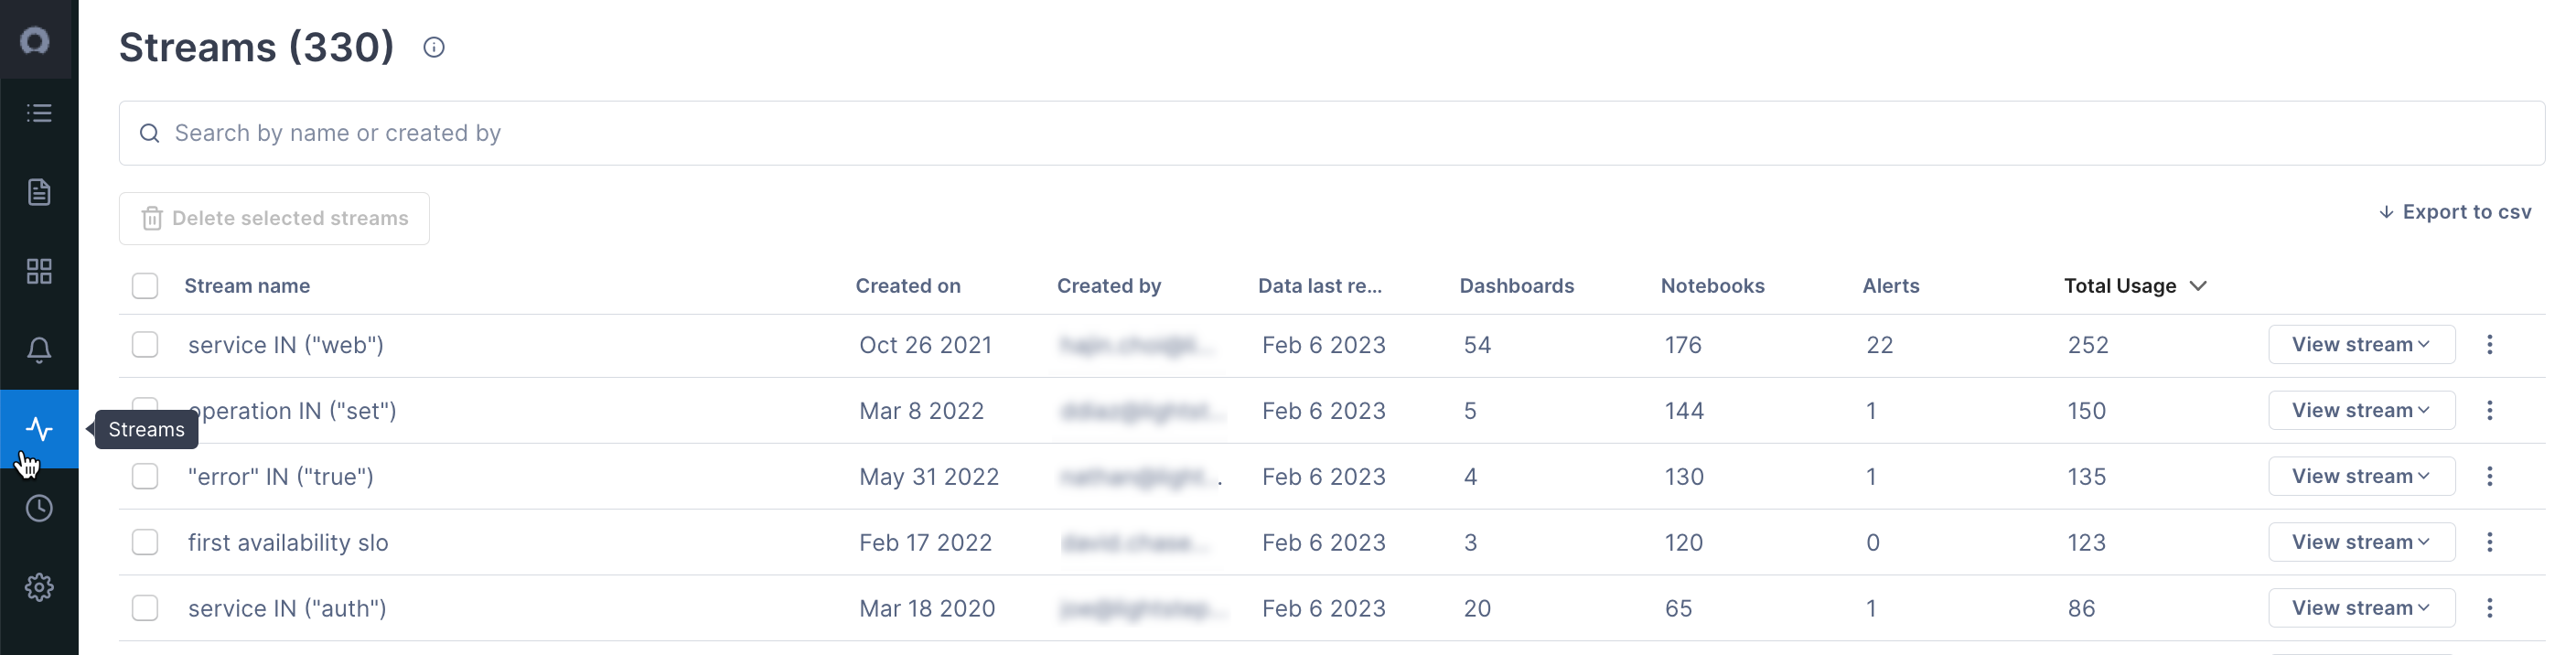
Open a Stream either from Streams in the navigation bar or from a Dashboard.
-
Click Create Alert.
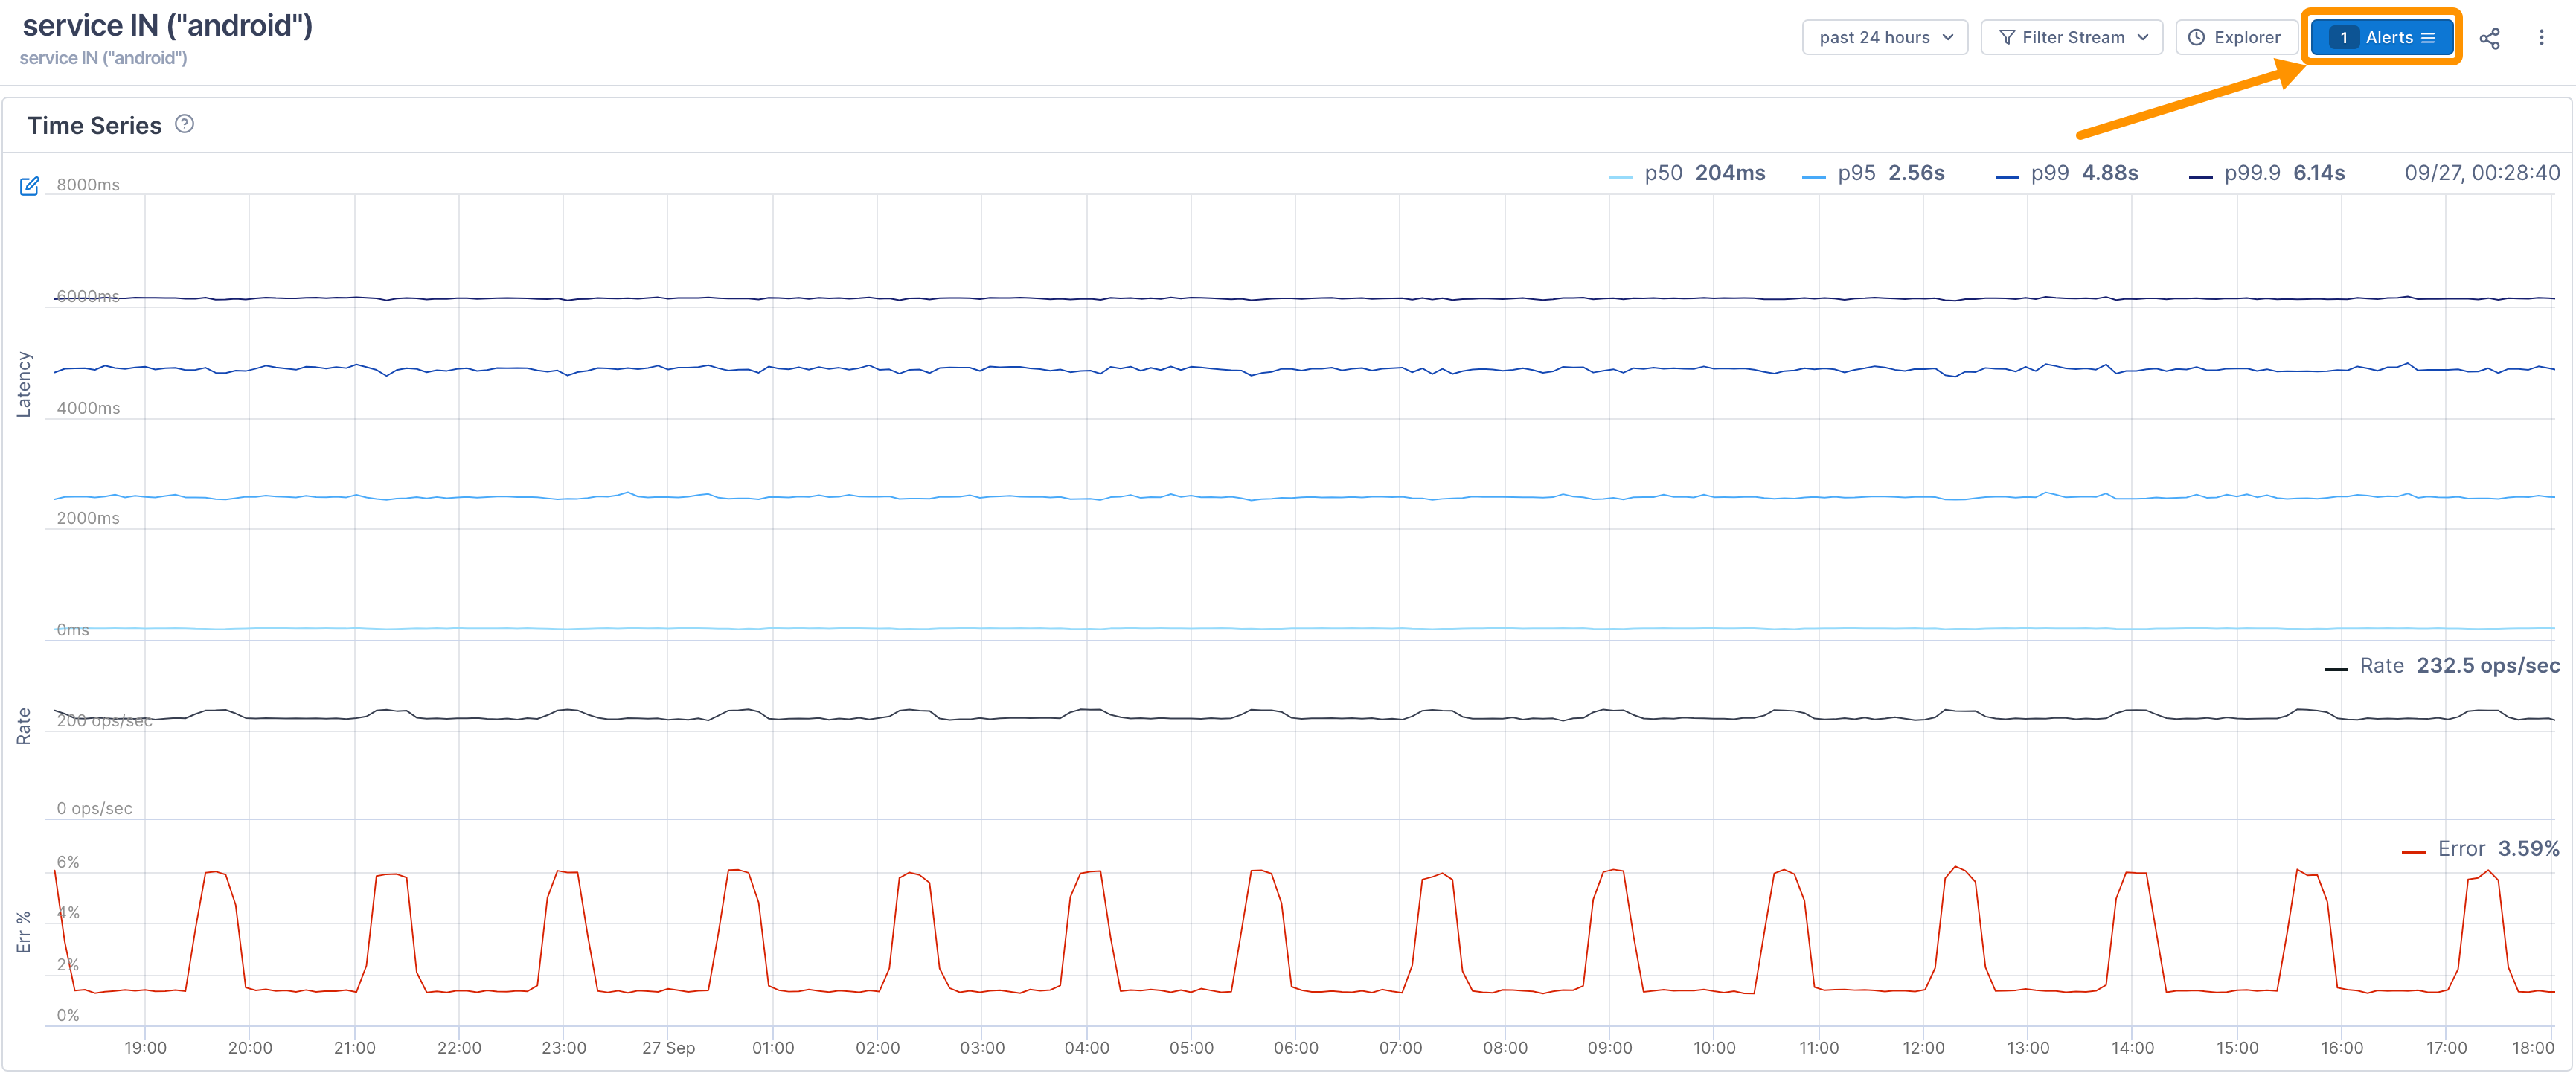
If you already have alerts on this stream, click Alerts to open the panel and click New.
-
Enter the following:
- Signal: Select the metric Cloud Observability should analyze for this alert. Choose from Latency, Operation rate, or Error percentage.
- Name: Enter a name for this alert.
- Threshold: Create a threshold that should trigger the alert. Configuration for the threshold depends on the signal you chose.
- Latency: Cloud Observability analyzes the latency in units of time (m, s, ms, for microseconds put a number < 1ms) for a certain percentile bucket, and determines if the latency during the evaluation window is above or below the threshold.
- Error Percentage: Cloud Observability checks every ingested span for the presence of the OpenTelemetry
errorattribute. The error percentage signal is the percentage of spans in a Stream population that contain an error. Cloud Observability can create an alert if the error percentage is above or below the threshold. - Operation Rate: Cloud Observability collects basic throughput information about Stream operations and determines if the rate is above or below that threshold.
- Evaluation Window: The period of time during which you want Cloud Observability to perform the threshold calculations to determine if an alert should be created. This can be thought of as a moving time frame, trailing the current point in time, during which relative percentages are calculated for signals. Allowed units include: d (days), h (hours), m (minutes). The minimum value is 2 minutes.
Higher values can be useful if you’d like to “smooth” out the data to avoid alerts during brief metric spikes.
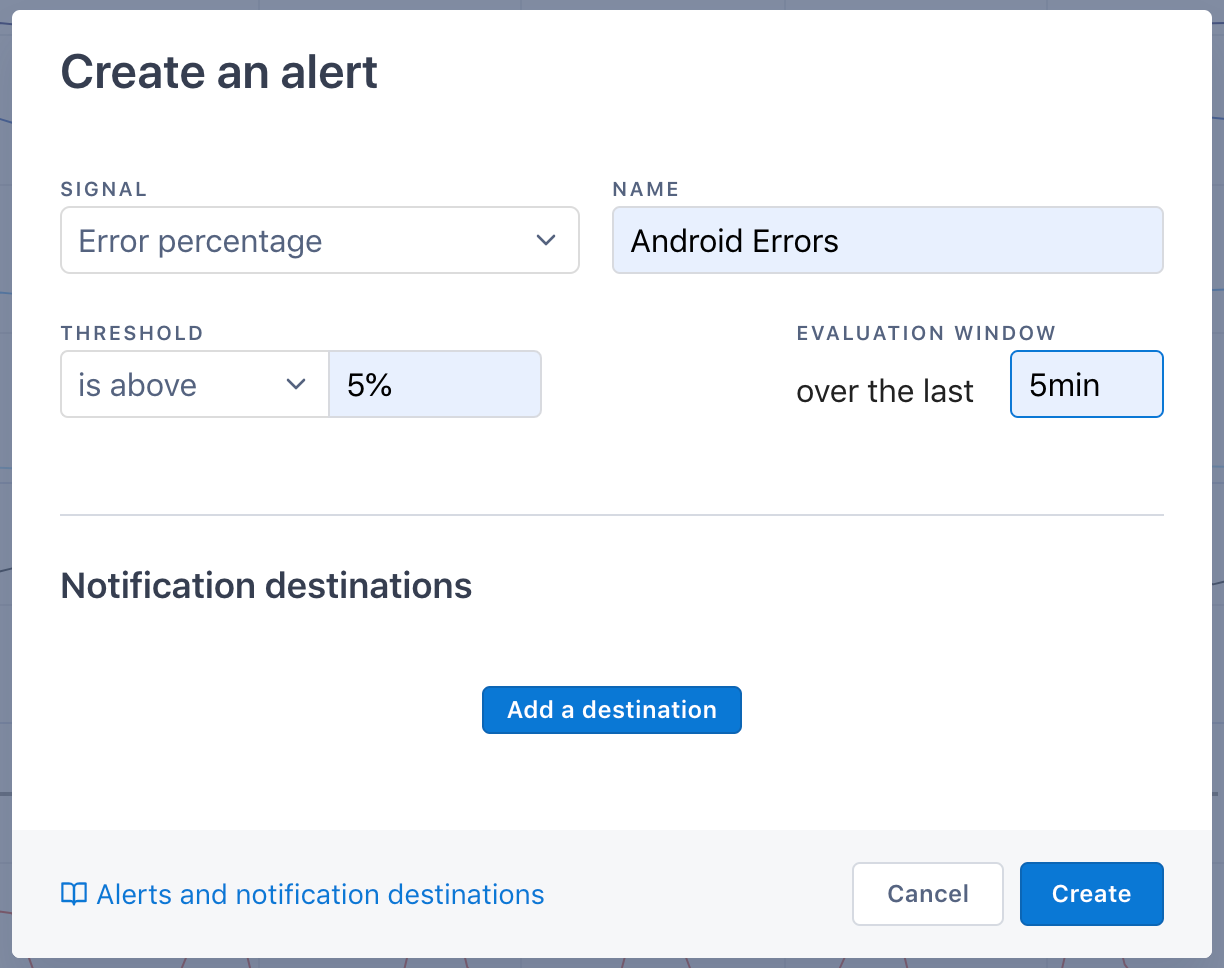
While you can click Create now, alerts won’t happen because you haven’t defined a notification destination.
Add a notification destination
Cloud Observability can send notifications of an alert to many third-party tools.
Destinations must already exist before you can assign them.
- From the Create Alert dialog, click Add Notification Destination.
- Select the following:
- Integration: Select the third-party integration type.
- Destination: Choose the entity that should receive the alert.
- Update Interval: Enter the amount of time before Cloud Observability should send new alert messages to your destination if the threshold breach isn’t resolved (minimum is 2 minutes).
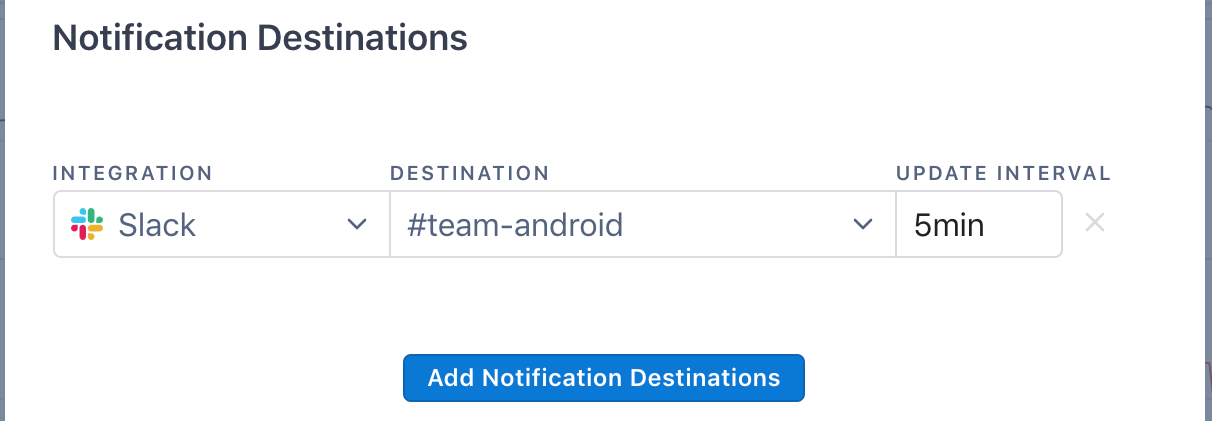
You can add multiple destinations.
You can also add destinations after you’ve created the alert from the Alerts panel on the Stream. 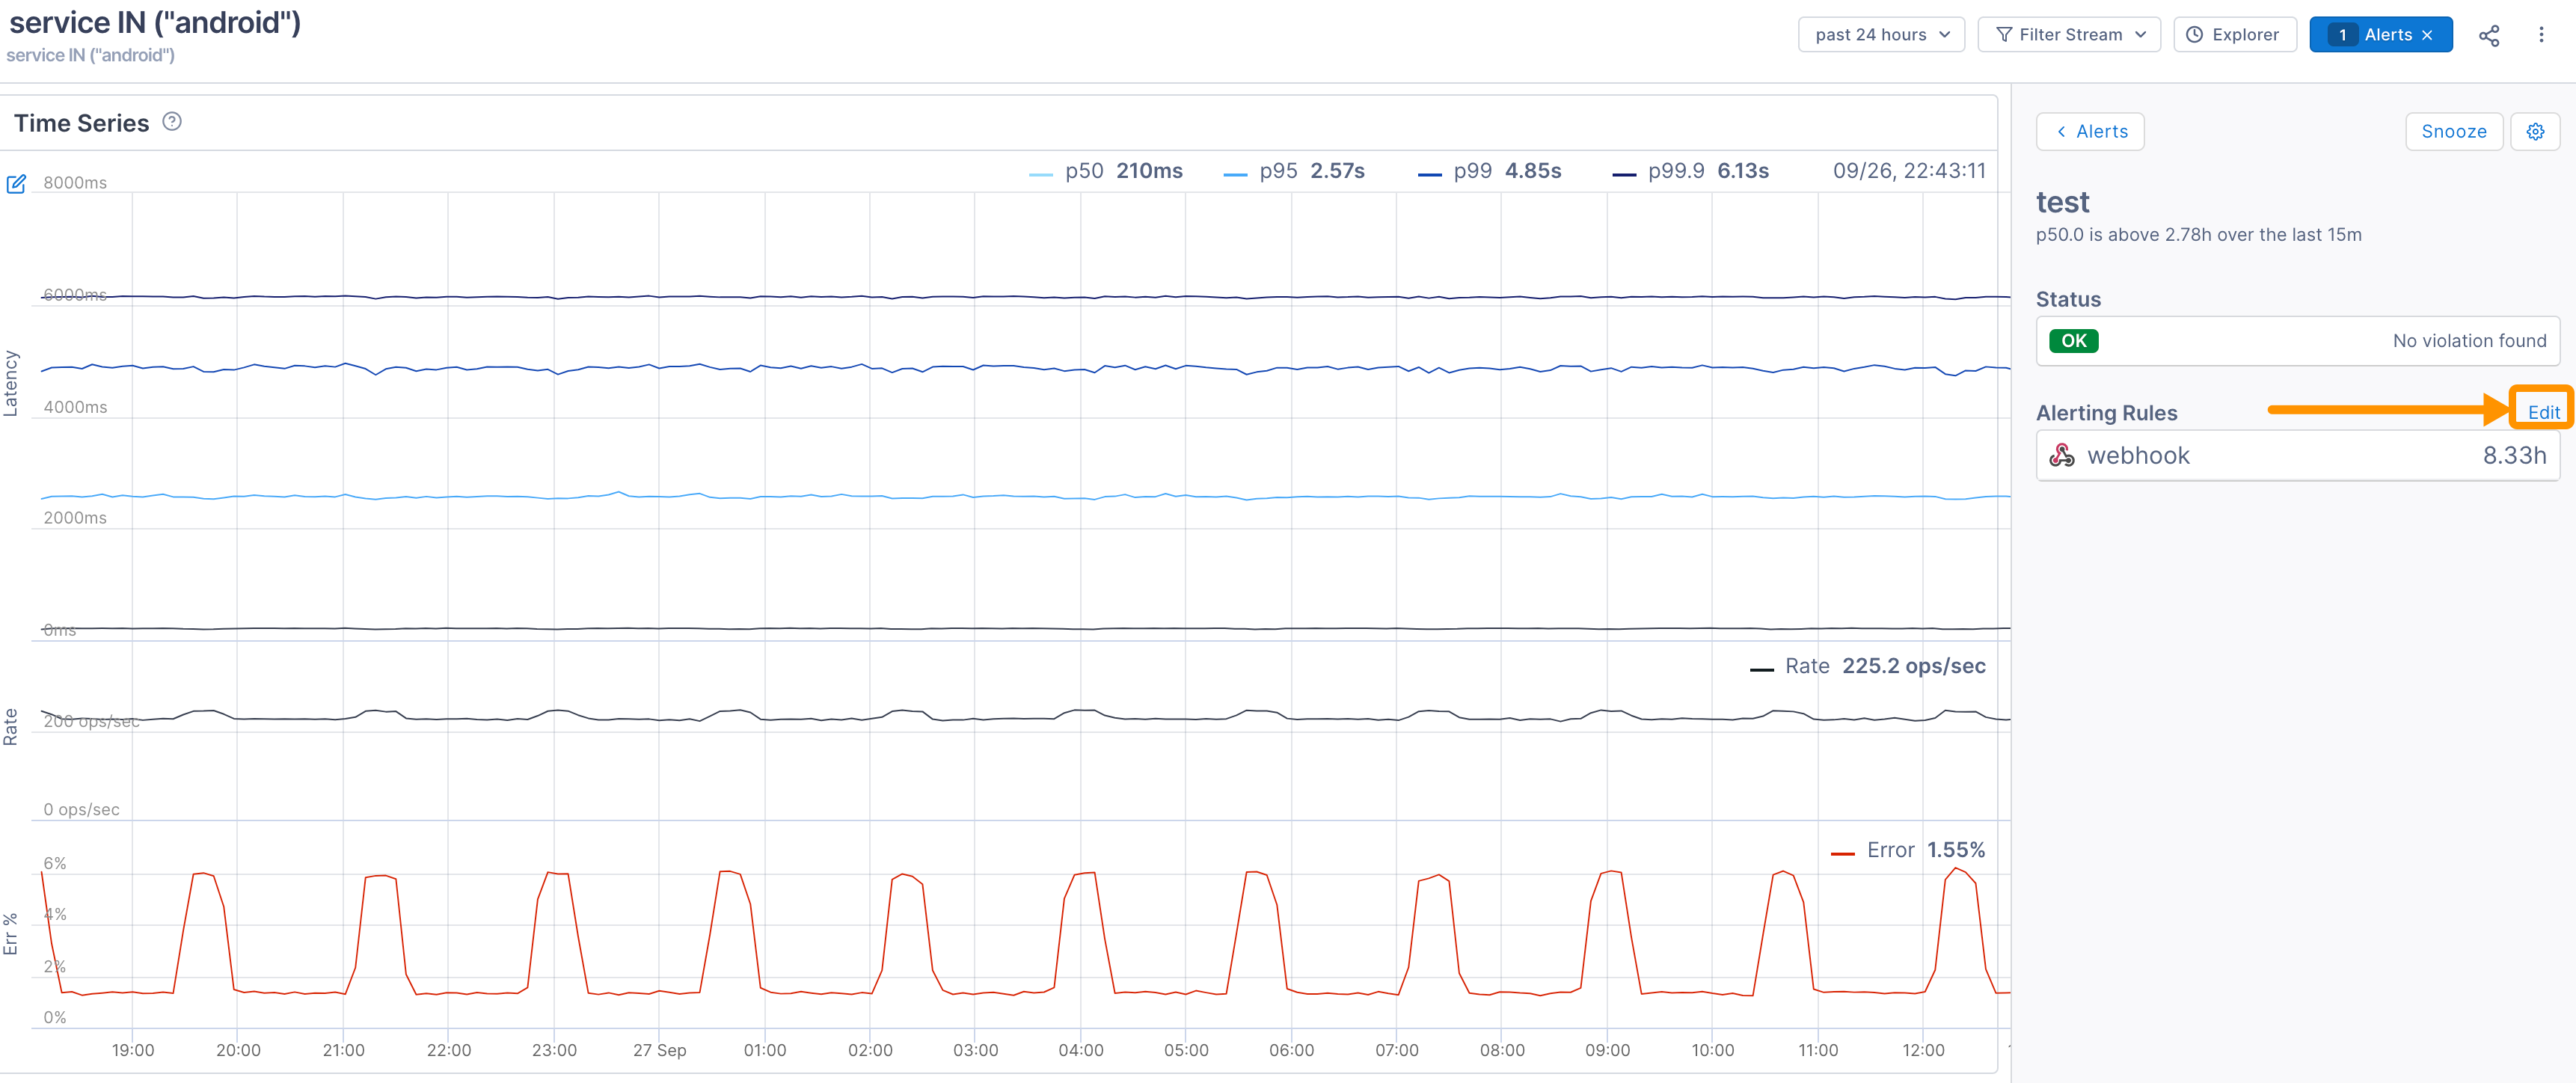
Snooze an alert
There may be times when you don’t want alerts to be sent, but you do want to keep the alert. You can snooze the alert and Cloud Observability pauses analysis of data against the threshold for the designated period of time (in seconds, minutes, hours, or days).
To snooze an alert:
-
From the Alerts view, click the alert to open the corresponding Stream.
-
Click Alerts to open the Alert panel, then click on the alert to edit.

-
Click Snooze and select the amount of time to snooze the alert, or enter a custom time period.
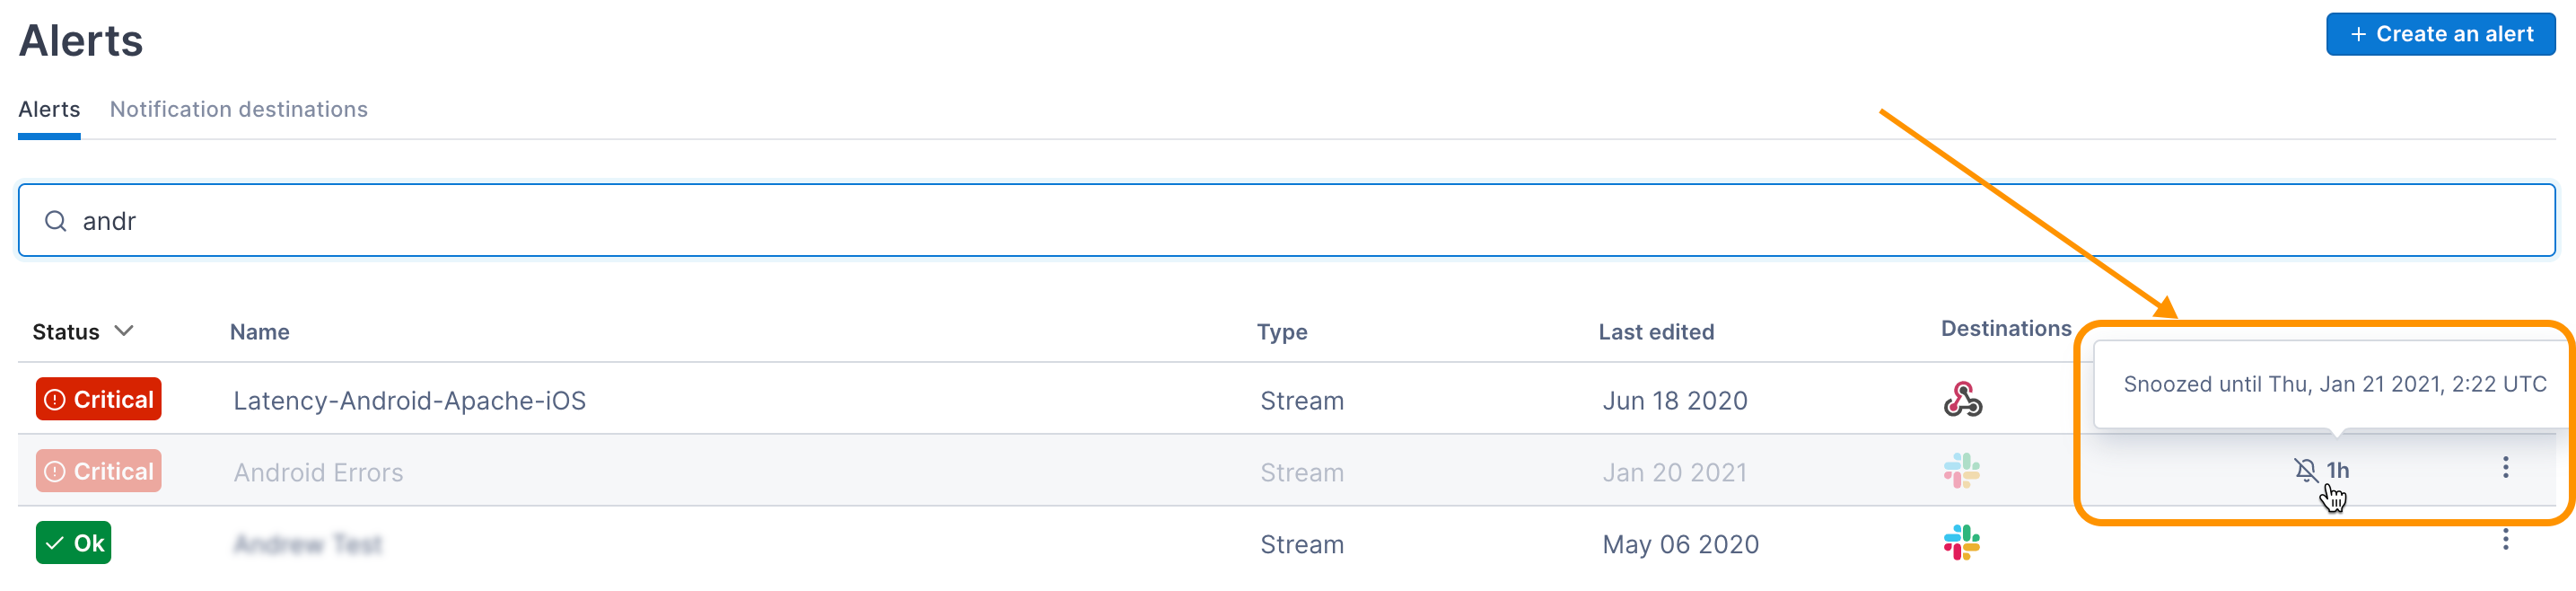
The status of the alert is set as Snoozed. On the Alerts view, the alert is grayed out and displays a Snooze icon. Pointing to the icon shows a tooltip with the snooze expiration time.
To remove the snooze, click Edit Snooze and Remove.
Edit an alert
You can edit an alert from the Stream.
To edit an alert:
-
From the Alerts view, click the alert to open the corresponding Stream.
-
Click Alerts to open the Alert panel, then click on the alert to edit. You can add a destination from here.
-
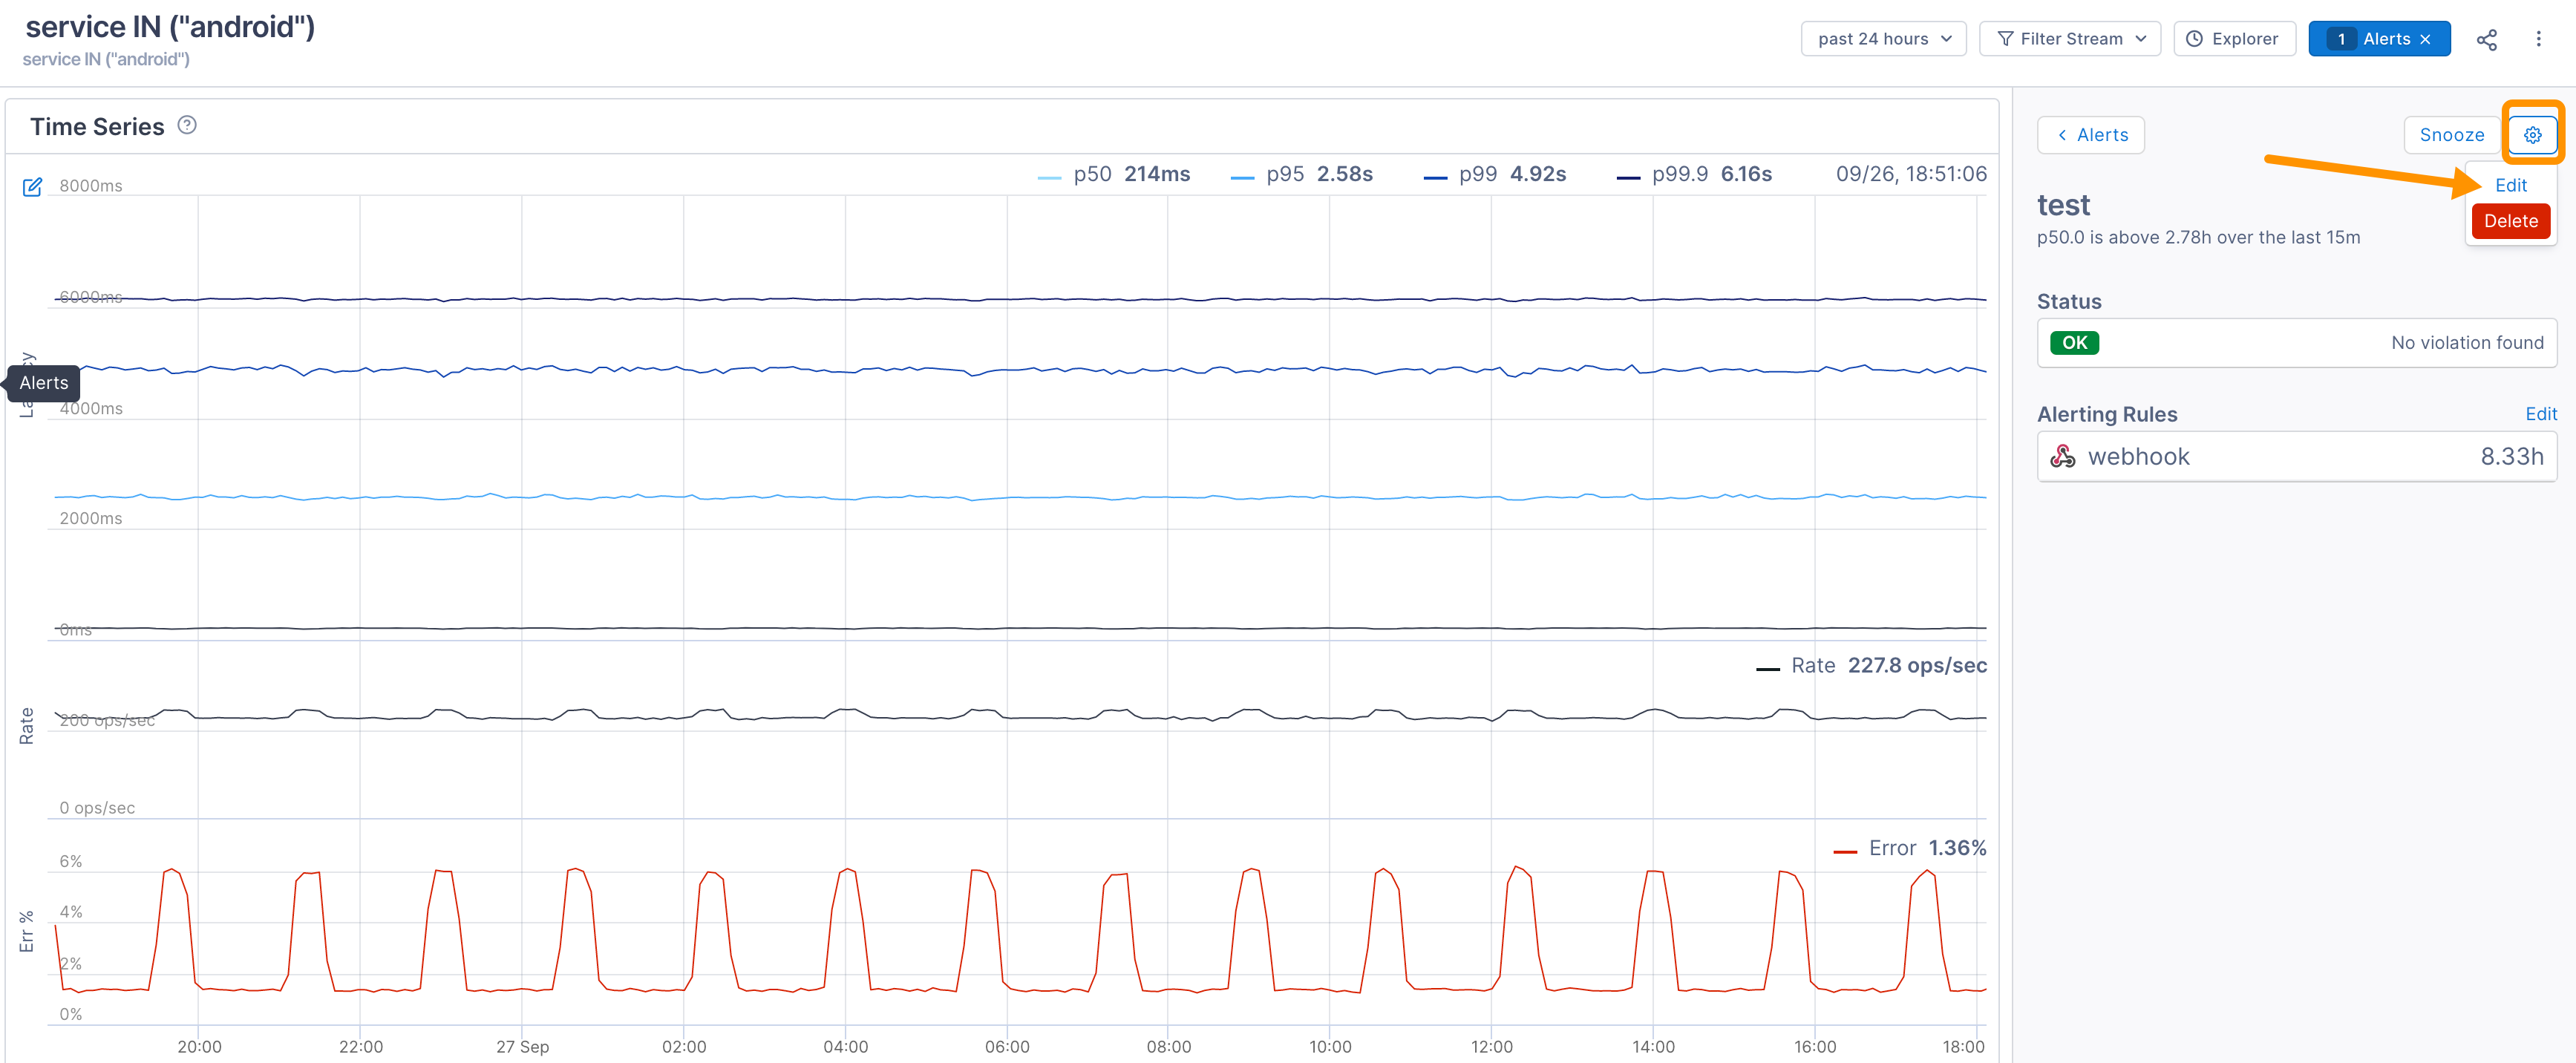
To change the configuration of the alert, use the gear icon to select Edit.
-
Edit the alert as needed.
-
When done, click Save Changes.
Delete an alert
To delete an alert, from the Alerts view select ⋮ > Delete.
See also
Manage notification destinations
Updated Dec 5, 2022