
Template variables allow you to dynamically filter panels in a dashboard based on attribute values returned by the data. Instead of creating a panel for each value, you create one panel and then filter the dashboard to a specific value or values.
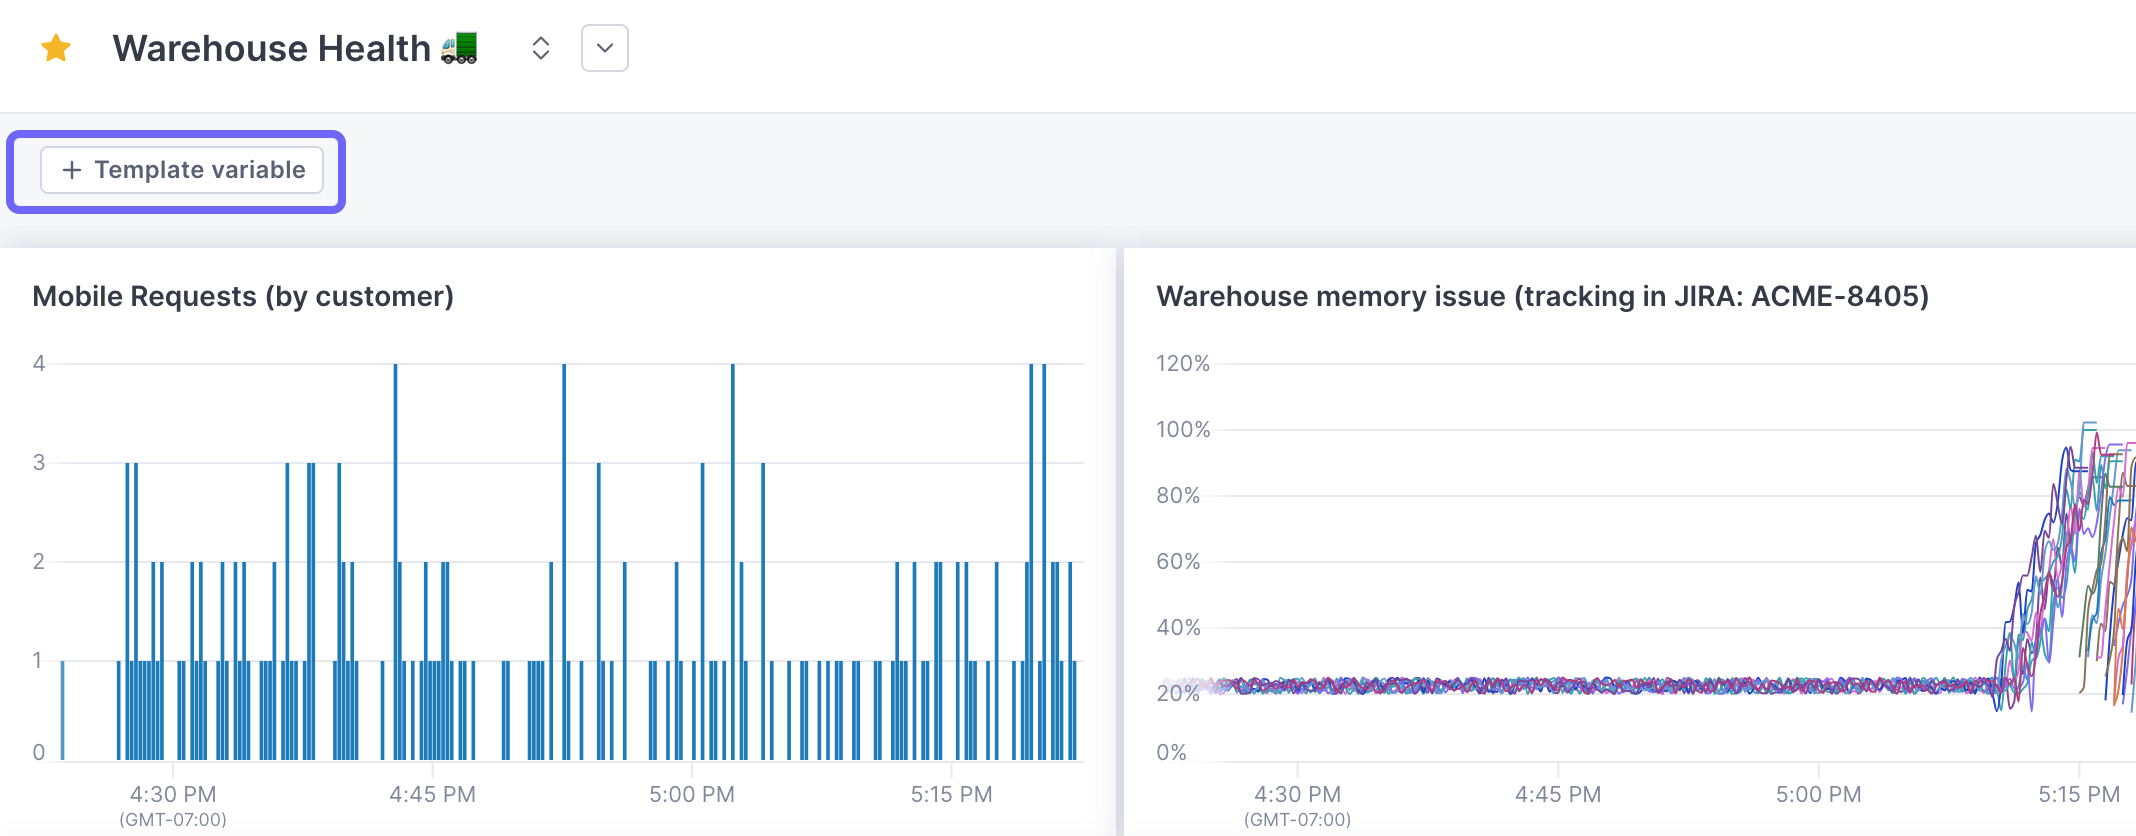
For example, say you want to view the health of your services. Instead of creating a separate dashboard for each service, you create one dashboard that uses service as a template variable. On initial load, the panels show data using the default value of the variable. You use the variable dropdown to select only the service(s) you’re interested in.
To display all values in the panels, don’t select any values (or click Clear if values are already selected). Any values added after this point will be included.
When your dashboard has more than one variable, Cloud Observability helps you select subsequent variable values by showing the ones most likely to return relevant data. The Related values section of the dropdown is scoped to values that also appear on data returned by the already-selected variable(s). For example, if the first variable is service and you select iOS, the Related values section for other variables shows you the values that are also on the iOS service.
Template variables provide greater functionality and are more predictable than Global filters. You can choose to use either one at the top of the dashboard.
You create template variables from existing attributes on your metric or span data. You can also create customer variables. Variables are specific to a particular dashboard.
When you copy a dashboard panel that uses variables to a notebook or an alert, or use Cloud Observability’s correlation feature, the variable is replaced with the current value used in the dashboard.
Create a template variable
You create and manage template variables from the Dashboard view. First, you create the variable and then you edit your panels to use it as a value in your query filter.
-
From a dashboard, click Template variable (or Manage template variables if you’ve already created one)
-
Enter the following:
-
Name: A unique name for the variable. This name displays the variable on the dashboard.
Names:- Must be unique
- Can use alphanumeric characters but can’t begin with a number
- Can use underscores
-
Suggestion attribute key: Select the attribute to use as the variable. The dropdown lists all available attributes that you can use as filters on the dashboard. If the key you want isn’t found, you can create a custom variable by manually entering it.
When Cloud Observability detects new attribute values, they automatically become available for the filter. You don’t need to update the variable.
-
Custom values: If you created a custom key, or if you want only certain values for a key to be available, enter those values here in a comma-separated list.
Custom values display with an asterisk (*) before their name.
-
Default value: Select the value that you want the dashboard to display on initial load.
To show all available values, don’t select any values (or click Clear if values are already selected). Selecting All for the filter implicitly returns all selected values, and any values added after this point will not be included.
-
Apply to panels: Select the panels on the dashboard that should use the variable.
When you apply a template variable to a panel, Cloud Observability adds a new filter to the query (for example,
filter service == $service). It will not remove or replace existing filters, as there are some cases where it may interfere with your query.
-
The variables display above the panels, where you can filter your dashboards to the selected variable values. 
Manage template variables
Create, edit, and delete template variables from the Manage template variables link. 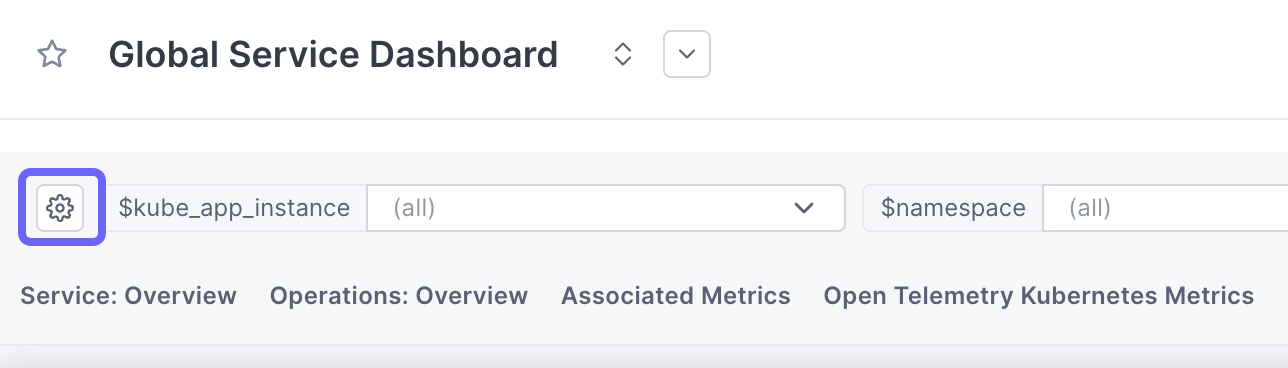
Deleting a template variable removes the added filter from panel queries selected to use that variable.
See also
Updated Feb 20, 2024