
Firefighting with traditional solutions is hard. Dashboards only show you that there is a problem, not where, and not what caused it. Going through logs takes time, and it’s hard to find that needle in a haystack. Metrics and logs let you know there’s an issue, but they can’t always tell you where and when. That’s where distributed tracing comes in.
Distributed tracing provides a view of a request as it travels across multiple hosts and services that may be communicating over various protocols.
The first step to distributed tracing is using OpenTelemetry to instrument your system, which provides the ability to collect data at each step in the request. You can start with auto-instrumentation (with little or no code changes) for common frameworks, libraries, and data sources, and add manual instrumentation for more in-depth data collection when needed.
Read on to learn about the different components that make up a distributed trace, including components that send data into Cloud Observability.
Spans and traces
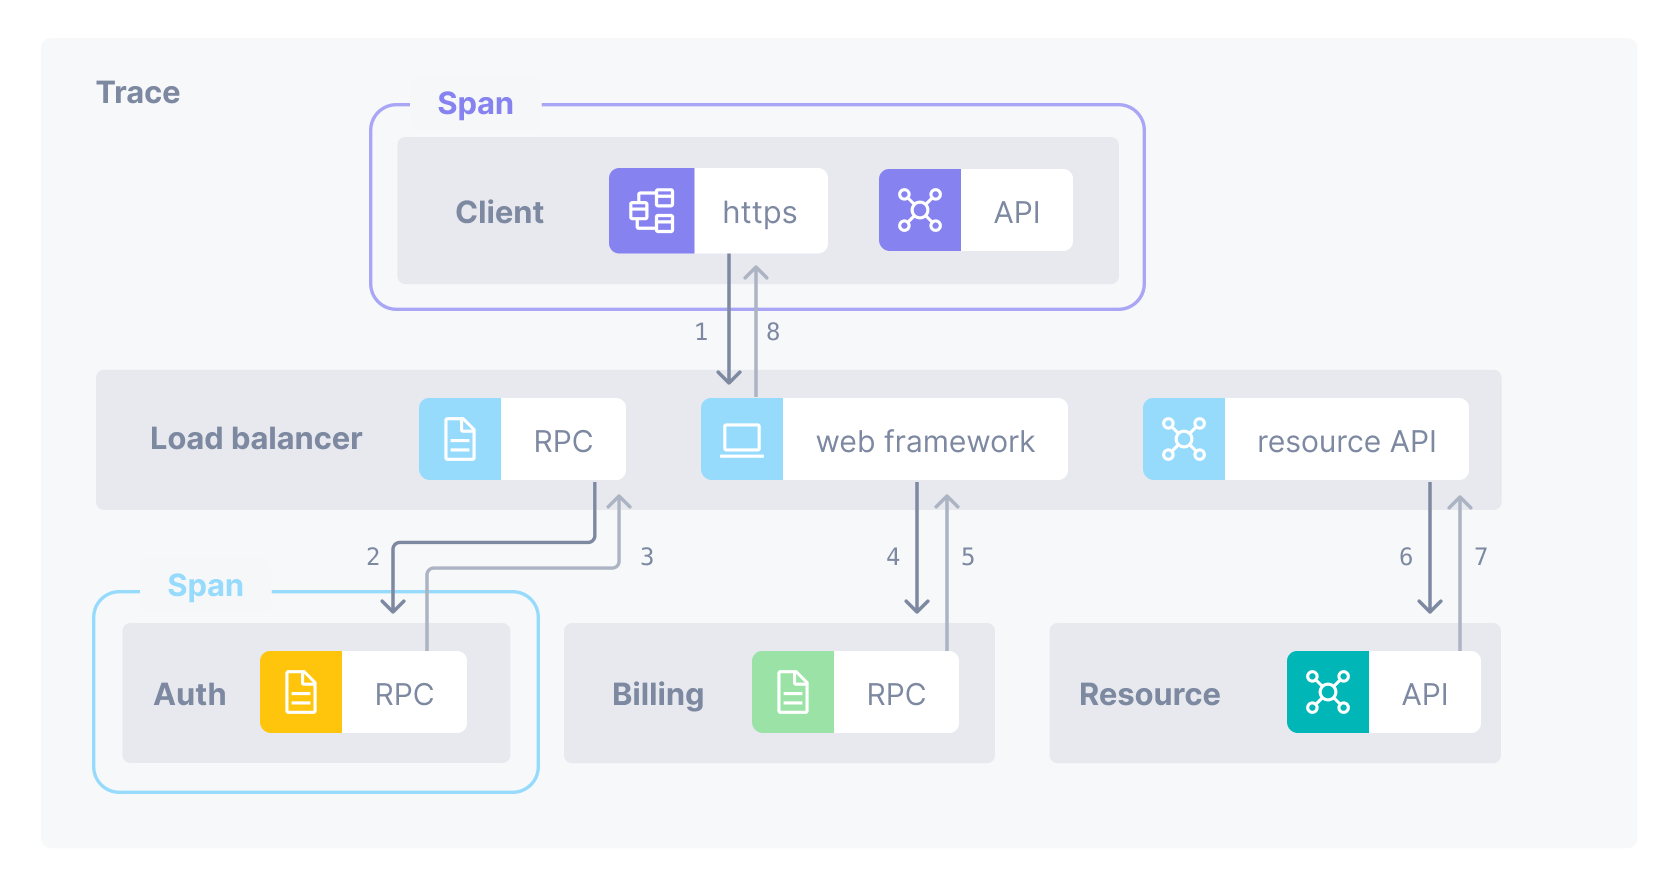
In distributed tracing, a trace is a view into a request as it moves through a distributed system. A span is a named, timed operation that represents a part of the workflow. Multiple spans are pieced together to create a trace.
Here’s an example of a request from a client through a load balancer into several backend systems. Each step in the request is represented by a span and the full request is represented by the trace, built by putting the spans in order.
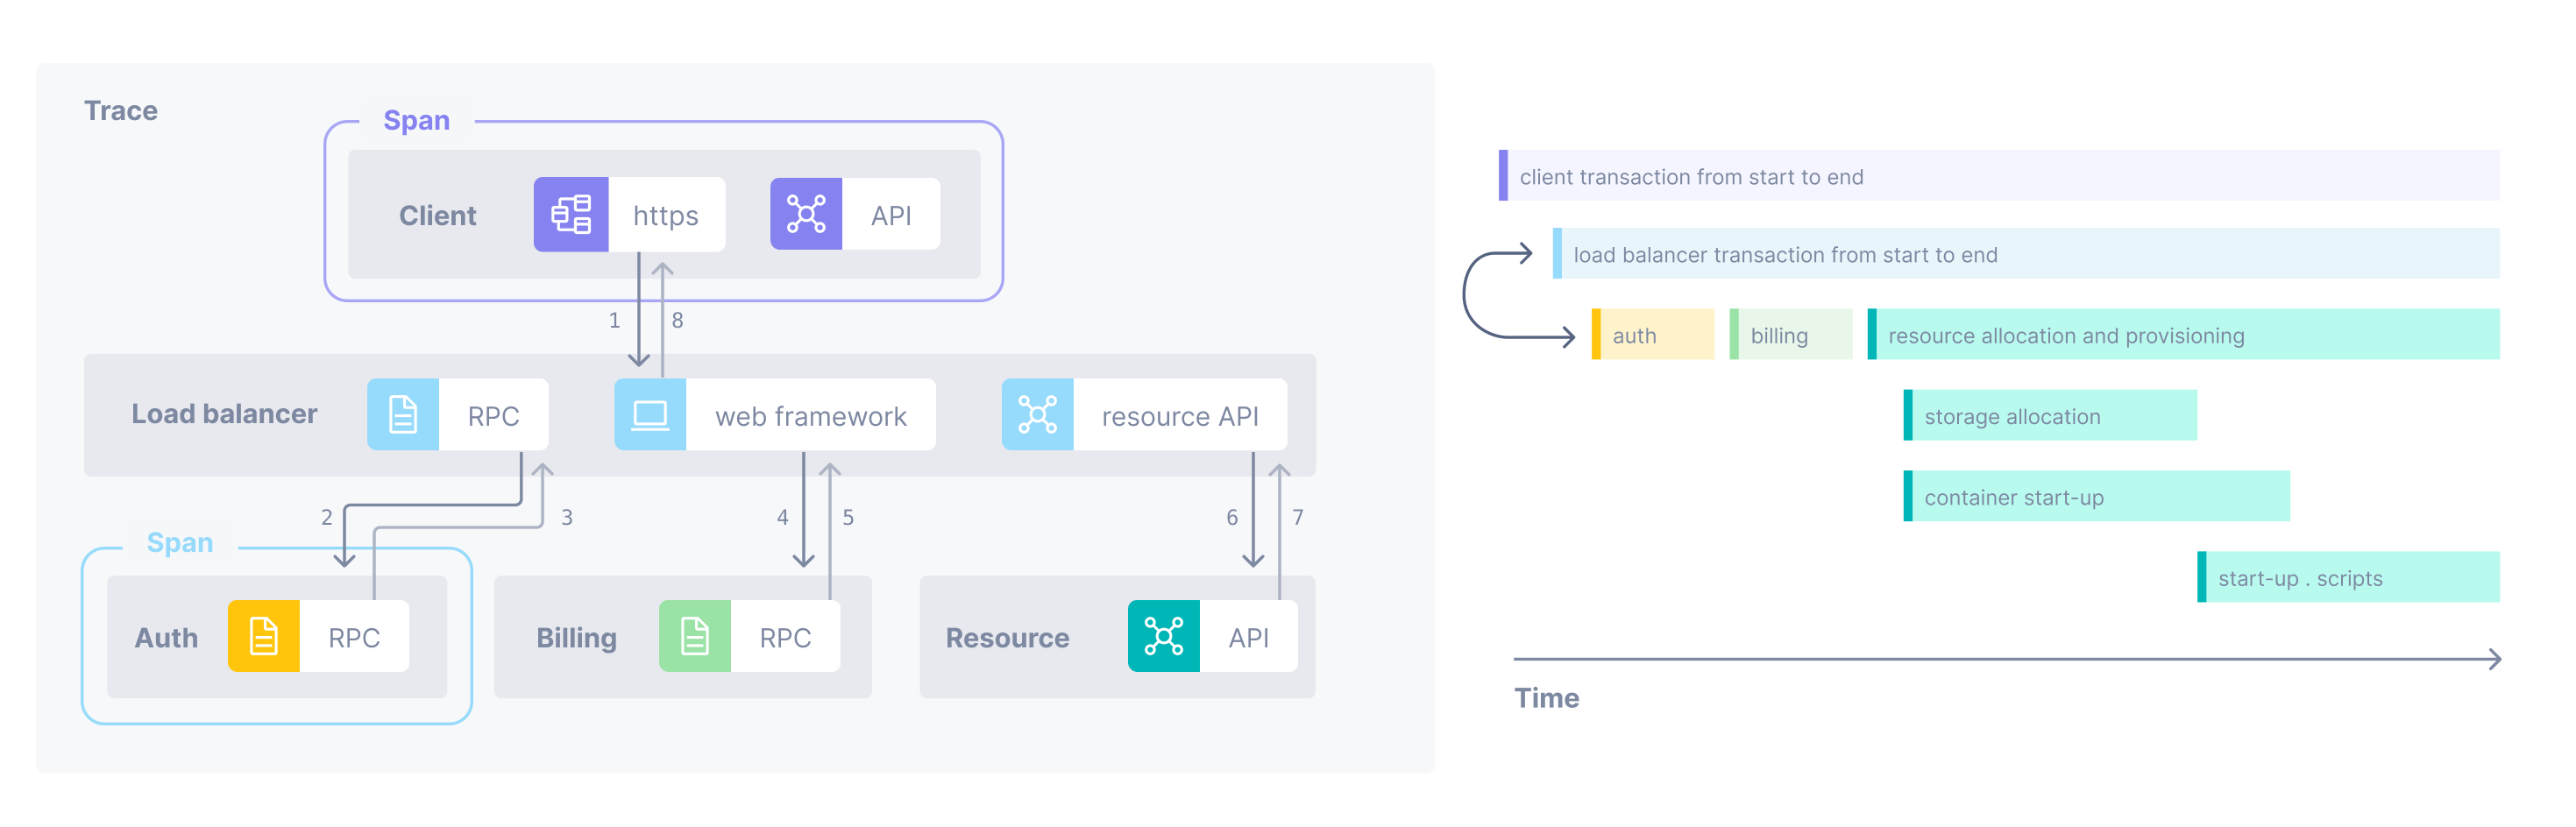
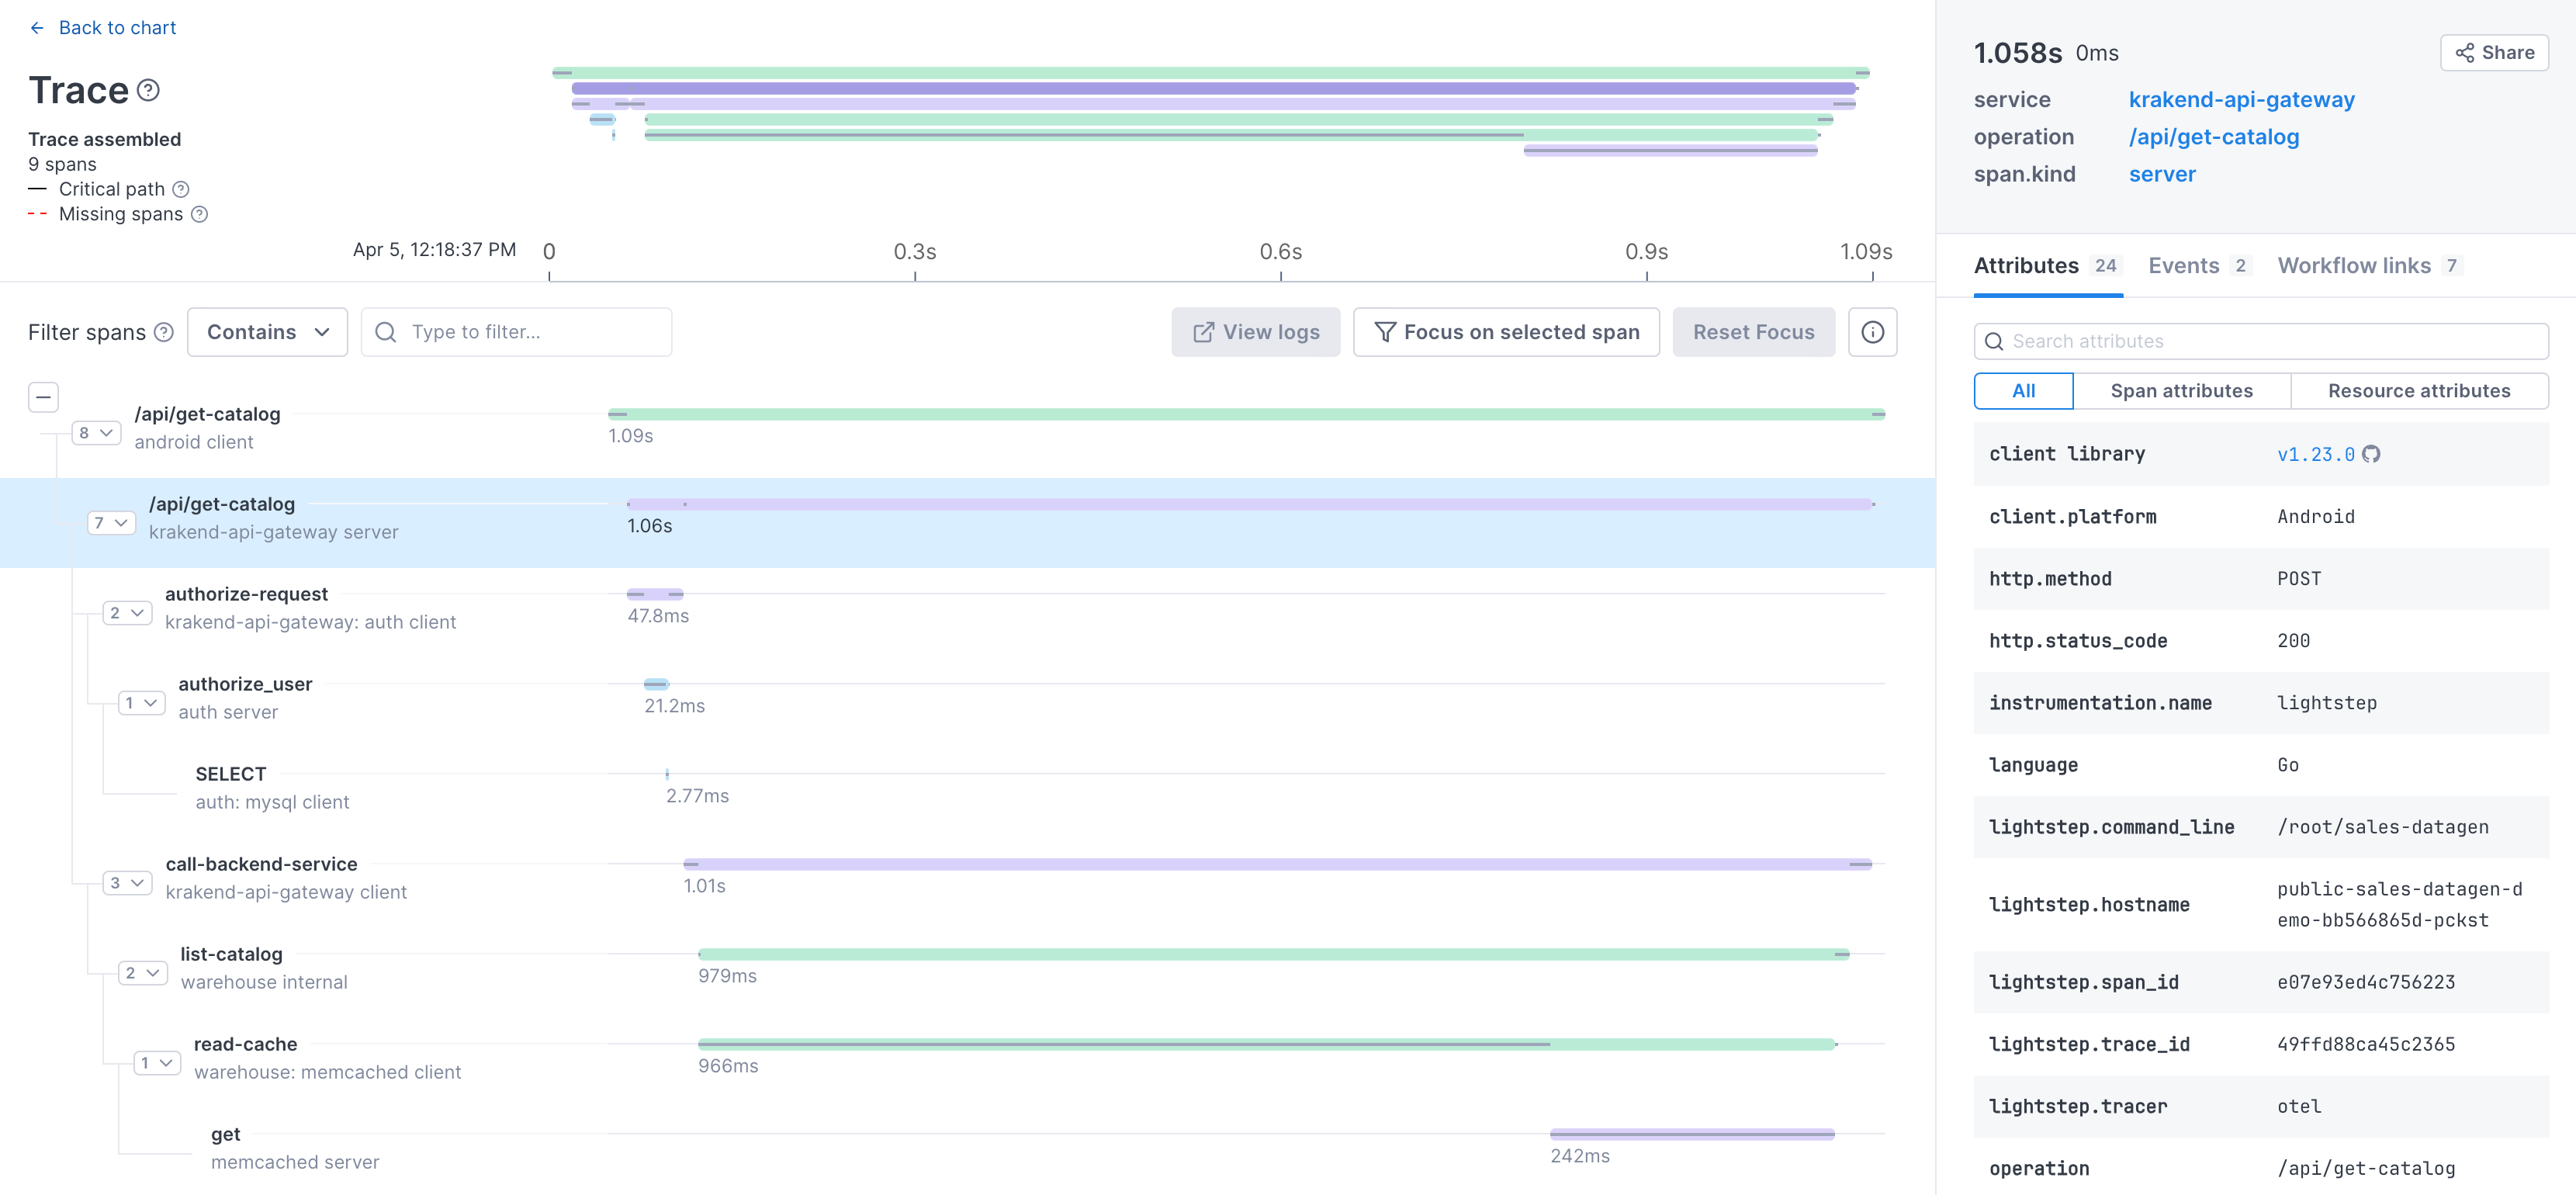
In Cloud Observability, you view traces in a waterfall diagram, showing when each span started and finished. It also shows you the relationship between spans. Here’s a simplified view of the trace for the request.
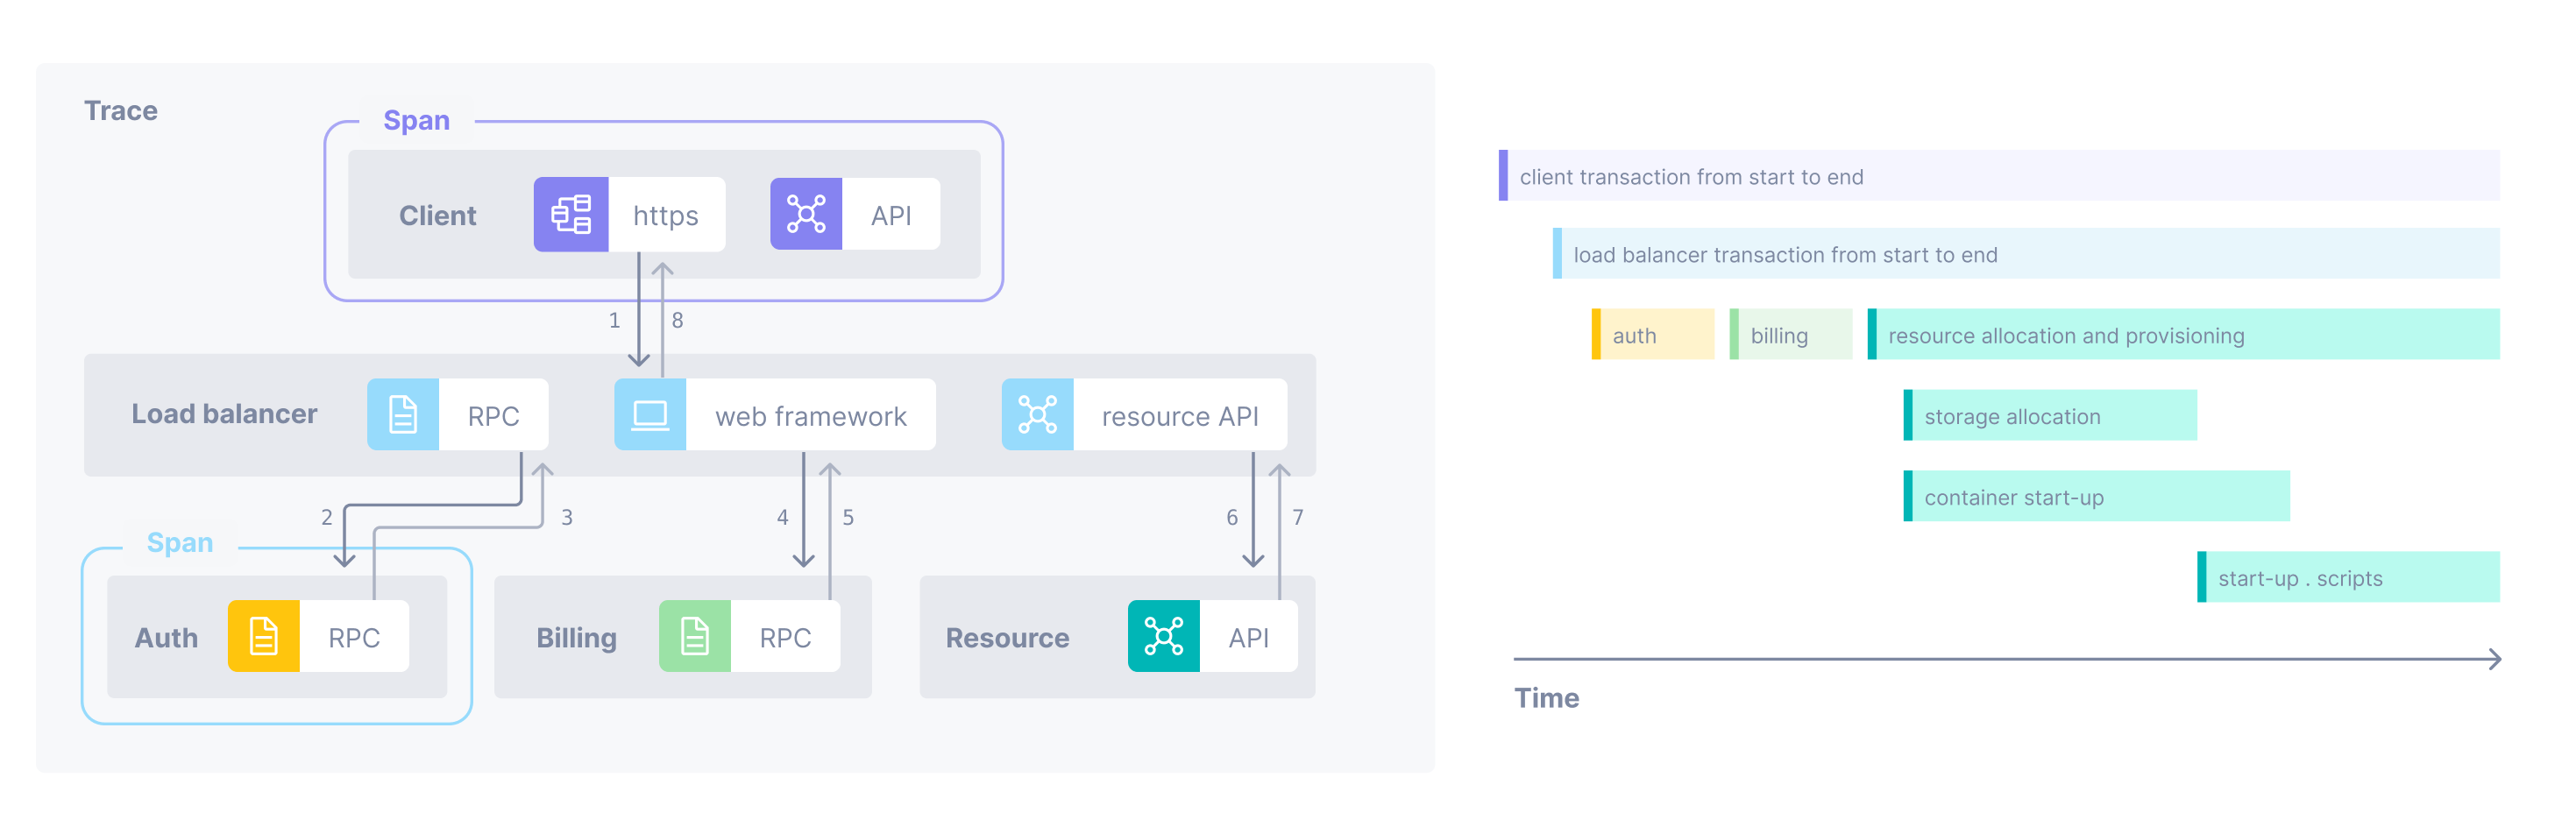
A trace starts with a root span where the request starts. This root span can have one or more child spans, and each one of those child spans can have child spans.
Context
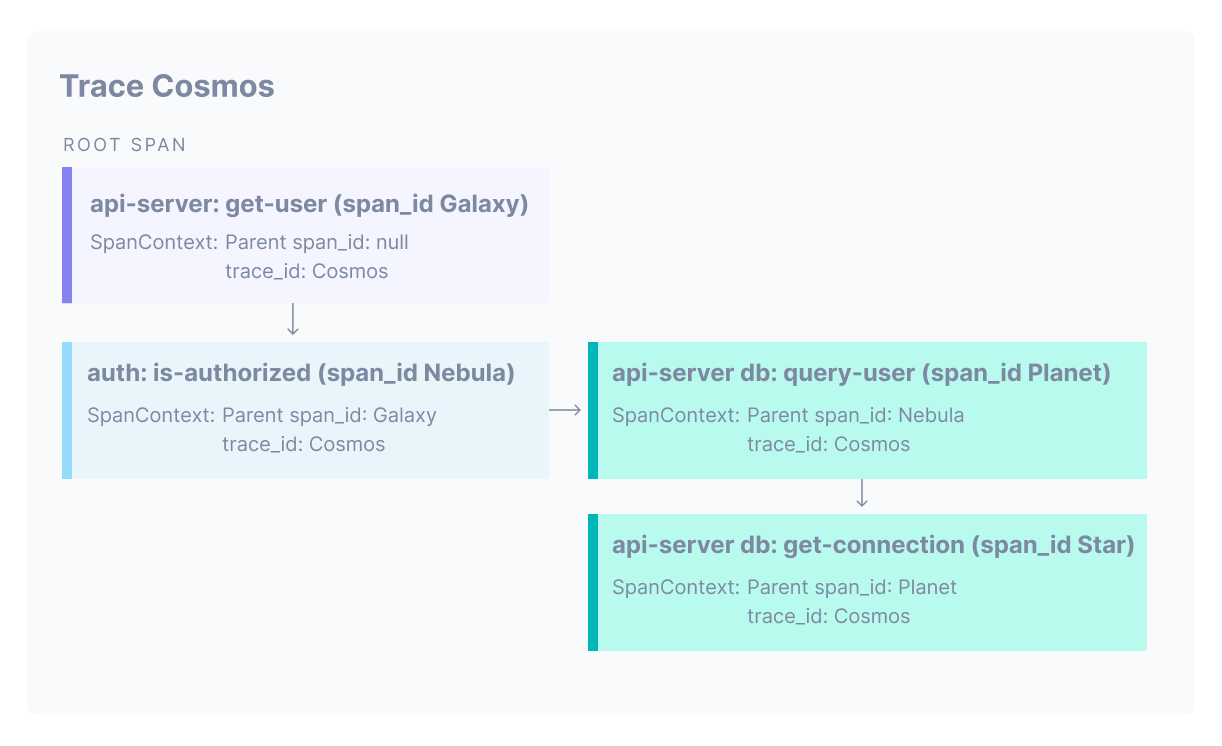
For the trace tree to be built with these relationships intact, each span needs to propagate its context to its child. This context contains information that’s passed between functions inside a process or between processes over an RPC. The context tells the child span who its parent is (parent SpanID) and what trace it belongs to (trace ID). The child span creates its own ID and then propagates both that ID (as the parent span ID) and the trace ID to its child span. There can be other components in the context, but the parent span ID and trace ID are what allow a trace tree to be built.
This image shows a trace starting from a root span in the api-server service (IDs use names for clarity, but are normally randomly generated IDs).
OpenTelemetry uses headers to propagate context from span to span.
Attributes
A span may also have zero or more key/value attributes. Attributes allow you to create metadata about the span. For example, you might create attributes that hold a customer ID, information about the span’s environment, or a component’s version. The OpenTelemetry spec defines standard attributes, called semantic conventions. Using these in your instrumentation ensures consistency when reporting across your system. You can also create your own attributes.
Span Events
Span events contain time-stamped information. A span can have zero or more events. Each is a time-stamped event name and an optional structured data payload.
You can add events to any span where the extra context adds value and is unique to an individual trace.
Sending span data to Cloud Observability with tracers
Tracers create the spans and their associated attributes, events, and context and send 100% of that data to the Collector (or to Cloud Observability’s Microsatellites). The Collector/Microsatellites process that data (including filtering, dropping, renaming) and then export it to Cloud Observability. Here, the traces are built from the spans, allowing you to view the traces and associated metadata from attributes and events. Read How Cloud Observability Works for more info.
Of course, that’s not all there is to distributed tracing or Cloud Observability! Here are more resources that can help you get started.
OpenTelemetry instrumentation
- OpenTelemetry and Cloud Observability: Read about using OpenTelemetry with Cloud Observability.
- OpenTelemetry: Learn more about OpenTelemetry
Cloud Observability
- Understand Cloud Observability’s architecture: Read how Cloud Observability uses OpenTelemetry and the SaaS platform to deliver visualized data to the Cloud Observability UI.
See also
Quickstart: Tracing instrumentation
General guidelines for tracing instrumentation
Updated Jan 12, 2024