
In this quickstart, you’ll run the OpenTelemetry demo application locally in a Kubernetes environment, allowing you to quickly understand how Cloud Observability ingests and displays your application and infrastructure telemetry data. The demo is a microservice environment maintained by the OpenTelemetry Community. Kubernetes has built-in support for hundreds of useful metrics that help teams understand the health of their containers, pods, nodes, workloads, and internal system components.
We recommend creating a separate sandbox or development project for testing with non-production data.
Overview
You’ll set up a local Kubernetes Cluster and use the OpenTelemetry Collector and the OpenTelemetry Operator to send data to Cloud Observability. The Collector is a vendor-agnostic agent that receives, processes, and exports telemetry data. The Operator is an implementation of the Kubernetes Operator that manages the Collector. You install and configure both of these using provided Helm charts.
In this quickstart, you’ll:
- Step 1: Create a local Kubernetes cluster
- Step 2: Add and install Helm charts
These Helm charts configure your environment (especially the Collector) to work best with Cloud Observability.
- Step 3: Install pre-configured Collectors to send trace, log, and metric data to Cloud Observability
- Step 4: View metric, log, and trace data in Cloud Observability to diagnose an issue
- Step 5: View Collector health in Cloud Observability
Prerequisites
- A machine with ability to install minikube
- A machine with ability to send data to Cloud Observability
-
Helm version 3 or later
We recommend using Helm to manage dependencies and upgrades. However, if you cannot deploy Helm charts, you can use the
helm templatecommand to automatically generate Kubernetes manifests from an existing chart. - A Cloud Observability project. We recommend you create a new project for this tutorial.
- A Cloud Observability access token
Step 1: Create Kubernetes Cluster
You are going to be creating a local demo environment. minikube is local Kubernetes, focusing on making it easy to learn and develop for Kubernetes. Follow the instructions on minikube to install according to your operating system.
-
Run the following command to create a local Kubernetes cluster with 2 nodes and name it
quickstart-cluster1
minikube start --nodes 2 -p quickstart-cluster
If you already have kubectl installed, you can now use it to access your shiny new cluster, or install it via documentation
1
 kubectl get po -A
Step 2: Install Helm charts
-
Run the following command to verify you are connected to a Kubernetes cluster.
1
 kubectl cluster-info
If you see errors or cannot connect, follow the instructions from minikube on debugging your cluster.
-
Verify Helm is installed and that you’re on version 3 or later.
1
 helm version
-
Add the following Helm repositories and pull the latest charts.
1
2
3
4
  helm repo add jetstack https://charts.jetstack.io
  helm repo add open-telemetry https://open-telemetry.github.io/opentelemetry-helm-charts
  helm repo add lightstep https://lightstep.github.io/otel-collector-charts
  helm repo update
-
Next, install the cert-manager charts on your cluster. The Cert Manager manages certificates needed by the Operator to subscribe to in-cluster Kubernetes events.
1
2
3
4
5
6
  helm install \
      cert-manager jetstack/cert-manager \
      --namespace cert-manager \
      --create-namespace \
      --version v1.8.0 \
      --set installCRDs=true
-
Install the OpenTelemetry Operator chart. The Operator automates the creation and management of Collectors, autoscaling, code instrumentation, scraping metrics endpoints, and more.
1
2
3
4
5
 helm install \
     opentelemetry-operator open-telemetry/opentelemetry-operator \
     -n sn-cloud-obs \
     --set "manager.collectorImage.repository=otel/opentelemetry-collector-k8s" \
     --version 0.56.0
-
Run the following command to verify both charts successfully deployed with a status that says
deployed:1
helm list -AThe output should look similar to the following:
1
2
3
 NAME                    NAMESPACE       REVISION        UPDATED                                 STATUS          CHART                           APP VERSION
 cert-manager          	cert-manager	1       	2023-11-29 17:43:24.563284 -0800 PST	deployed	cert-manager-v1.8.0          	v1.8.0
opentelemetry-operator	sn-cloud-obs     	1       	2023-11-29 17:43:58.368416 -0800 PST	deployed	opentelemetry-operator-0.43.0	0.89.0
You’ve installed the prerequisites needed to successfully run Collectors and you’ve installed the OpenTelemetry Operator to Kubernetes.
Step 3: Send telemetry data to Cloud Observability
In this step, you deploy the OpenTelemetry demo application, which will send metrics, logs, and traces to Cloud Observability.
Deploy the Collectors
You use the Operator to deploy a Collector configured to send log, metric, and trace data to Cloud Observability. The OpenTelemetry Collector has several receivers and processors that let you collect and enrich Kubernetes data all with OTLP data. If you send OTLP data to a collector with these processors you are able to enrich your application’s telemetry with infrastructure metadata. Cloud Observability provides a Helm chart to automatically configure collectors to send these metrics to Cloud Observability.
-
Create a secret that holds your Cloud Observability Access Token.
1
2
 export LS_TOKEN='<your-token>'
 kubectl create secret generic otel-collector-secret -n sn-cloud-obs --from-literal="LS_TOKEN=$LS_TOKEN"
-
Install the
otel-cloud-stackchart. This chart automatically creates collectors to push Kubernetes metrics to your Cloud Observability project. This chart will install a singleton collector for Kubernetes cluster metrics and a daemonset collector to collect node and kubelet metrics (as well as any Prometheus instances with theprometheus.io/scrape: "true"annotation.)Make sure to replace
your-cluster-namewith the name of the cluster you are connected to.1 2 3 4
helm install otel-cloud-stack lightstep/otel-cloud-stack \ -n sn-cloud-obs \ --set clusterName=your-cluster-name # --set otlpDestinationOverride="ingest.eu.lightstep.com:443" \ # EU data center
-
Verify the pods from the charts have been deployed with no errors:
1
 kubectl get pods
You should see pods for a stats-collector and a daemonset for node metrics.
-
Deploy Collectors for trace data. Run the following command to deploy a new Collector configured for trace data into the cluster. Replace
your-cluster-namewith the name of the cluster you are connected to.1 2 3 4 5
helm upgrade otel-cloud-stack lightstep/otel-cloud-stack \ -n sn-cloud-obs \ --set tracesCollector.enabled=true \ --set clusterName=your-cluster-name # --set otlpDestinationOverride="ingest.eu.lightstep.com:443" \ #EU datacenter
Make sure to replace your-cluster-name with the name of the cluster you are connected to.
Deploy the OpenTelemetry demo
The demo is a microservice environment maintained by the OpenTelemetry Community. The Helm chart configures a collector following general guidelines.
-
Install the helm chart with the release name
my-otel-demo, by running the following command:1
helm install my-otel-demo open-telemetry/opentelemetry-demo -
On your local machine, create a new
values.yamlwith the following content. This configures the OpenTelemetry Demo Helm chart to send metrics and traces to the collectors deployed by theotel-cloud-stackchart:1 2 3 4 5 6 7 8 9 10 11 12 13 14 15 16 17 18 19 20 21 22 23
opentelemetry-collector: config: exporters: logging: verbosity: normal otlp/traces: endpoint: otel-cloud-stack-traces-collector:4317 tls: insecure: true otlp/metrics: endpoint: otel-cloud-stack-daemon-collector:4317 tls: insecure: true service: pipelines: metrics: receivers: [otlp] processors: [batch] exporters: [logging, otlp/metrics] traces: receivers: [otlp] processors: [batch] exporters: [logging, otlp/traces] -
Deploy the demo environment with your
values.yamlfile:1
helm upgrade my-otel-demo open-telemetry/opentelemetry-demo --install -f values.yaml
-
Verify that the Collectors and demo microservices are deployed:
1
 kubectl get services
The output should look similar to the following, with the
otel-cloud-stackmetrics and trace collectors using ports4317/TCPand8888/TCP.1 2 3 4 5 6 7 8 9 10 11 12 13 14 15 16 17 18 19 20 21 22 23 24 25 26 27 28 29 30
NAME TYPE CLUSTER-IP EXTERNAL-IP PORT(S) AGE my-otel-demo-adservice ClusterIP 10.99.205.212 <none> 8080/TCP 19s my-otel-demo-cartservice ClusterIP 10.107.188.52 <none> 8080/TCP 19s my-otel-demo-checkoutservice ClusterIP 10.104.26.101 <none> 8080/TCP 19s my-otel-demo-currencyservice ClusterIP 10.97.135.204 <none> 8080/TCP 19s y-otel-demo-emailservice ClusterIP 10.98.18.192 <none> 8080/TCP 19s my-otel-demo-featureflagservice ClusterIP 10.109.74.9 <none> 50053/TCP,8081/TCP 19s my-otel-demo-ffspostgres ClusterIP 10.111.194.78 <none> 5432/TCP 19s my-otel-demo-frontend ClusterIP 10.102.50.191 <none> 8080/TCP 19s my-otel-demo-frontendproxy ClusterIP 10.97.254.245 <none> 8080/TCP 19s my-otel-demo-grafana ClusterIP 10.106.155.144 <none> 80/TCP 19s my-otel-demo-jaeger-agent ClusterIP None <none> 5775/UDP,5778/TCP,6831/UDP,6832/UDP 19s my-otel-demo-jaeger-collector ClusterIP None <none> 9411/TCP,14250/TCP,14267/TCP,14268/TCP,4317/TCP,4318/TCP 19s my-otel-demo-jaeger-query ClusterIP None <none> 16686/TCP,16685/TCP 19s my-otel-demo-kafka ClusterIP 10.105.42.239 <none> 9092/TCP,9093/TCP 19s my-otel-demo-loadgenerator ClusterIP 10.111.224.209 <none> 8089/TCP 19s my-otel-demo-otelcol ClusterIP 10.101.157.62 <none> 6831/UDP,14250/TCP,14268/TCP,8888/TCP,4317/TCP,4318/TCP,9464/TCP,9411/TCP 19s my-otel-demo-paymentservice ClusterIP 10.109.138.13 <none> 8080/TCP 19s my-otel-demo-productcatalogservice ClusterIP 10.97.7.33 <none> 8080/TCP 19s my-otel-demo-prometheus-server ClusterIP 10.111.112.95 <none> 9090/TCP 19s my-otel-demo-quoteservice ClusterIP 10.104.70.209 <none> 8080/TCP 19s my-otel-demo-recommendationservice ClusterIP 10.100.171.233 <none> 8080/TCP 19s my-otel-demo-redis ClusterIP 10.103.99.96 <none> 6379/TCP 19s my-otel-demo-shippingservice ClusterIP 10.104.162.129 <none> 8080/TCP 19s opentelemetry-operator ClusterIP 10.106.209.173 <none> 8443/TCP,8080/TCP 19m opentelemetry-operator-webhook ClusterIP 10.100.60.228 <none> 443/TCP 19m otel-cloud-stack-cluster-stats-collector-monitoring ClusterIP 10.97.37.53 <none> 8888/TCP 5m39s otel-cloud-stack-daemon-collector ClusterIP 10.110.44.223 <none> 4317/TCP,4318/TCP 5m39s otel-cloud-stack-daemon-collector-headless ClusterIP None <none> 4317/TCP,4318/TCP 5m39s otel-cloud-stack-daemon-collector-monitoring ClusterIP 10.110.2.57 <none> 8888/TCP 5m39s
-
Once your services finish getting set up, expose the frontend proxy at port
8080.1
kubectl port-forward svc/my-otel-demo-frontendproxy 8080:8080
-
Expose the OTLP port on the Collector at port
4317.1
kubectl port-forward svc/my-otel-demo-otelcol 4317:4317
-
Verify the demo is running by visiting localhost:8080
Send Kubernetes Events and pod logs to Cloud Observability
You use the Operator to deploy a collector configured to send log data to Cloud Observability. The chart configures a collector for logging following general guidelines and forwards Kubernetes events and pod logs by default.
-
Run the following command to deploy a new Collector configured for logging data into the cluster along with traces:
1
2
3
4
5
6
 helm upgrade otel-cloud-stack lightstep/otel-cloud-stack \
   -n default
   --set tracesCollector.enabled=true \
   --set logsCollector.enabled=true \
   --set clusterName=your-cluster-name
   # --set otlpDestinationOverride="ingest.eu.lightstep.com:443" \ #EU data center
Make sure to replace your-cluster-name with the name of the cluster you are connected to.
-
Next, verify that the Collector configured for logging has been deployed:
1
 kubectl get services
You should see a new service with the name
otel-cloud-stack-logs-collector. -
After a few minutes, you should see new services, spans, metrics, and logs in your Cloud Observability project.
Step 4: View telemetry data in Cloud Observability
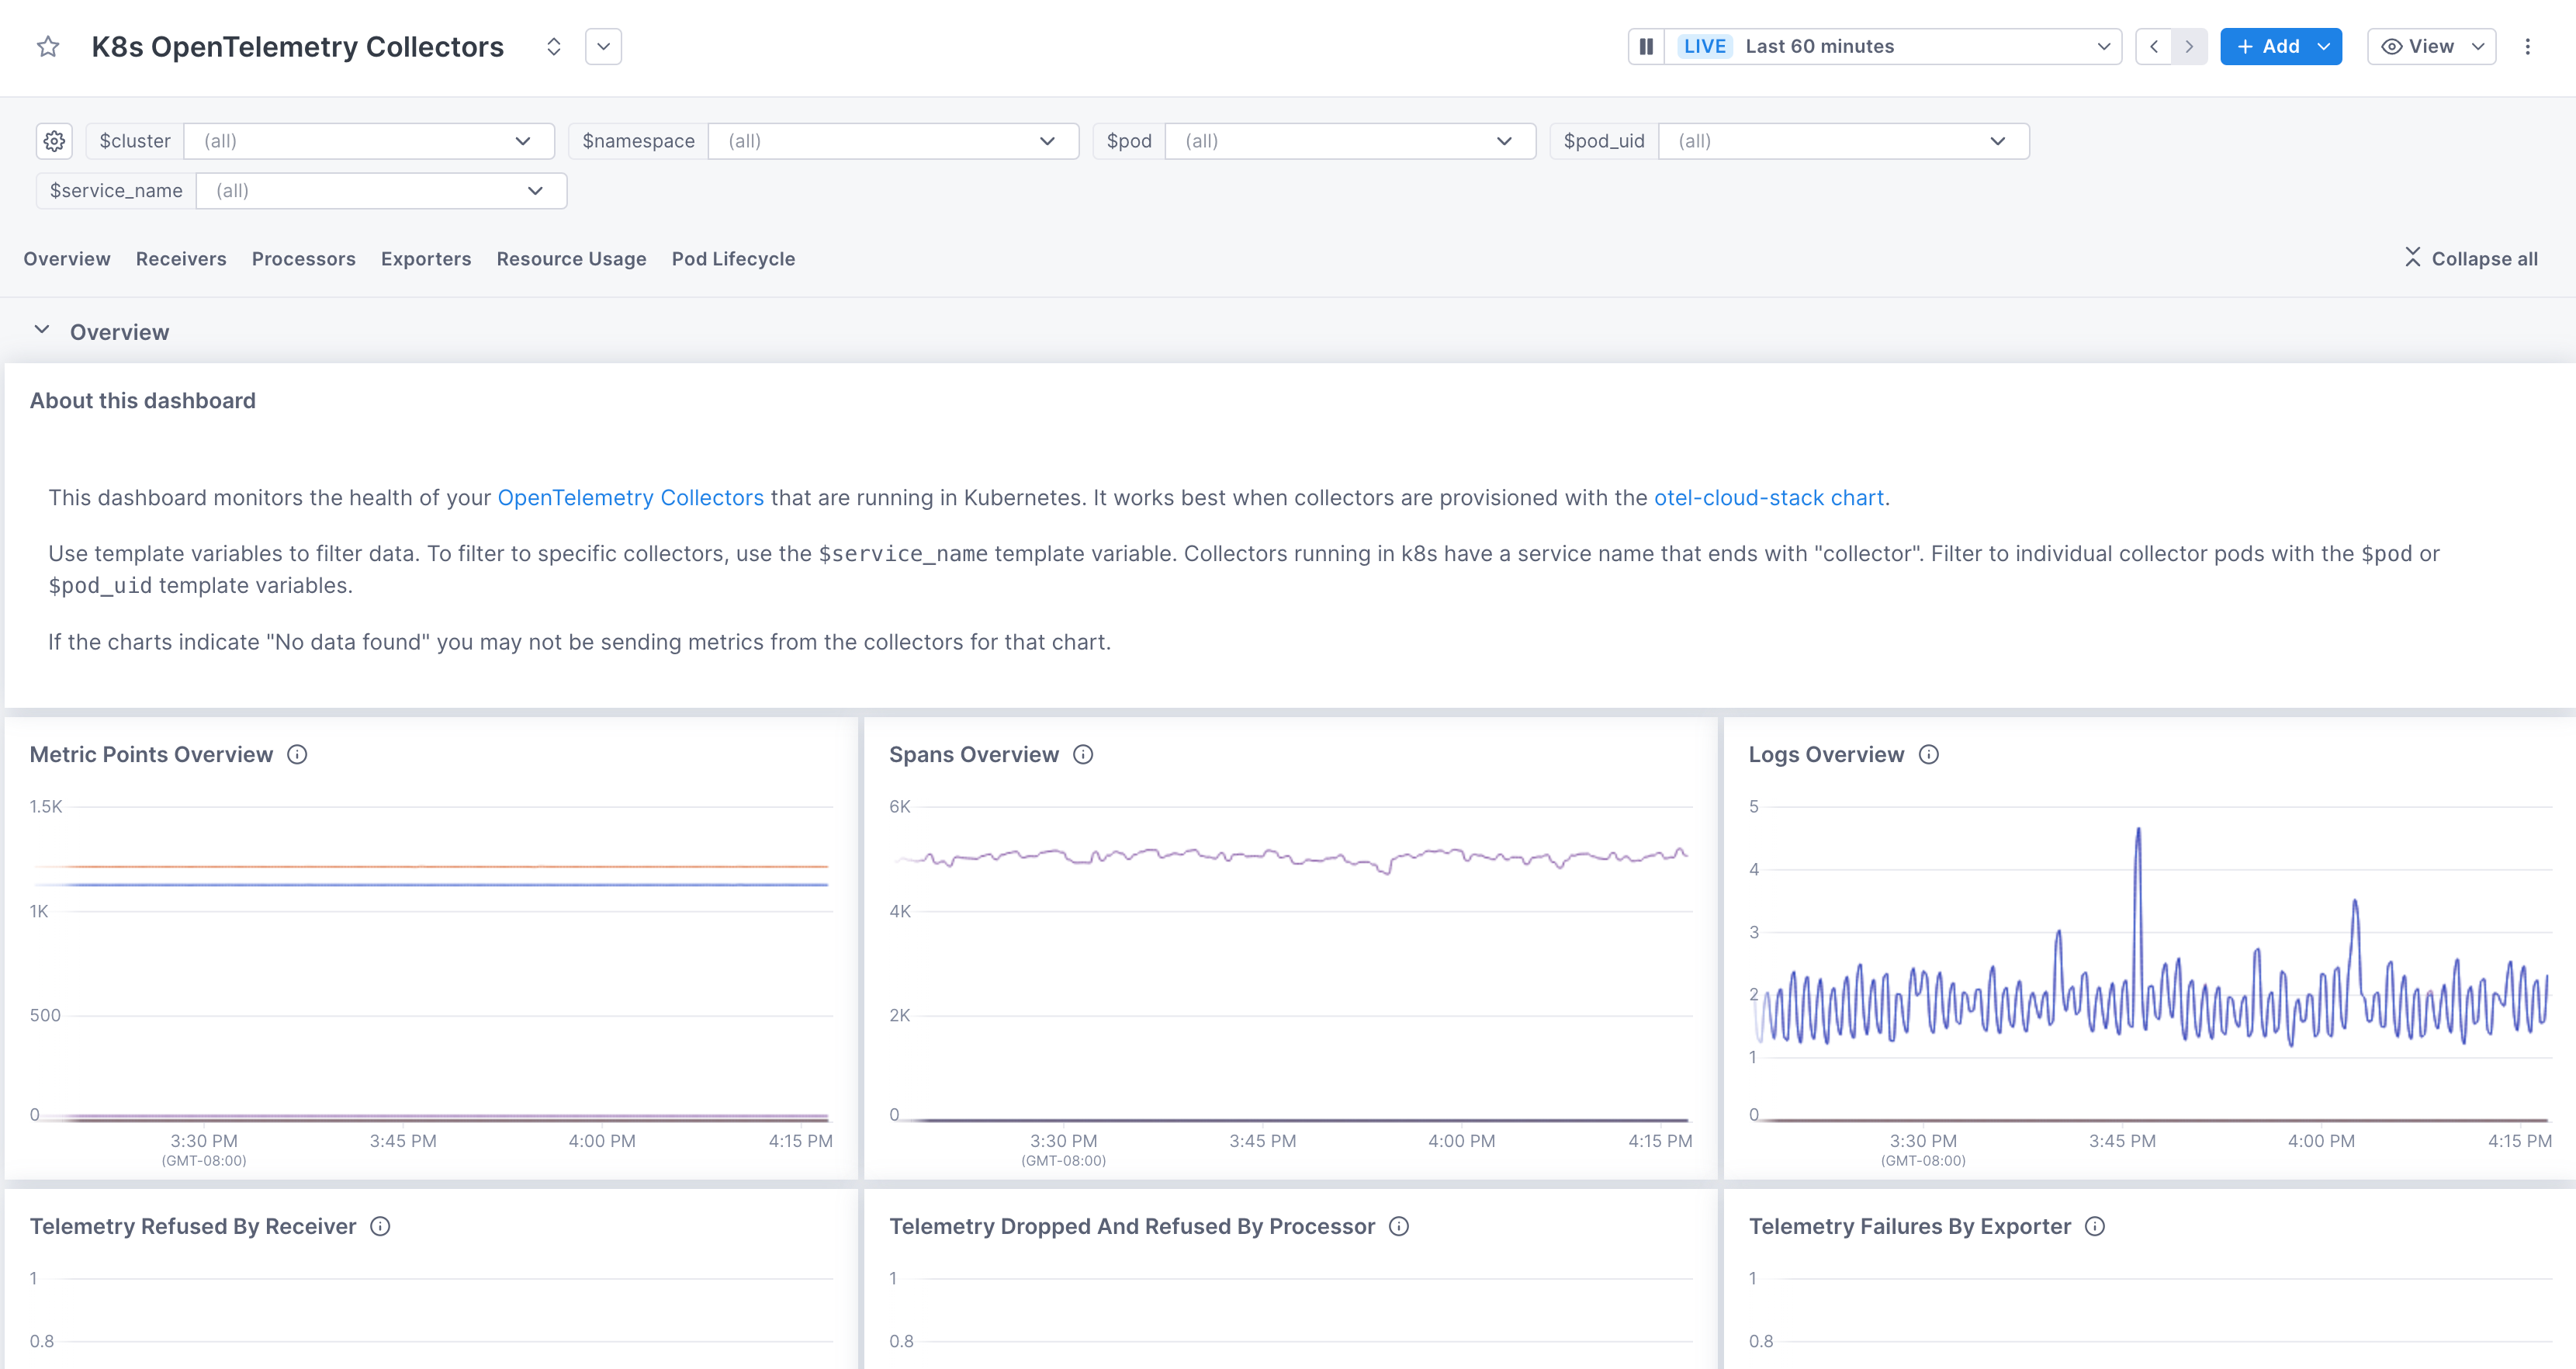
Cloud Observability offers pre-built dashboards you can use to start viewing your telemetry data. The K8s OpenTelemetry Collectors Dashboard allows you to view the health of your OpenTelemetry collectors and its associated metrics.
- In Cloud Observability, click the Dashboard icon to open the Dashboard view.
- Click Create a pre-built dashboard.
-
Select the Services tab and add the K8s OpenTelemetry Collectors.
The K8s OpenTelemetry Collectors dashboard uses template variables that allow you to view overall health, as well as health of a particular service. Choose a service (or services) from the $service dropdown to see data from a service.
- Click the expand icon to view a chart in detail, including the query used to create it. In charts with span data, click a dot in the chart to see a full trace from the exemplar span.
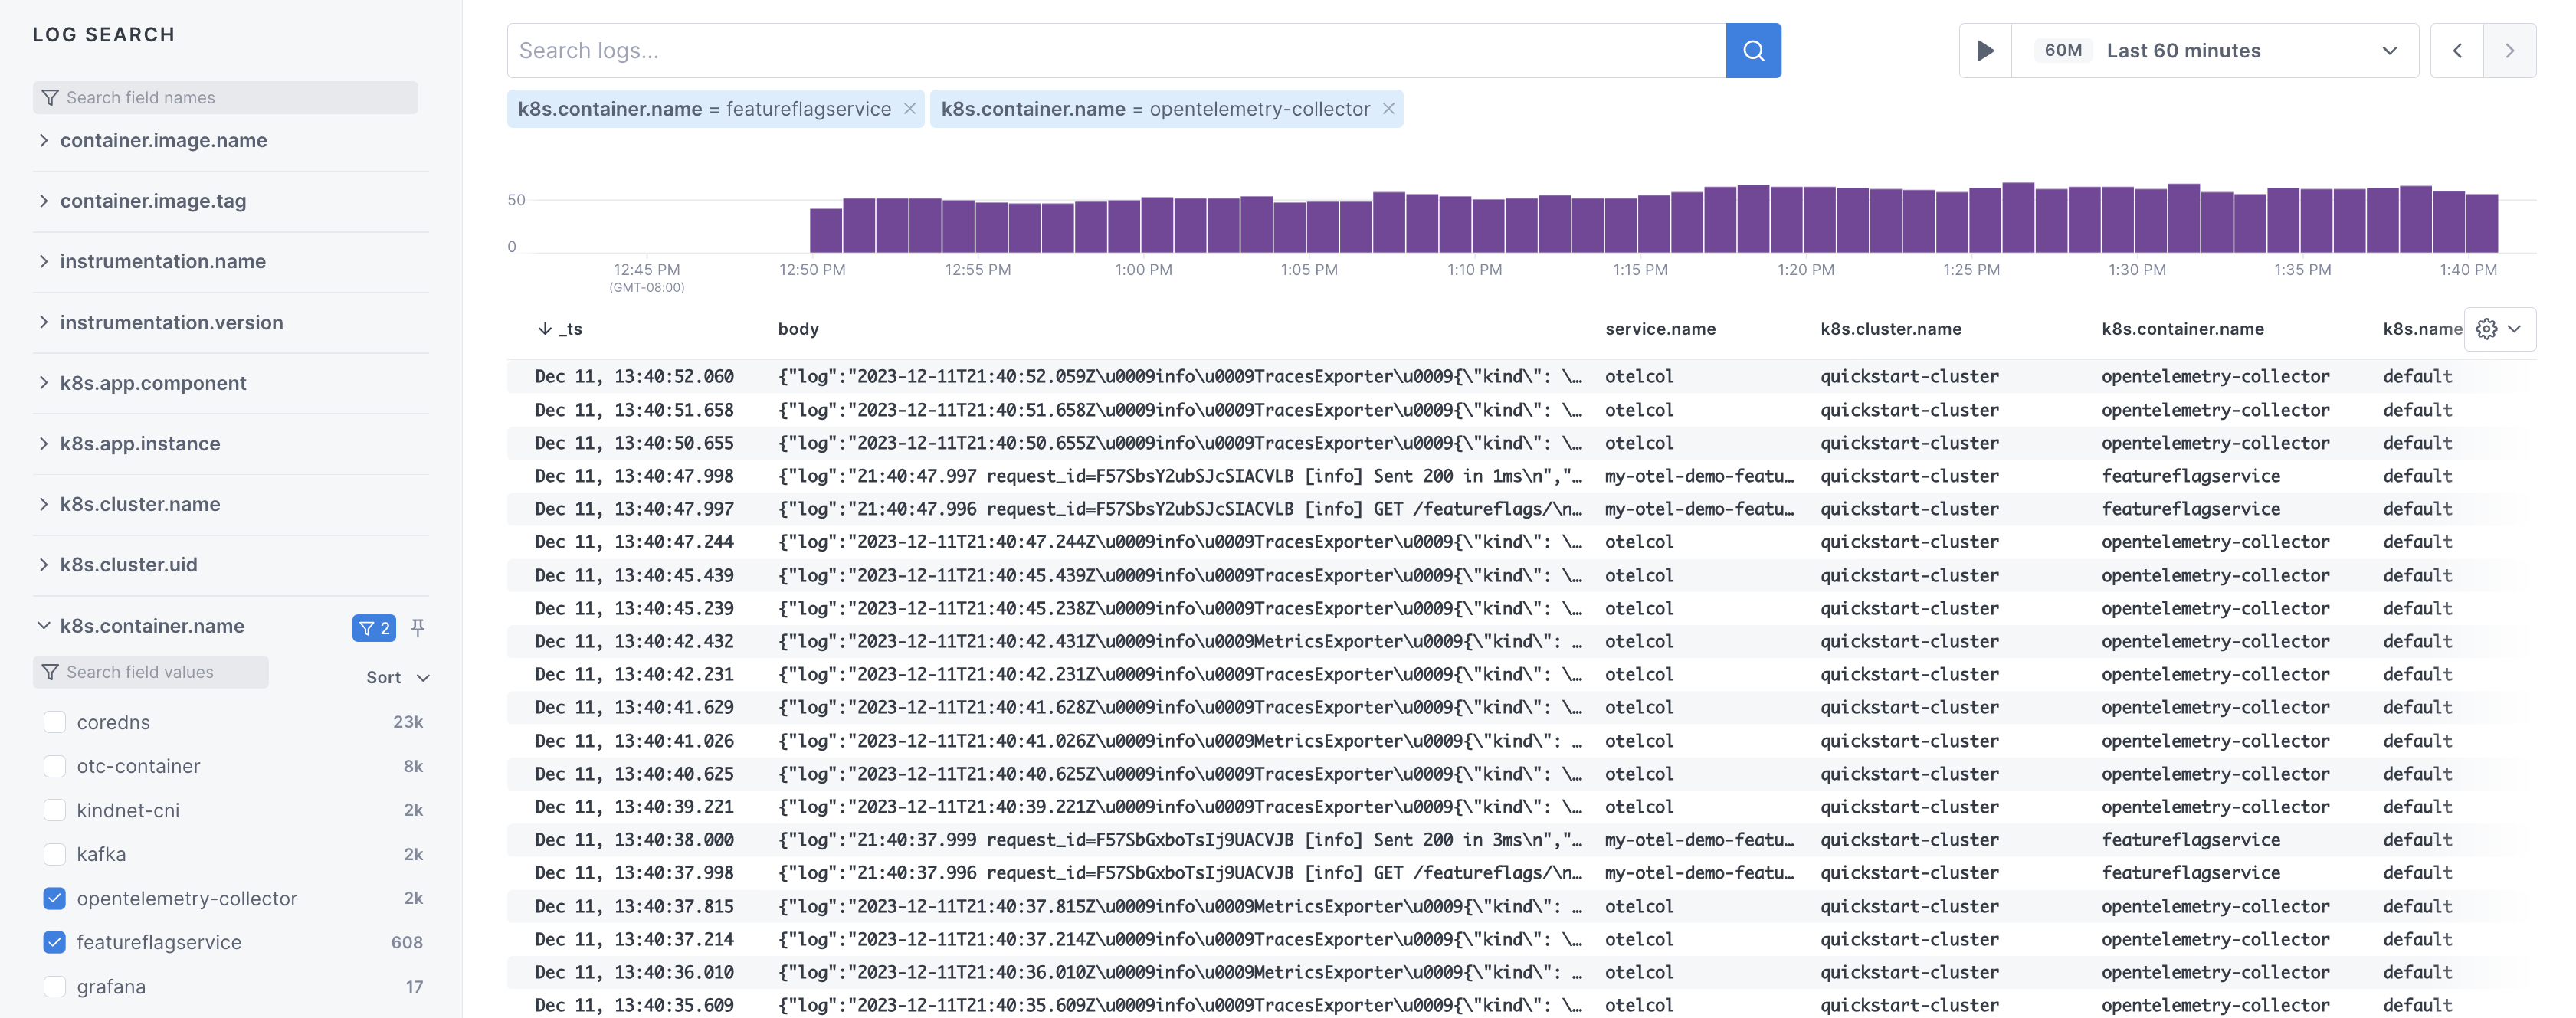
- To view logs, click the logs icon to open the logs view.
- Use the left navigation section to narrow down your logs based on each service. Look over k8s.container.name section and select the container names you want to see logs for.
Next steps
Now that you have telemetry data being sent to Cloud Observability, read the following topics to learn more about it:
And learn about other features in Cloud Observability to help you monitor and investigate your system.
Troubleshooting
The first thing you should do when troubleshooting collector issues is make sure data from your network can reach Cloud Observability. Your firewall or cloud configuration may be preventing a connection.
The default OTLP Exporter from a Collector enables gzip compression and TLS.
Depending on your network configuration, you may need to enable or disable
certain other gRPC features. This
page
contains a complete list of configuration parameters for the Collector gRPC
client.
In the event that you are unable to establish a connection to the Cloud Observability
platform, you can use curl to verify HTTP/2 connectivity to our collectors.
Run the following command, replacing <YOUR_ACCESS_TOKEN> with your project’s
access token:
1
2
curl -D- -XPOST --http2-prior-knowledge -H "lightstep-access-token: <YOUR_ACCESS_TOKEN>" https://ingest.lightstep.com/access-test # US data center
# curl -D- -XPOST --http2-prior-knowledge -H "lightstep-access-token: <YOUR_ACCESS_TOKEN>" https://ingest.eu.lightstep.com/access-test # EU data center
You should see the following output, or something similar:
1
2
3
4
5
6
7
HTTP/2 200
content-length: 2
content-type: text/plain
date: Thu, 09 May 2024 15:39:14 GMT
server: envoy

OK
If you do not see this output, or the request hangs, then something is blocking HTTP2 traffic from transiting your network to ours.
If you see HTTP/2 401, your request succeeded, but your token was not accepted.
Some things to check:
- Validity of your access token.
- Ensure proxies are passing through the
lightstep-access-tokenheader.
Alternatively, to exercise the full gRPC request/response cycle, you can try emitting a single span to your project using the otel-cli tool. Refer to this example image and commands for running the CLI tool in Kubernetes and Docker on GitHub. Only send test spans to a non-production project.
For additional troubleshooting recommendations, see Troubleshooting Missing Data in Cloud Observability.
See also
Use the OpenTelemetry Collector
Quickstart Kubernetes: Collector and Operator
Updated Jun 6, 2025