
Cloud Observability offers scatter plots for spans_sample queries.
This page describes spans_sample queries and shows several examples.
The content is for anyone looking to query and learn about their trace data.
Query overview
spans_sample queries are part of Cloud Observability’s Unified Query Language (UQL),
and they work with trace data.
spans_sample queries give you contextual, trace-level insights into your data.
They let you filter on a span attribute, and then further filter on attributes across that span’s trace.
With spans_sample queries, you can:
- Explore latency issues within traces.
- Find every service involved in a trace.
- Gain insights into traces with asynchronous transactions.
- Investigate specific spans from a customer-specific trace, even if the customer attribute is on a different span.
You can use spans_sample queries in notebooks or dashboards.
And Cloud Observability visualizes the output in scatter plots.
UQL supports spans and spans_sample queries.
The queries have different approaches to trace data:
spans |
spans_sample |
|
|---|---|---|
| Visualizations | Visualize unsampled time series in line charts. | Visualize sampled spans in scatter plots. |
| Query behavior | Operate on specific spans. | Operate on whole traces. |
This diagram uses a simplified case to highlight the query-behavior difference:
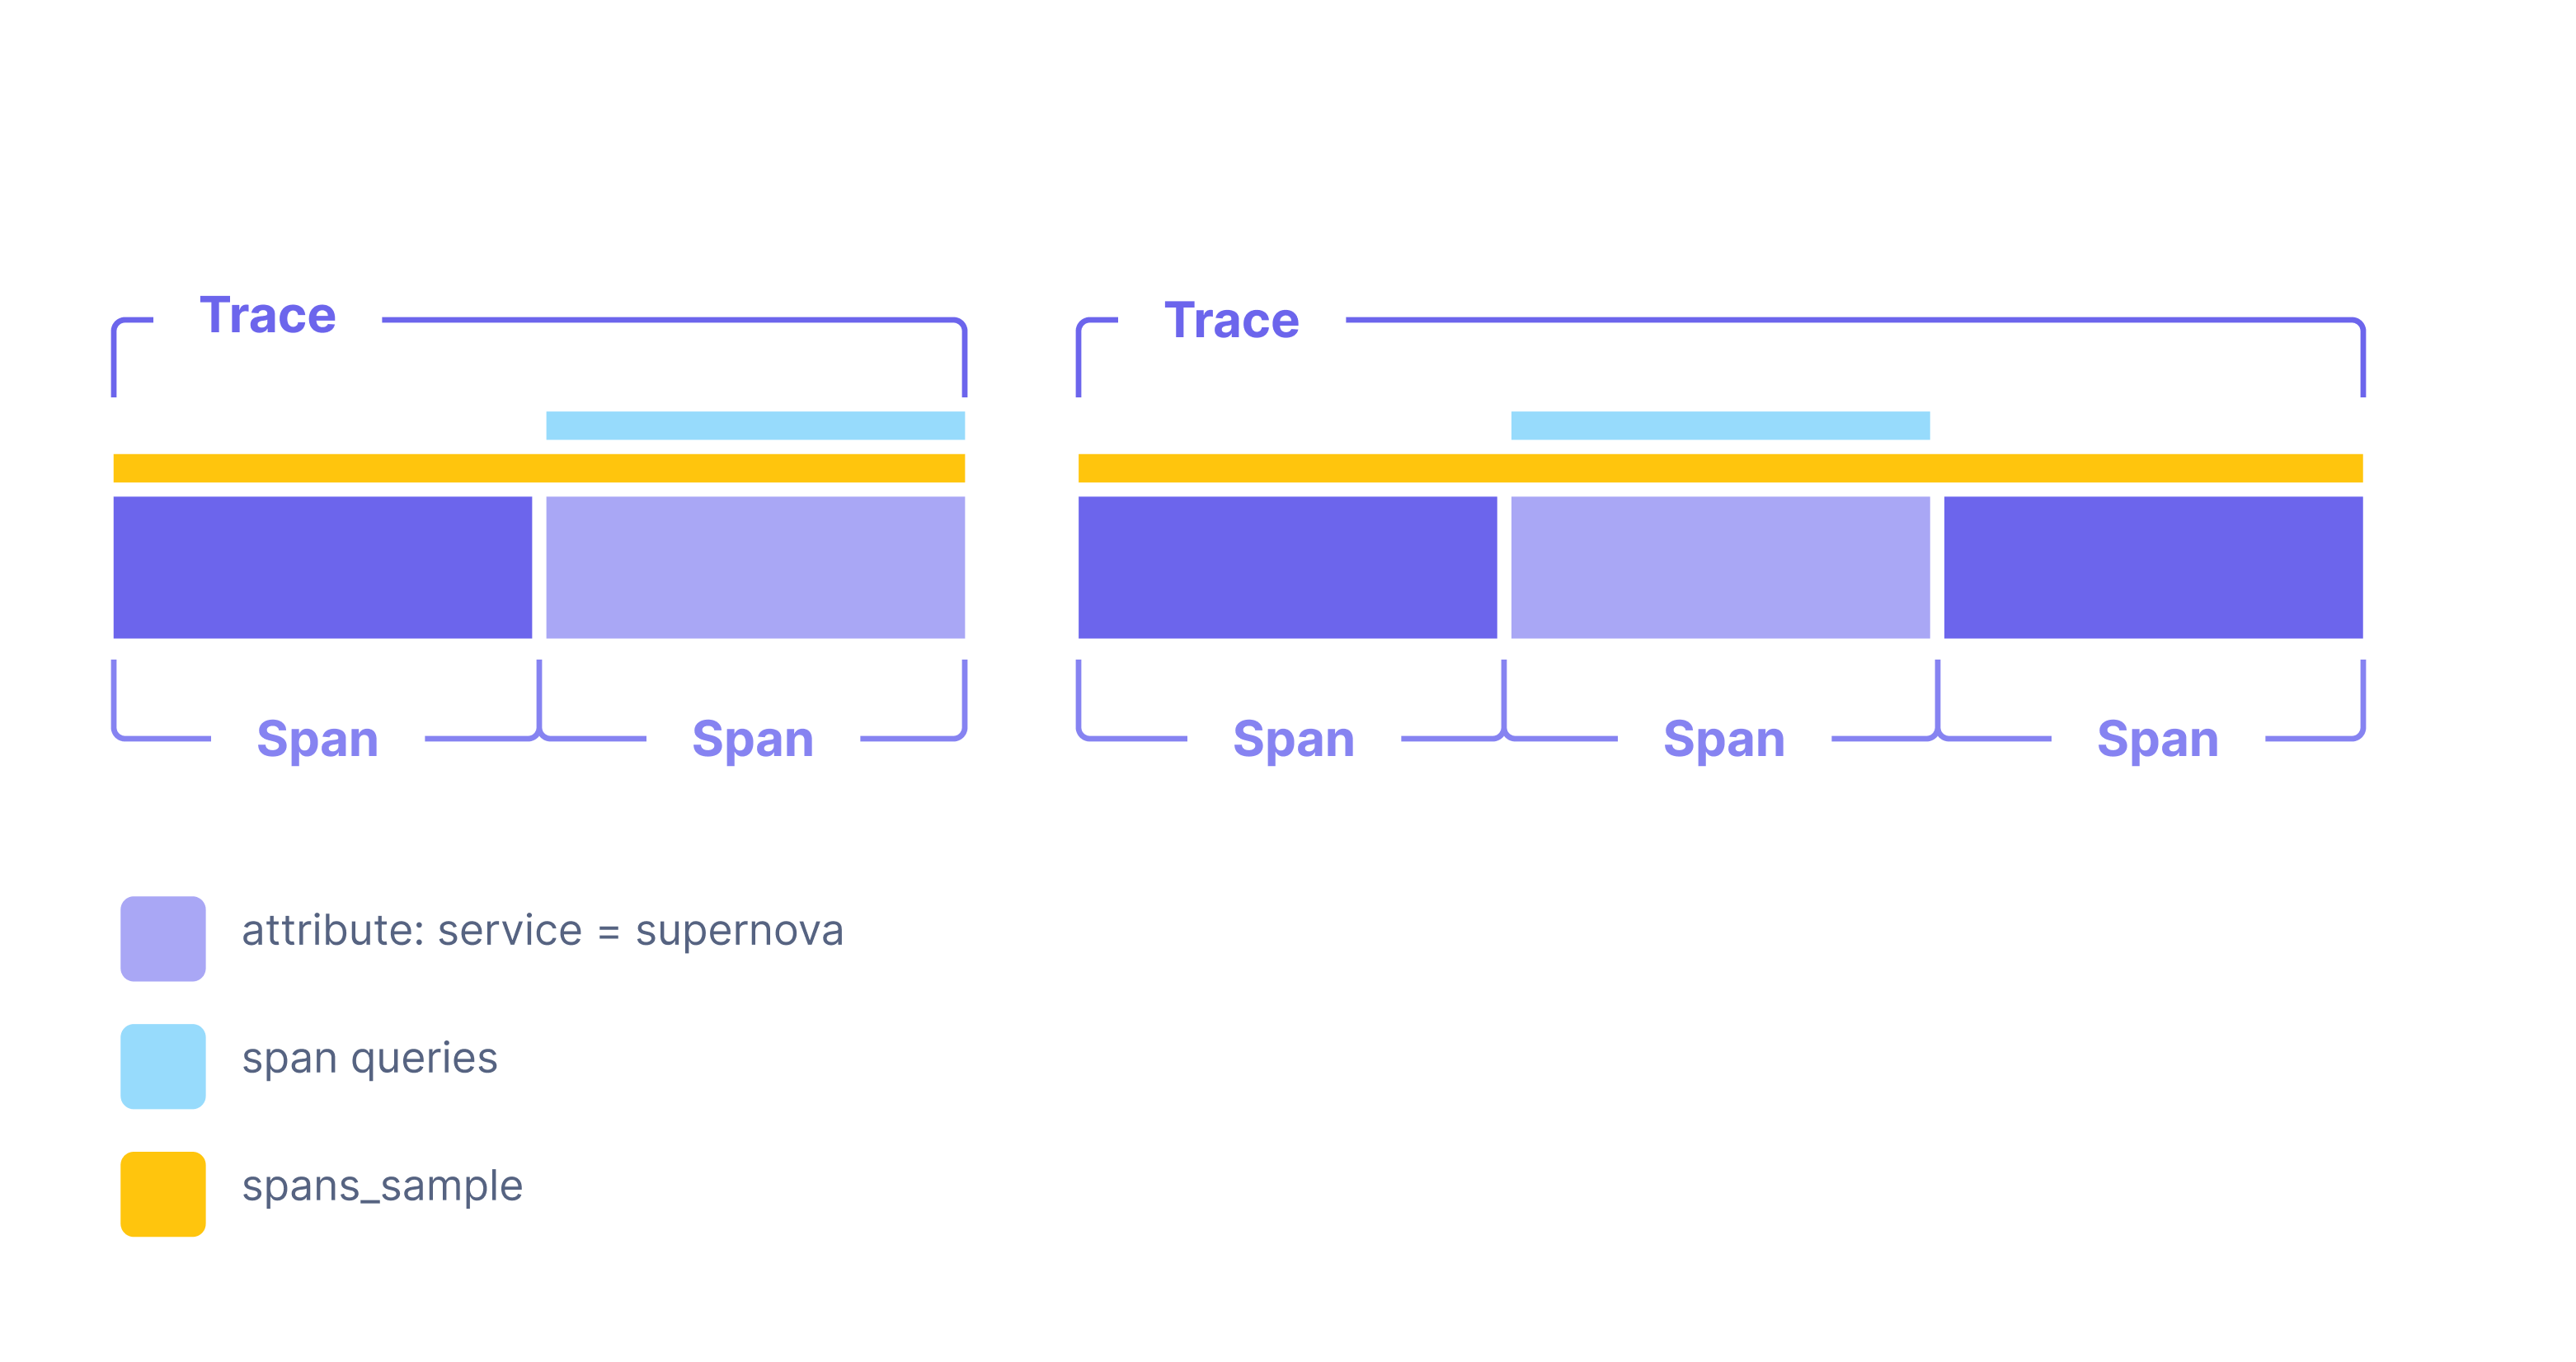
The diagram has two traces.
The first trace has two spans, and one span has the service == supernova attribute.
The second trace has three spans, and one span has the service == supernova attribute.
spans and spans_sample queries give you different insights into that data:
spansqueries only operate on the two spans whereservice == supernova.spans_samplequeries operate on the twoservice == supernovaspans and the other three spans.
spans_sample queries focus on the whole trace, giving you more contextual insights into your data.
Example queries and scatter plots
This section shows several spans_sample examples.
The examples use notebooks, but you can also run the queries in dashboards.
View trace-level data
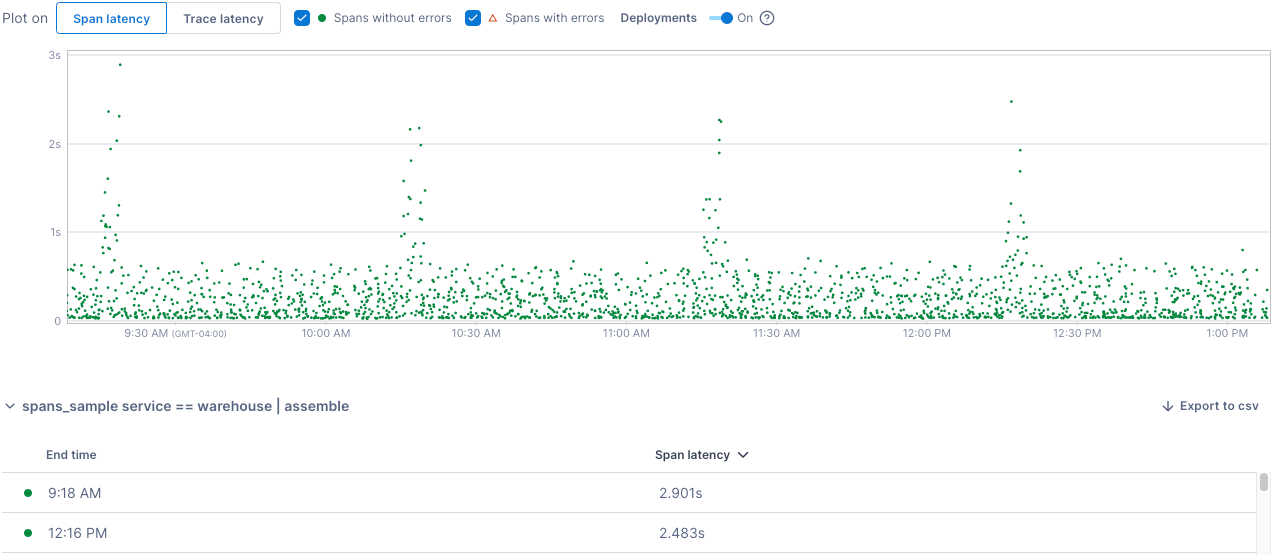
This query returns spans from traces where at least one span has the service == warehouse attribute:
1
spans_sample service == warehouse | assemble
The scatter plot below visualizes the results. By default, the chart and table show Span latency, the time it takes the span to complete its task. Select Trace latency to view the end-to-end latency of a span’s trace.
View service impact
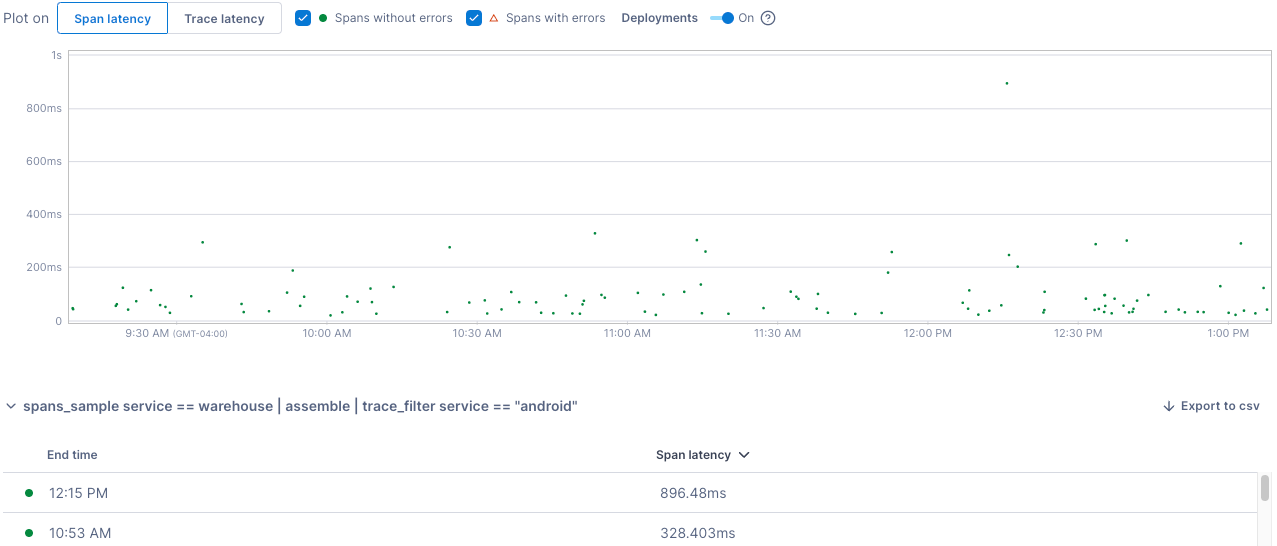
This query returns spans for one service (warehouse) filtered to spans from traces where at least one span has the android service:
1
spans_sample service == warehouse | assemble | trace_filter service == "android"
The scatter plot below visualizes the results. By default, the chart and table show Span latency, the time it takes the span to complete its task. Select Trace latency to view the end-to-end latency of a span’s trace.
View customer impact
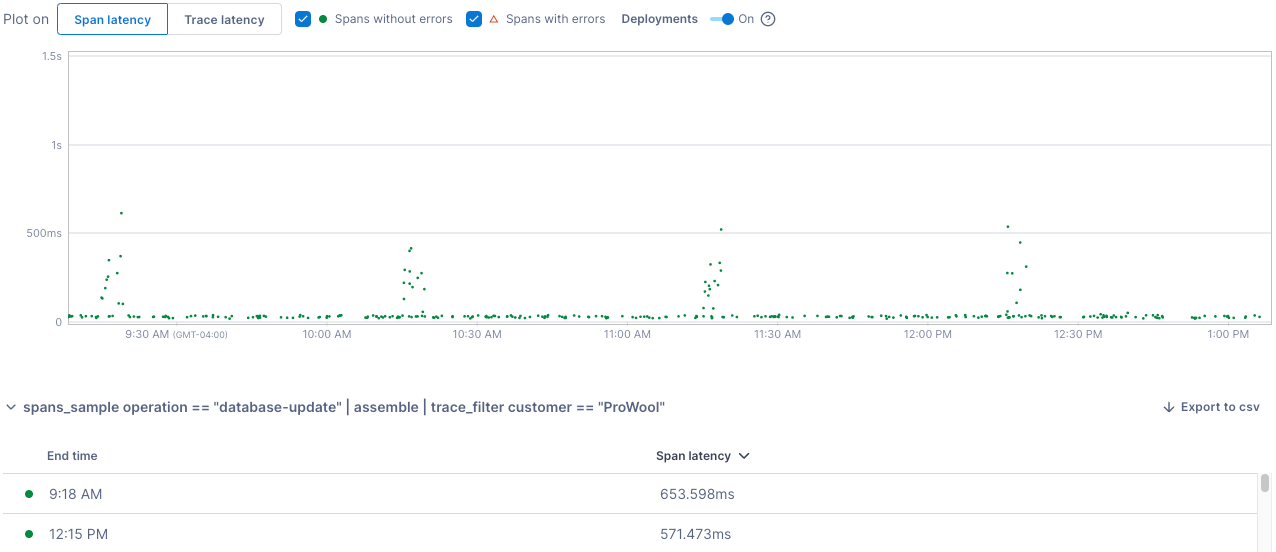
The query below returns spans for an operation (database-update) filtered to spans from traces where at least one span has the ProWool customer.
The query helps you filter for results containing a desired attribute when that attribute doesn’t appear on spans matching your query.
1
spans_sample operation == "database-update" | assemble | trace_filter customer == "ProWool"
The scatter plot below visualizes the results. By default, the chart and table show Span latency, the time it takes the span to complete its task. Select Trace latency to view the end-to-end latency of a span’s trace.
View all services
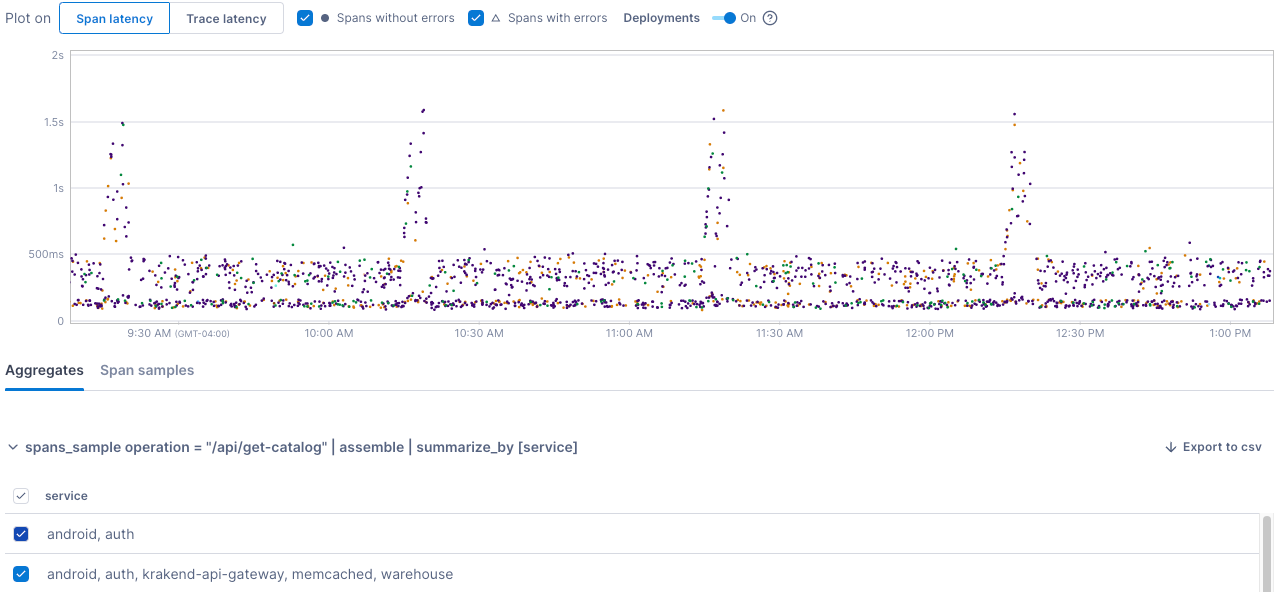
This query uses summarize_by to return all services related to an operation (/api/get-catalog):
1
spans_sample operation = "/api/get-catalog" | assemble | summarize_by [service]
The scatter plot below visualizes the results. By default, the chart and tables show Span latency, the time it takes the span to complete its task. Select Trace latency to view the end-to-end latency of a span’s trace.
For summarize_by queries, Cloud Observability displays query results in two tables:
Aggregates
Each row in the service column shows an unordered list of services involved in that trace.
For example, in the image below, one trace with operation = "/api/get-catalog" involves these services: android and auth.
And another trace involves five different services.
Span samples
Each row shows the End time and latency for a span that started the trace and where operation = "/api/get-catalog".
The service column shows an unordered list of services involved in that span’s trace.
Next, visit the links below to learn more about UQL, data visualization, and spans queries.
See also
Get started with spans queries in UQL
Updated Jun 28, 2023