
Cloud Observability collects and analyzes telemetry data across infrastructure, application, runtime, cloud, and other third-party services. By unifying logs, metrics, and traces into one workflow, you can make connections across telemetry types and systems, detect and mitigate changes faster, and gain visibility into distributed systems. If you are interested, learn more about how Cloud Observability works.
This Quickstart demonstrates how to use the OpenTelemetry Collector (contrib release) to send infrastructure metrics, application traces, and logs to Cloud Observability using Collector general guidelines. For usage in production environments, we recommend our users to build their own distribution.
Prerequisites
- A virtual machine running Linux
- A Cloud Observability account
- A Cloud Observability access token for the Cloud Observability project you would like to use
Verify your setup
Determine the OS system version currently running:
1
cat /etc/os-release
Install the OpenTelemetry Collector
- Visit the Collector contrib repo to determine the correct install package and version for your OS system.
-
Run the following command to download and install the Collector, replacing the version and package with appropriate values, based on Step 1.
1
2
3
 https://github.com/open-telemetry/opentelemetry-collector-releases/releases/download/<VERSION>/otelcol-contrib_<PACKAGE_NAME>

 sudo dpkg -i otelcol-contrib_
This example shows the command for Linux Debian/Ubuntu:
1
2
3
 https://github.com/open-telemetry/opentelemetry-collector-releases/releases/download/v0.104.0/otelcol-contrib_0.104.0_linux_amd64.deb

 sudo dpkg -i otelcol-contrib_0.104.0_linux_amd64.deb
-
Edit the Collector config file (
config.yaml) for your environment following our guidelines to ensure you get the most out of Cloud Observability.1
vi /etc/otelcol-contrib/config.yaml
When using Vim, use
:%dto delete all lines of a file in one command.Set the OTLP receiver endpoints for GRPC and HTTP using the default values of
0.0.0.0:4317and0.0.0.0:4318respectively:1 2 3 4 5 6 7 8 9
otlp: # OTLP is the default protocol supported by all language implementations. # For more details, see # https://github.com/open-telemetry/opentelemetry-collector/blob/main/receiver/otlpreceiver/README.md protocols: grpc: endpoint: 0.0.0.0:4317 http: endpoint: 0.0.0.0:4318
-
Set environment variables for the access token created in the Prerequisites:
1
 export LIGHTSTEP_ACCESS_TOKEN=<your-access-token>
-
Run the following command to verify the environment variables:
1
 echo $LIGHTSTEP_ACCESS_TOKEN
-
Kill all OpenTelemetry process for a clean start with the new configuration:
1
pkill -f otel -
Run the Collector with the new configuration:
1
 /usr/bin/otelcol-contrib --config=file:/etc/otelcol-contrib/config.yaml
See telemetry data in Cloud Observability
-
To view metrics, in Cloud Observability, create a pre-built dashboard. The Host Metrics dashboard is a good place to start.
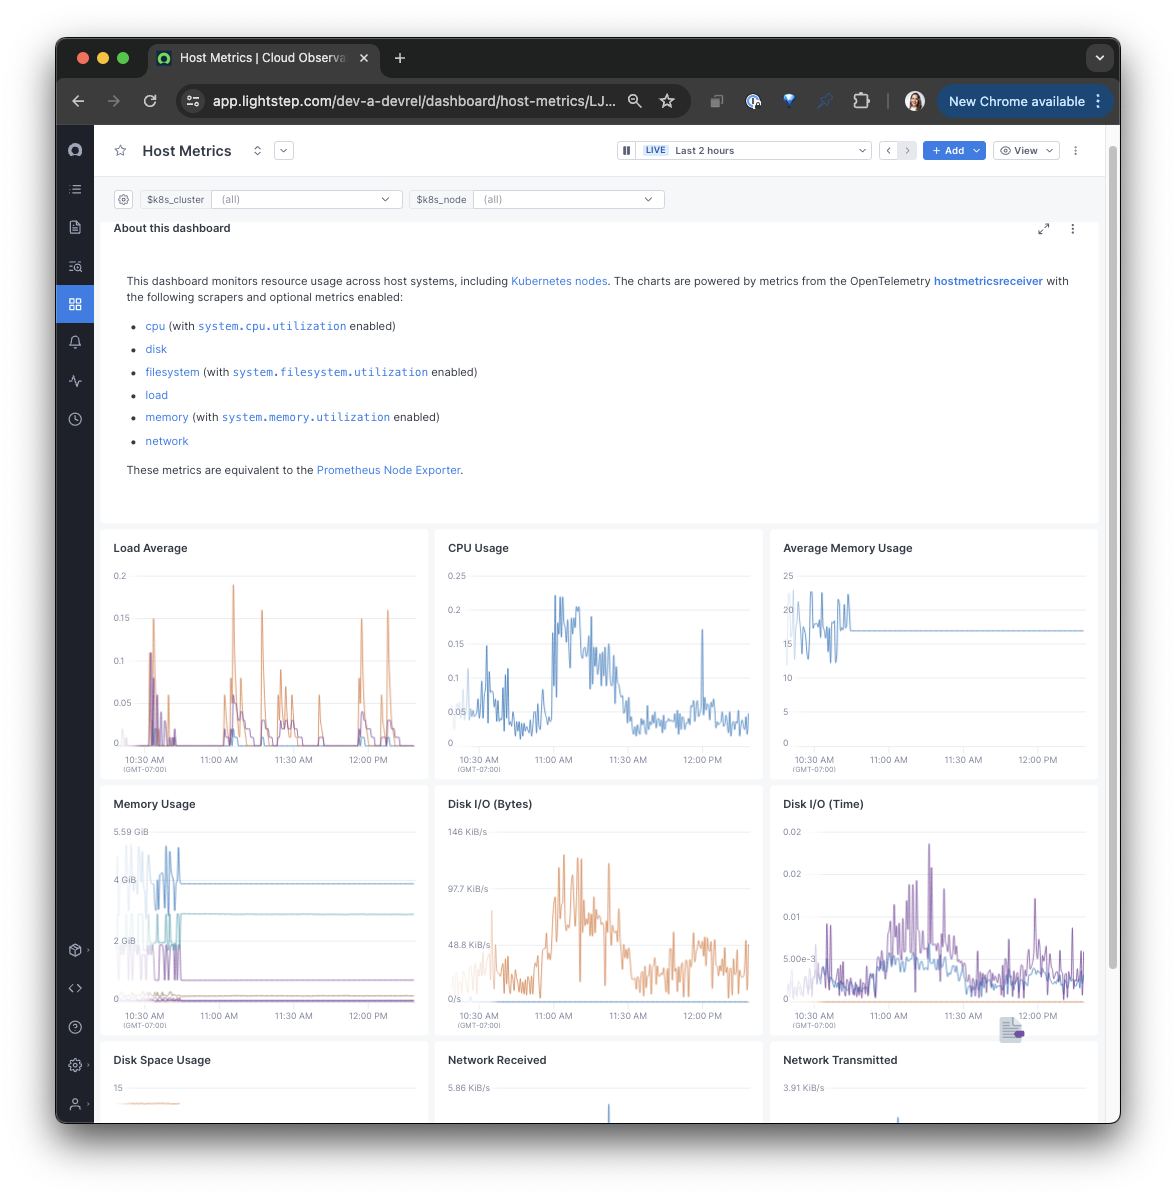
You can also view the metrics currently reporting to Cloud Observability from the Metrics details settings page.
-
If you’ve already instrumented your application services with OpenTelemetry, you can view the performance of these services from the Service directory. You might also want to create a Service Health dashboard.
See Monitoring an application for information about adding tracing to your services.
If you want to use demo data instead, you can install the OpenTelemetry demo. Skip the step for configuring the Collector - you’ve already done that! -
View logs from the Log view.
Troubleshooting
If you don’t see data in Cloud Observability run the following commands to determine what OpenTelemetry processes are/are not running and the ports being used.
Check running OpenTelemetry processes
1
ps ax  | grep otel
To kill all processes, run pkill -f otel.
Check ports in use
1
netstat -tulpn
Check what process a port is used for
This command is checking port 4318.
1
lsof -i :4318
Check the Collector logs
1
sudo journalctl -u otelcol-contrib -f
See also
Use the OpenTelemetry Collector
Updated Jul 31, 2024