
Use pre-built Kubernetes dashboards
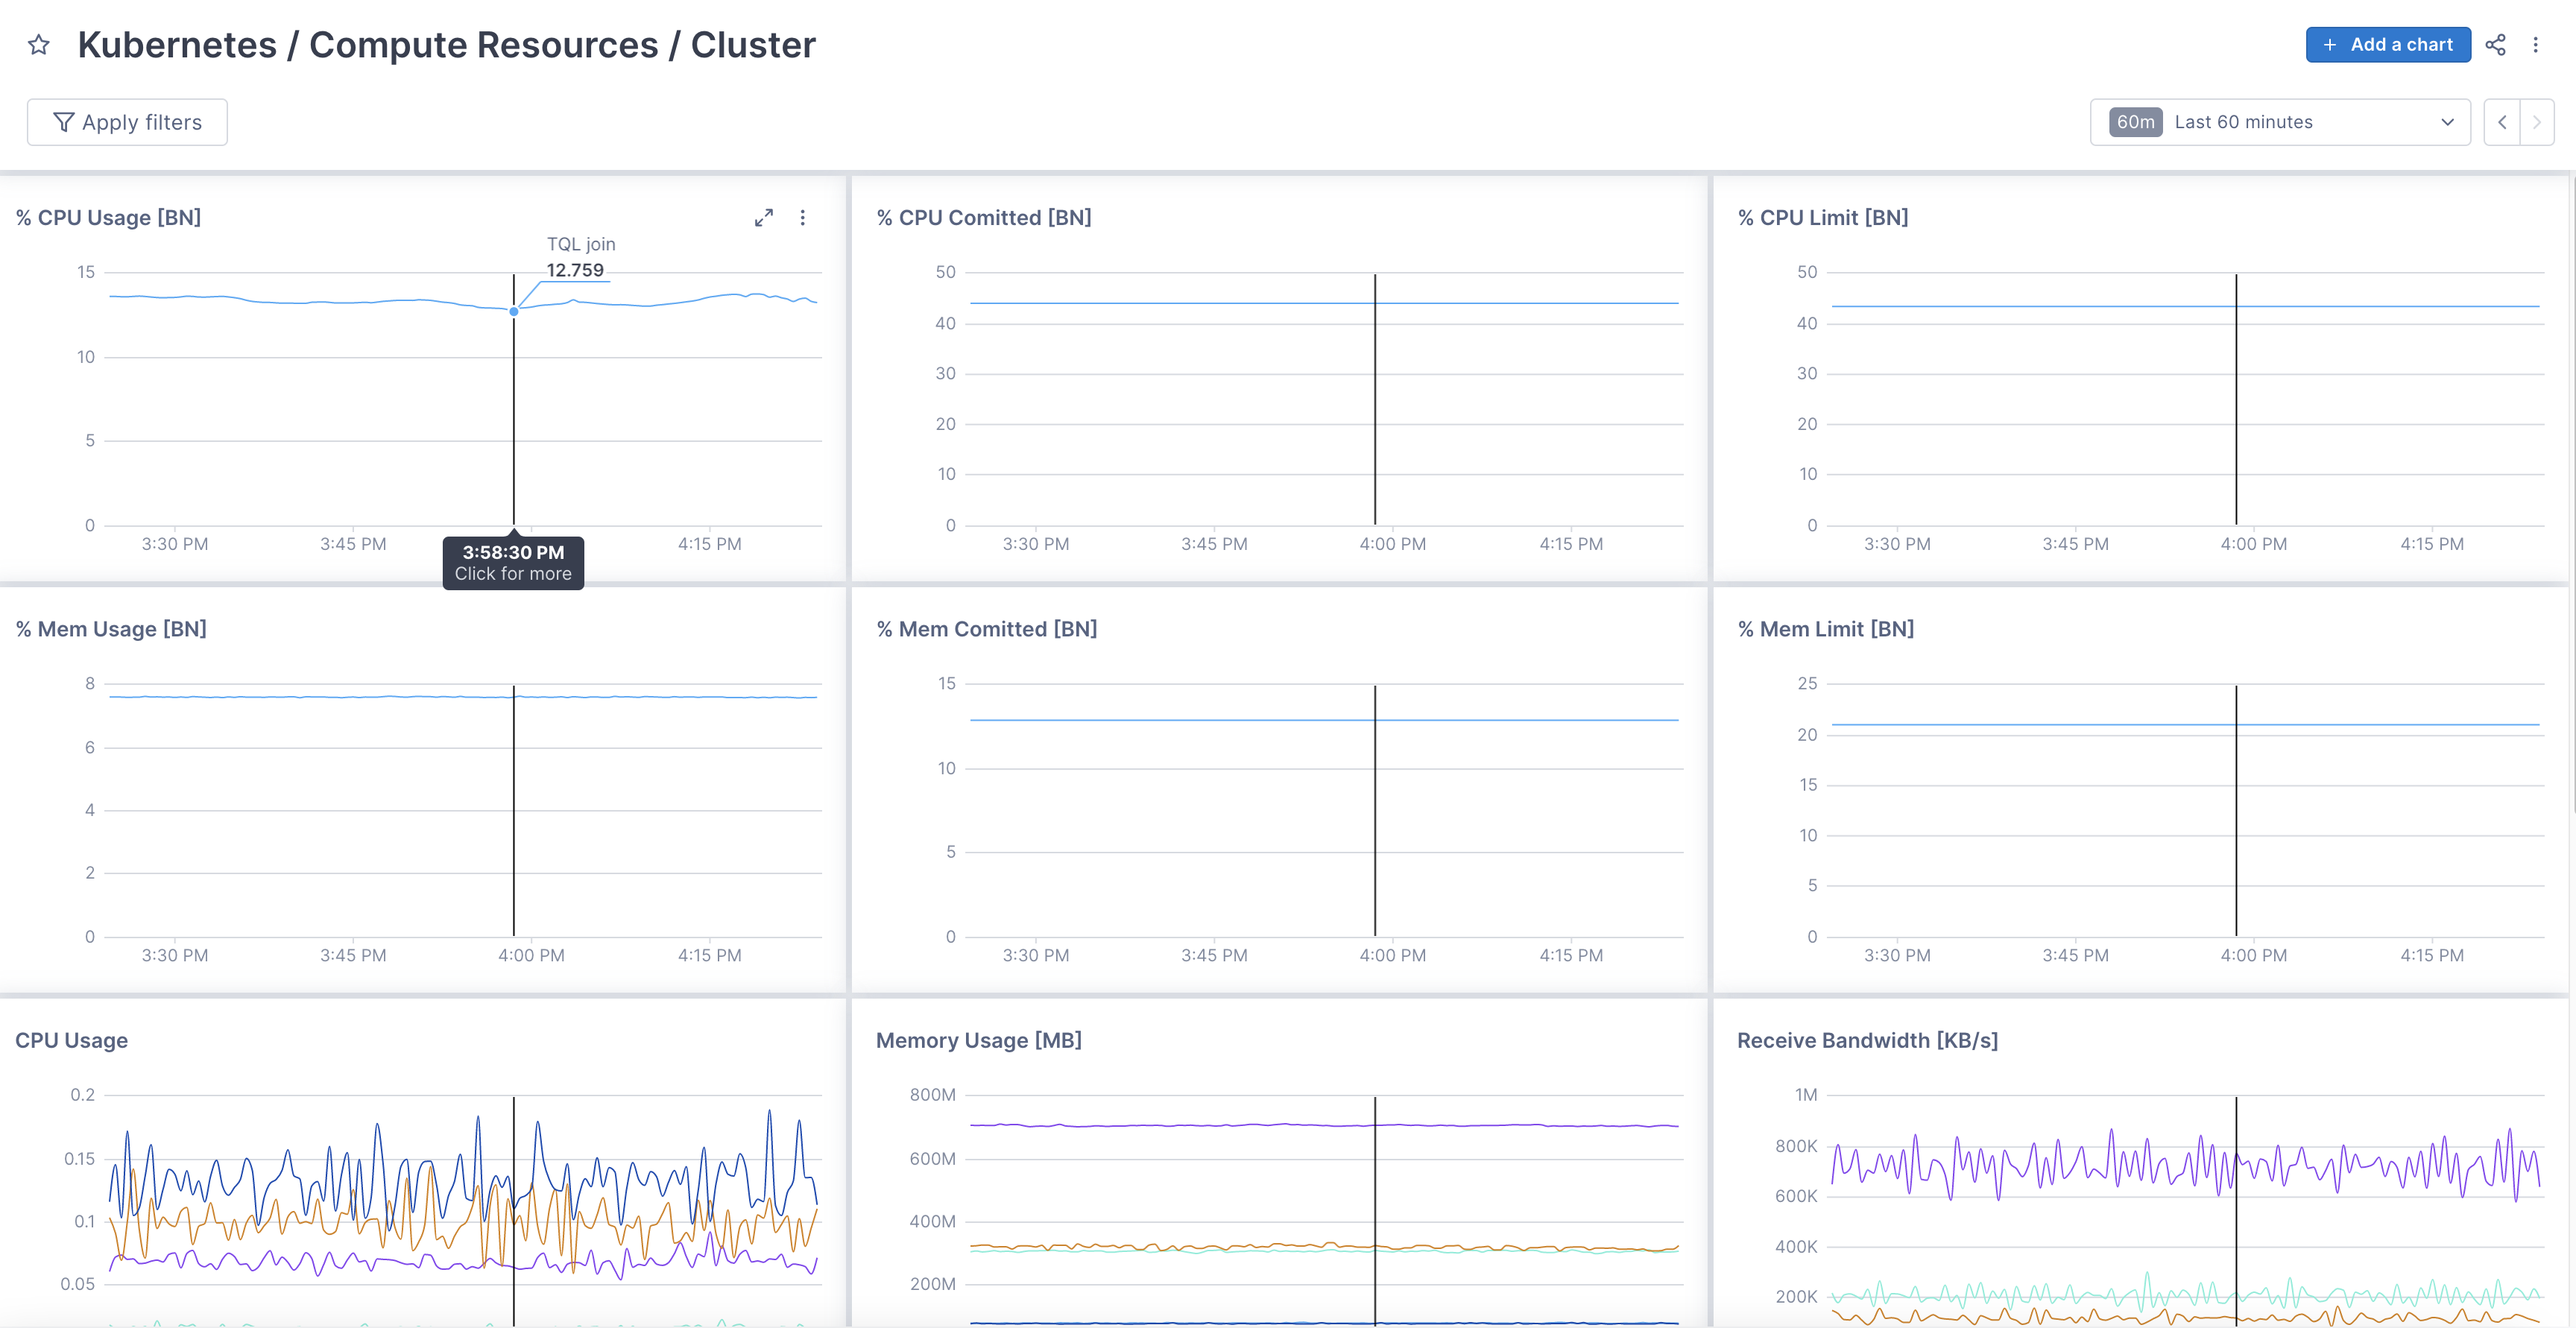
Cloud Observability provides pre-built Kubernetes dashboards using our Terraform provider. These modules allow you to monitor your overall cluster health as well as workloads running on the cluster using metrics such as CPU/memory usage, CPU/memory limits, network usage, and IOPS.
The Kubernetes modules are currently in beta.
Prerequisites
- Familiarity with:
Requirements
- An OpenTelemetry Collector scraping the
kube-state-metricsof your Kubernetes cluster. Please see our recommended deployment setup for instructions. - The namespaces and workloads running on your cluster.
You can quickly retrieve the namespaces and workloads running on your cluster using the following commands:
% kubectl get deployment,daemonset,statefulset -A | awk ‘{print $1 $2}’
% kubectl get deployment,daemonset,statefulset -A -o jsonpath='{range .items[*]}namespace:{@.metadata.namespace} workload:{@.metadata.name}{"\n"}{end}'
Deploying the Kubernetes modules
Follow the instructions for using the Cloud Observability Terraform Provider, specifically the instructions for using unpublished modules.
You can find examples and complete setup instructions in the Github repository.
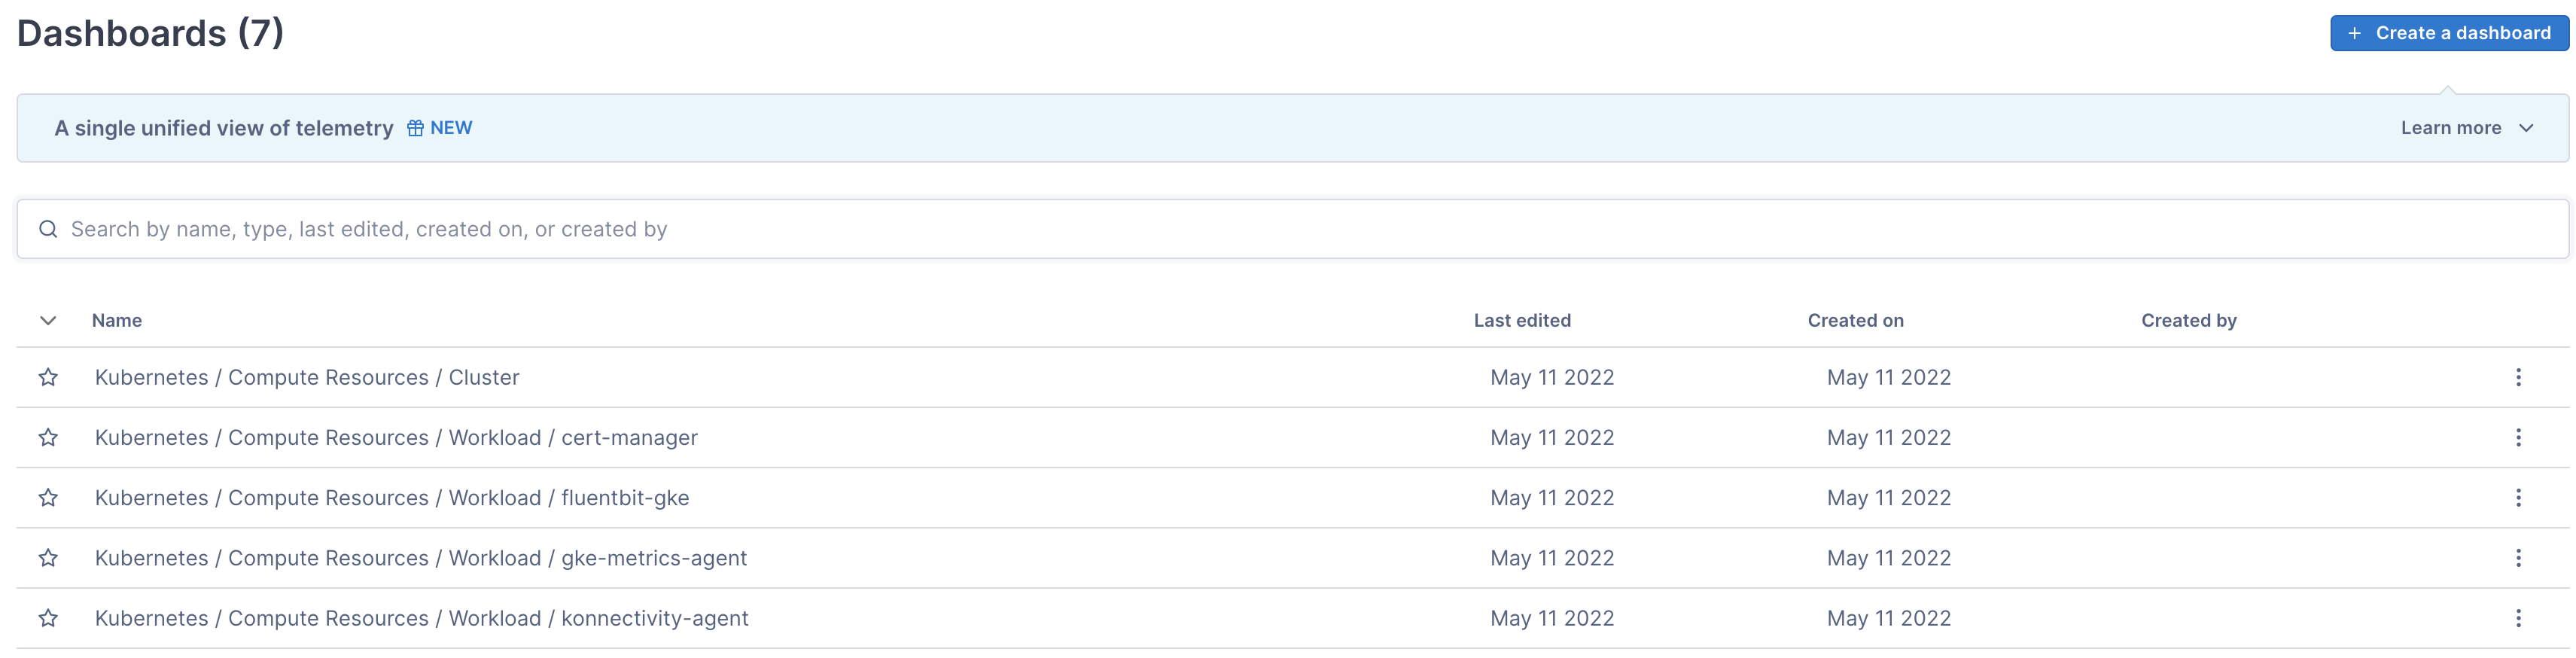
Once complete you will have a number of Kubernetes dashboards, including a comprehensive dashboard that uses template variables, giving you one dashboard where you can view multiple pods, namespaces, and nodes from the same dashboard. 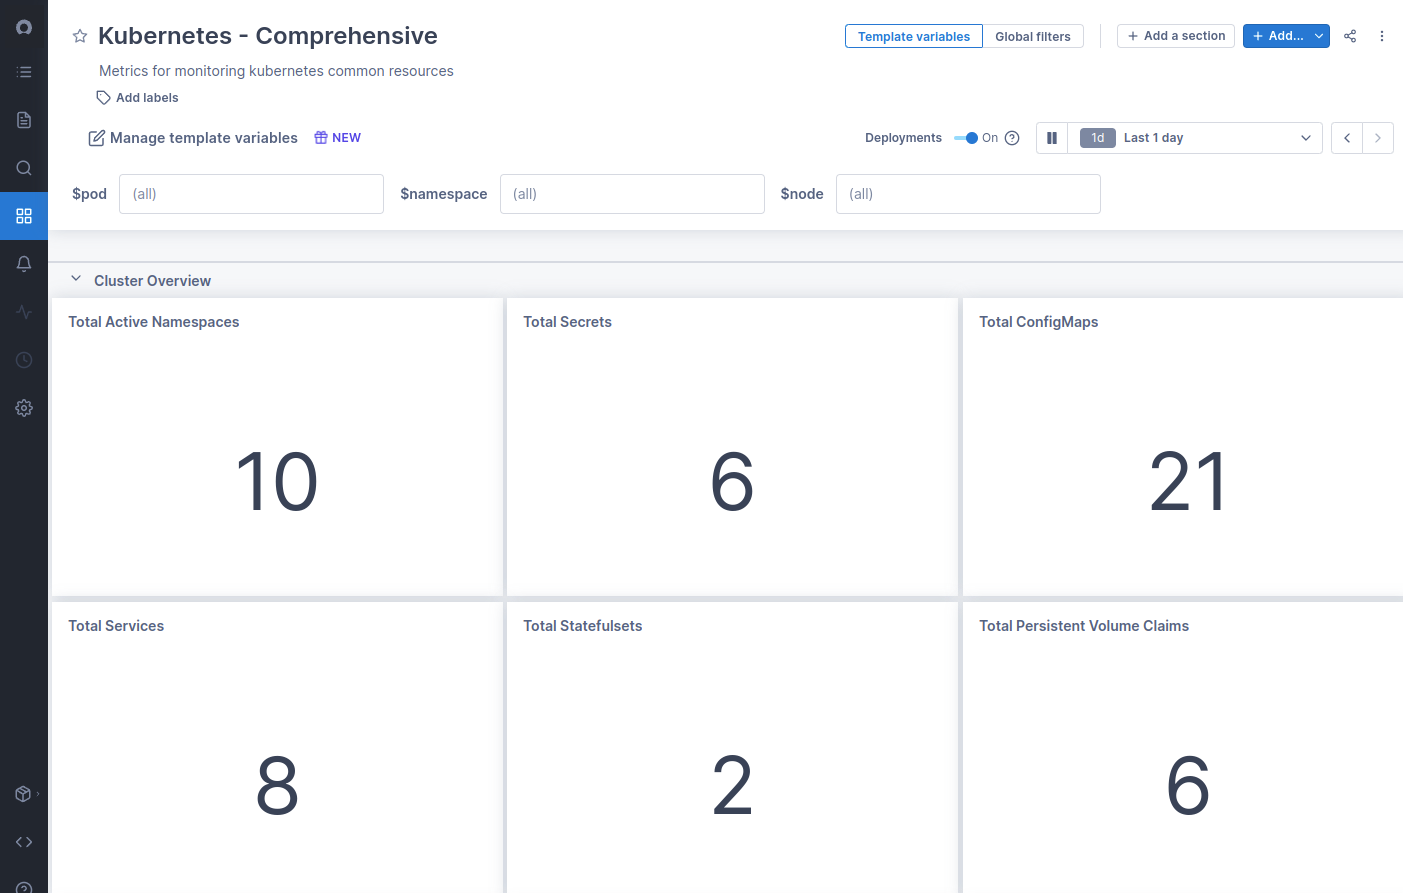
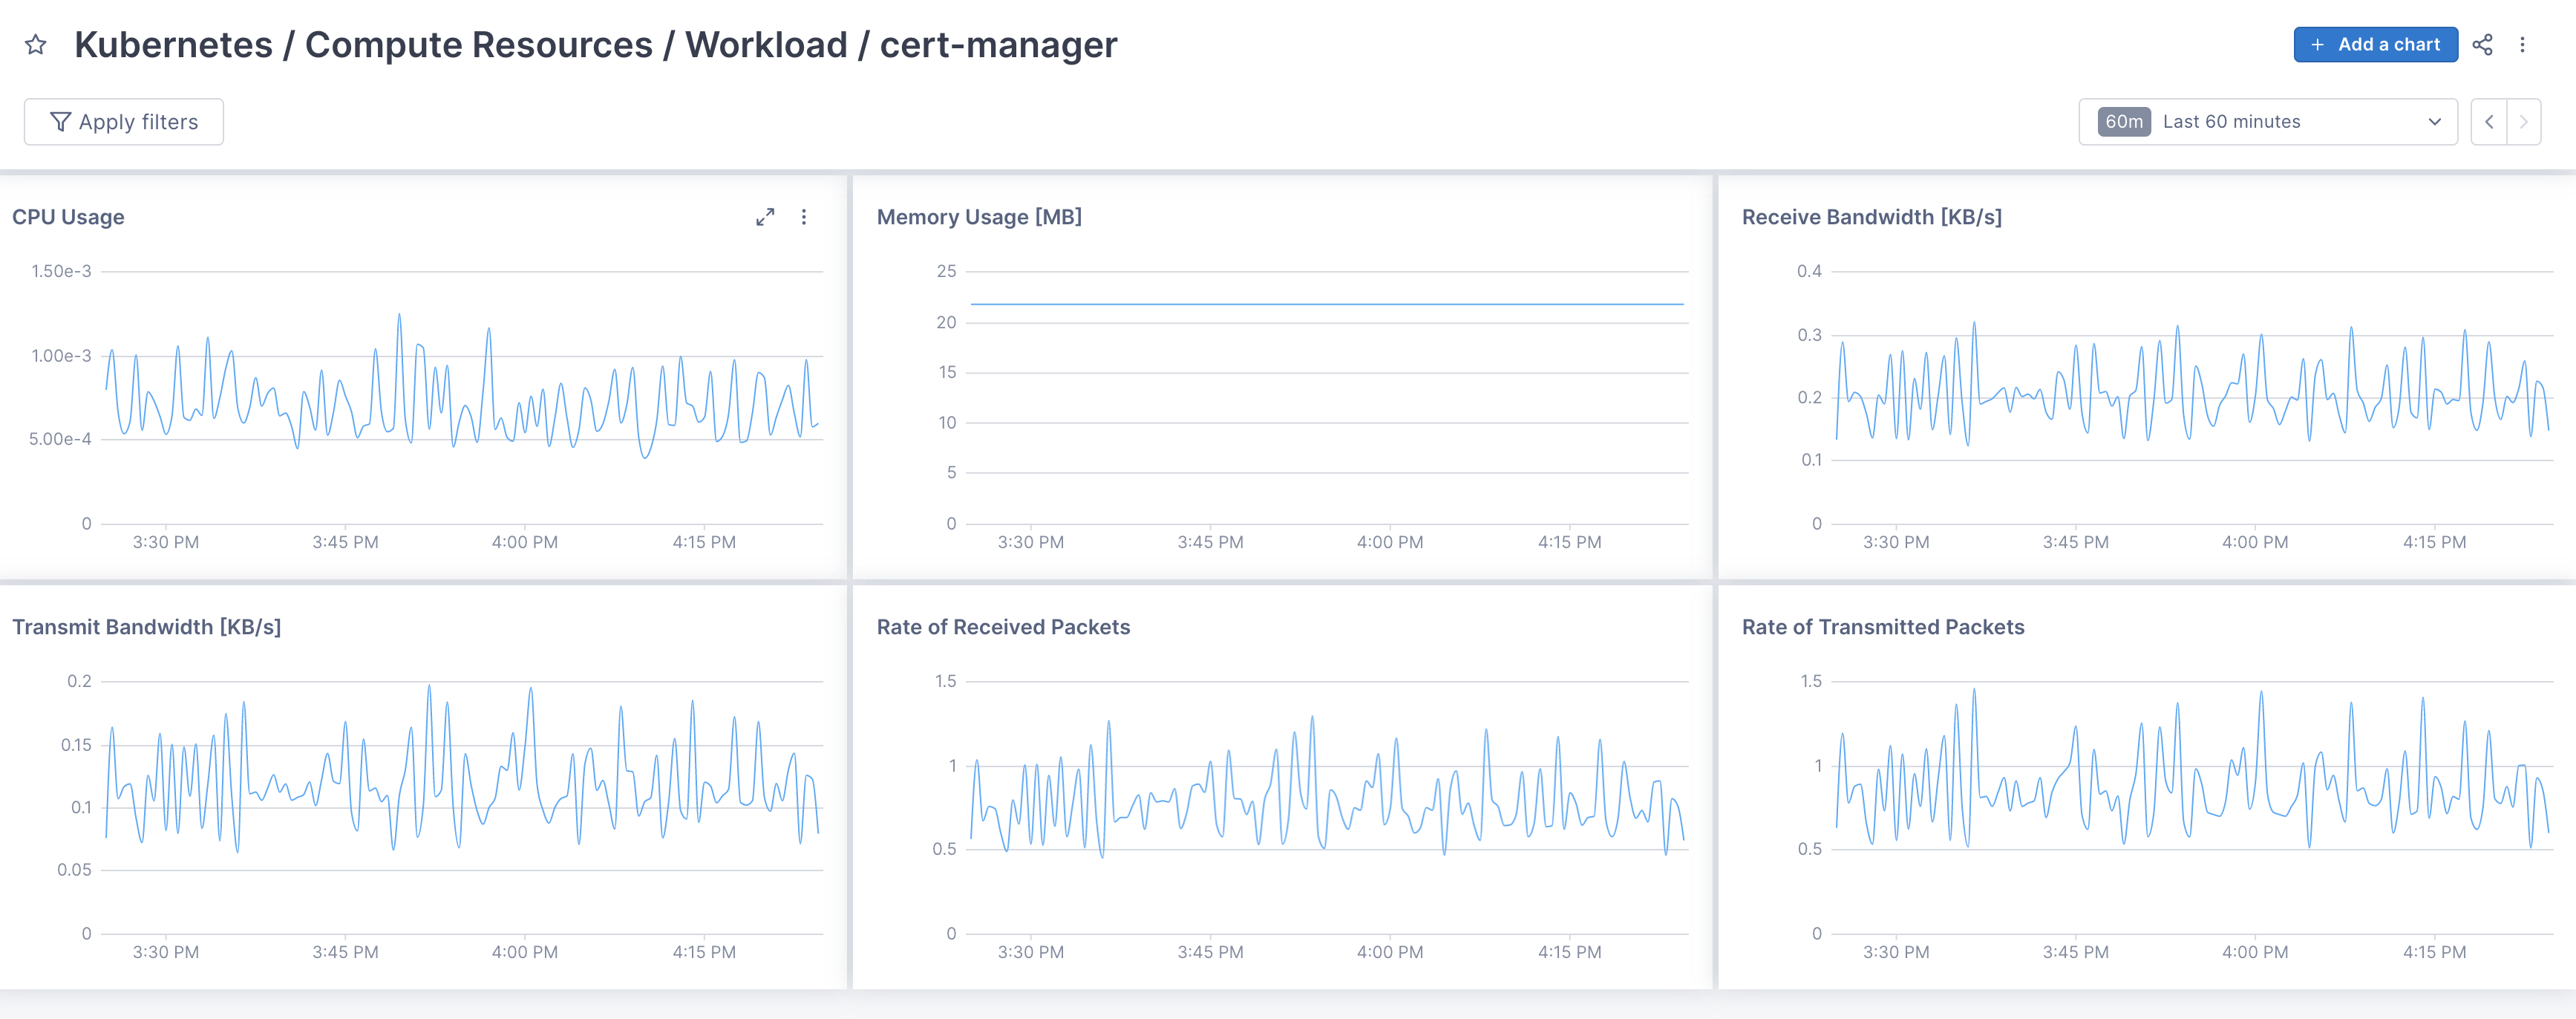
There are also a number of individual dashboards for each specified workload.
See also
Updated Aug 25, 2023