
The ServiceNow Cloud Observability Data Source lets you view and visualize telemetry data from Cloud Observability directly in Grafana. Using this data source, you can access Cloud Observability data from a Grafana chart to find the root cause of an issue, using advanced functionality like Cloud Observability’s correlation feature.
This guide describes how to install and enable the ServiceNow Cloud Observability Data Source. It also shows how to use the data source to access Cloud Observability from Grafana and investigate issues.
Prerequisites
You need the following to enable and use the plugin:
-
A Grafana account (version 7 and greater).
The plugin only supports graph and time series charts.
-
Telemetry data reporting to Cloud Observability.
-
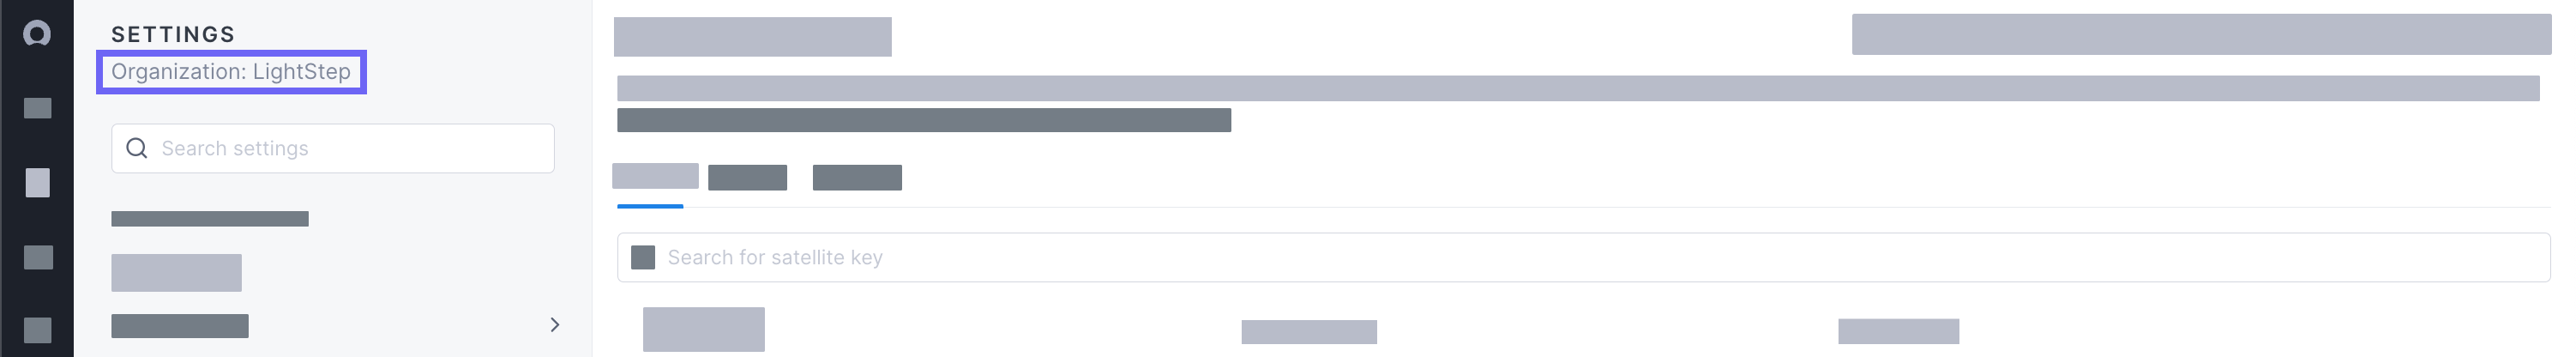
Your Cloud Observability Project and Organization names. To find your Project and Organization names, click Settings.
-
A Cloud Observability API key with Viewer permissions created just for Grafana.
Paste the key someplace safe, as you will not be able to access it again from Cloud Observability.
Installation
Recommended: Install using the Grafana CLI
-
Install the plugin from the Grafana CLI using Grafana’s plugin installation instructions. Copy the latest release zip URL from the releases page.
1
grafana-cli plugins install servicenow-cloudobservability-datasource
If running locally on Mac OS (arm) via Homebrew, try:
1
2
grafana-cli --pluginsDir /opt/homebrew/var/lib/grafana/plugins \
            plugins install servicenow-cloudobservability-datasource
Install directly from GitHub
-
Download the zip file for the plugin.
-
Unzip the release into your Grafana
pluginsdirectory.The value of
YOUR_GRAFANA_PLUGINS_DIRdepends on your system and how Grafana was installed. For example, it may be at/var/lib/grafana/pluginson Linux.1
unzip -d [YOUR_GRAFANA_PLUGINS_DIR]/servicenow-cloudobservability-datasource servicenow-cloudobservability-datasource-X.Y.Z.zip
-
In the Grafana plugin installation, install the ServiceNow Cloud Observability data source.
For more information, follow the steps in the Grafana documentation for local installations.
Enable the ServiceNow Cloud Observability Data Source in Grafana
After you install the plugin, follow these steps. Steps may vary slightly depending on your version of Grafana.
- Restart the Grafana server so it can discover the new plugin.
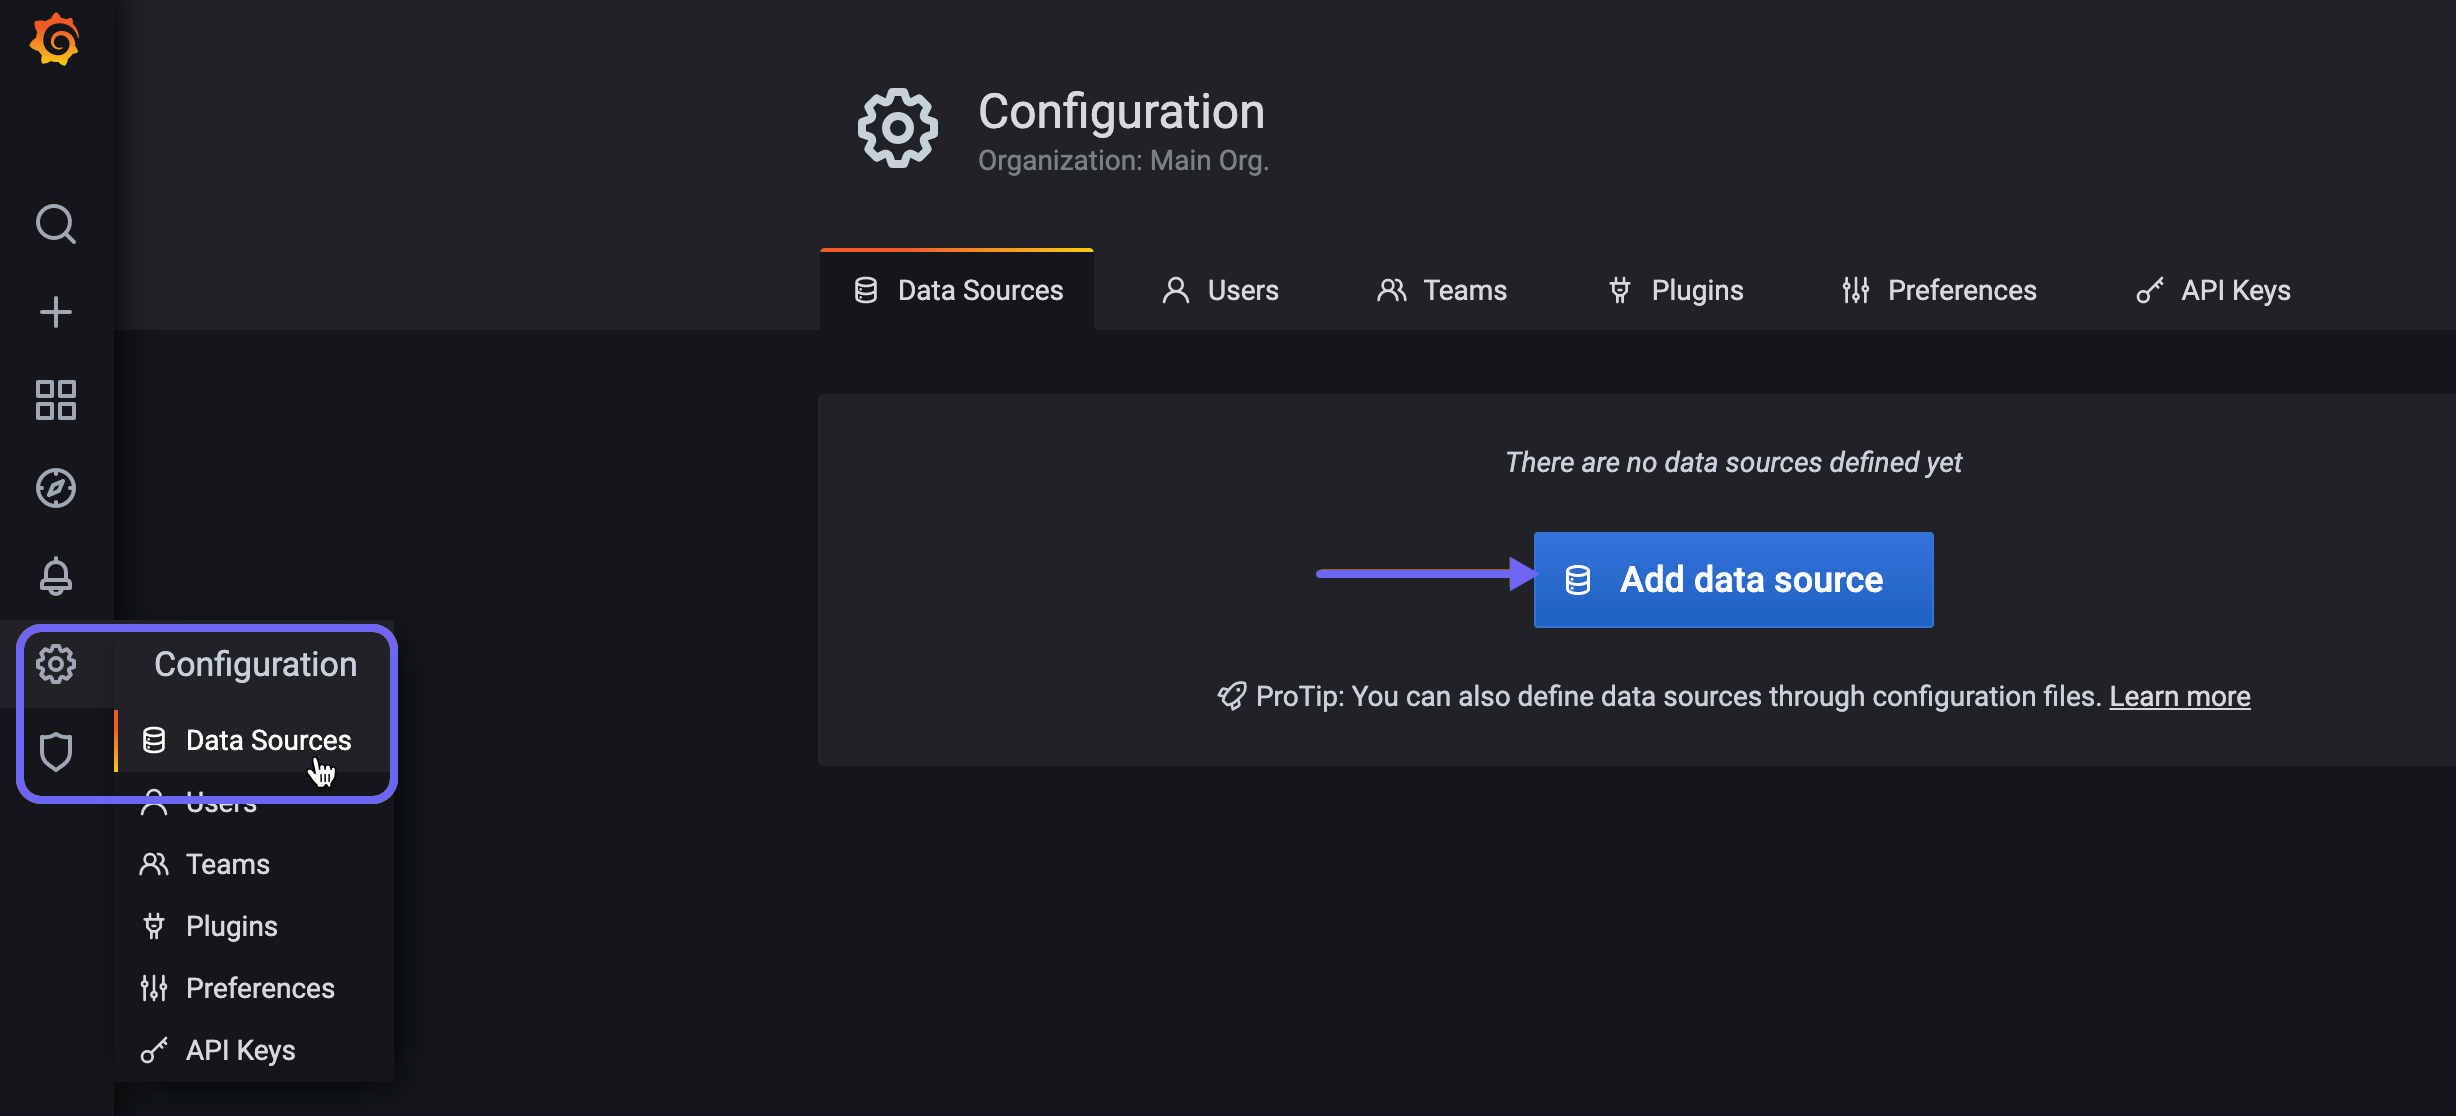
-
In the Navigation Bar, choose Configuration, select Data Sources, and click Add data source.
-
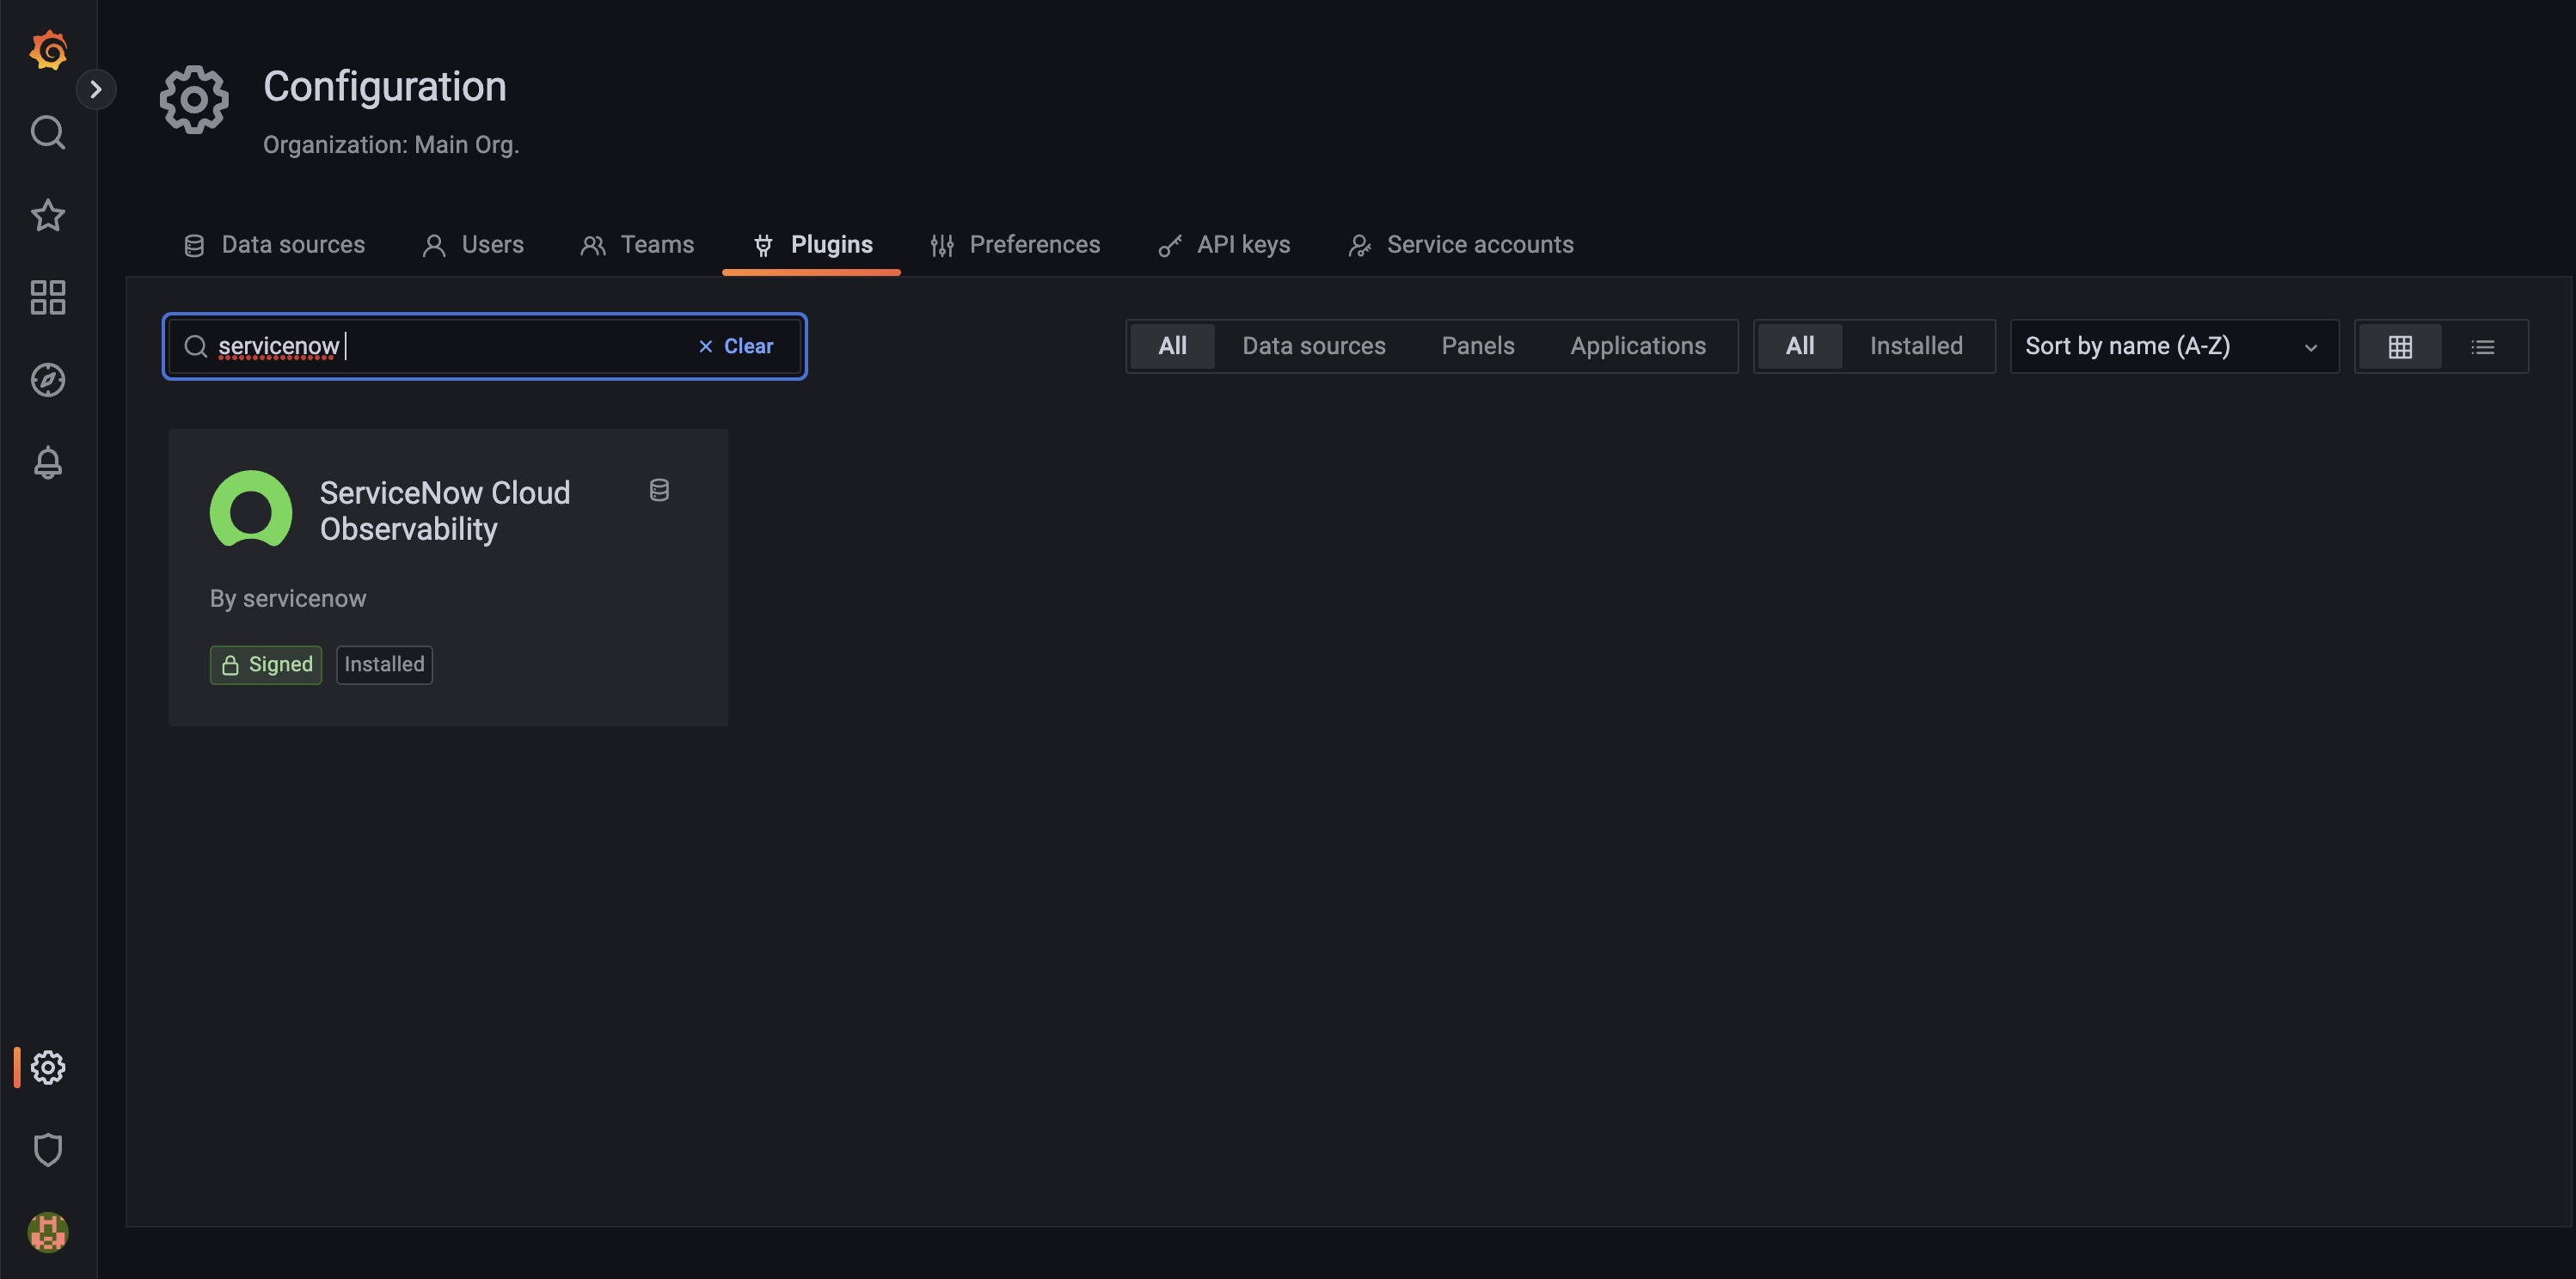
Start typing
ServiceNowin the search field to find ServiceNow Cloud Observability and click Select. If you do not see the plugin listed, please ensure it has been correctly installed or reach out to the Cloud Observability team for further assistance. -
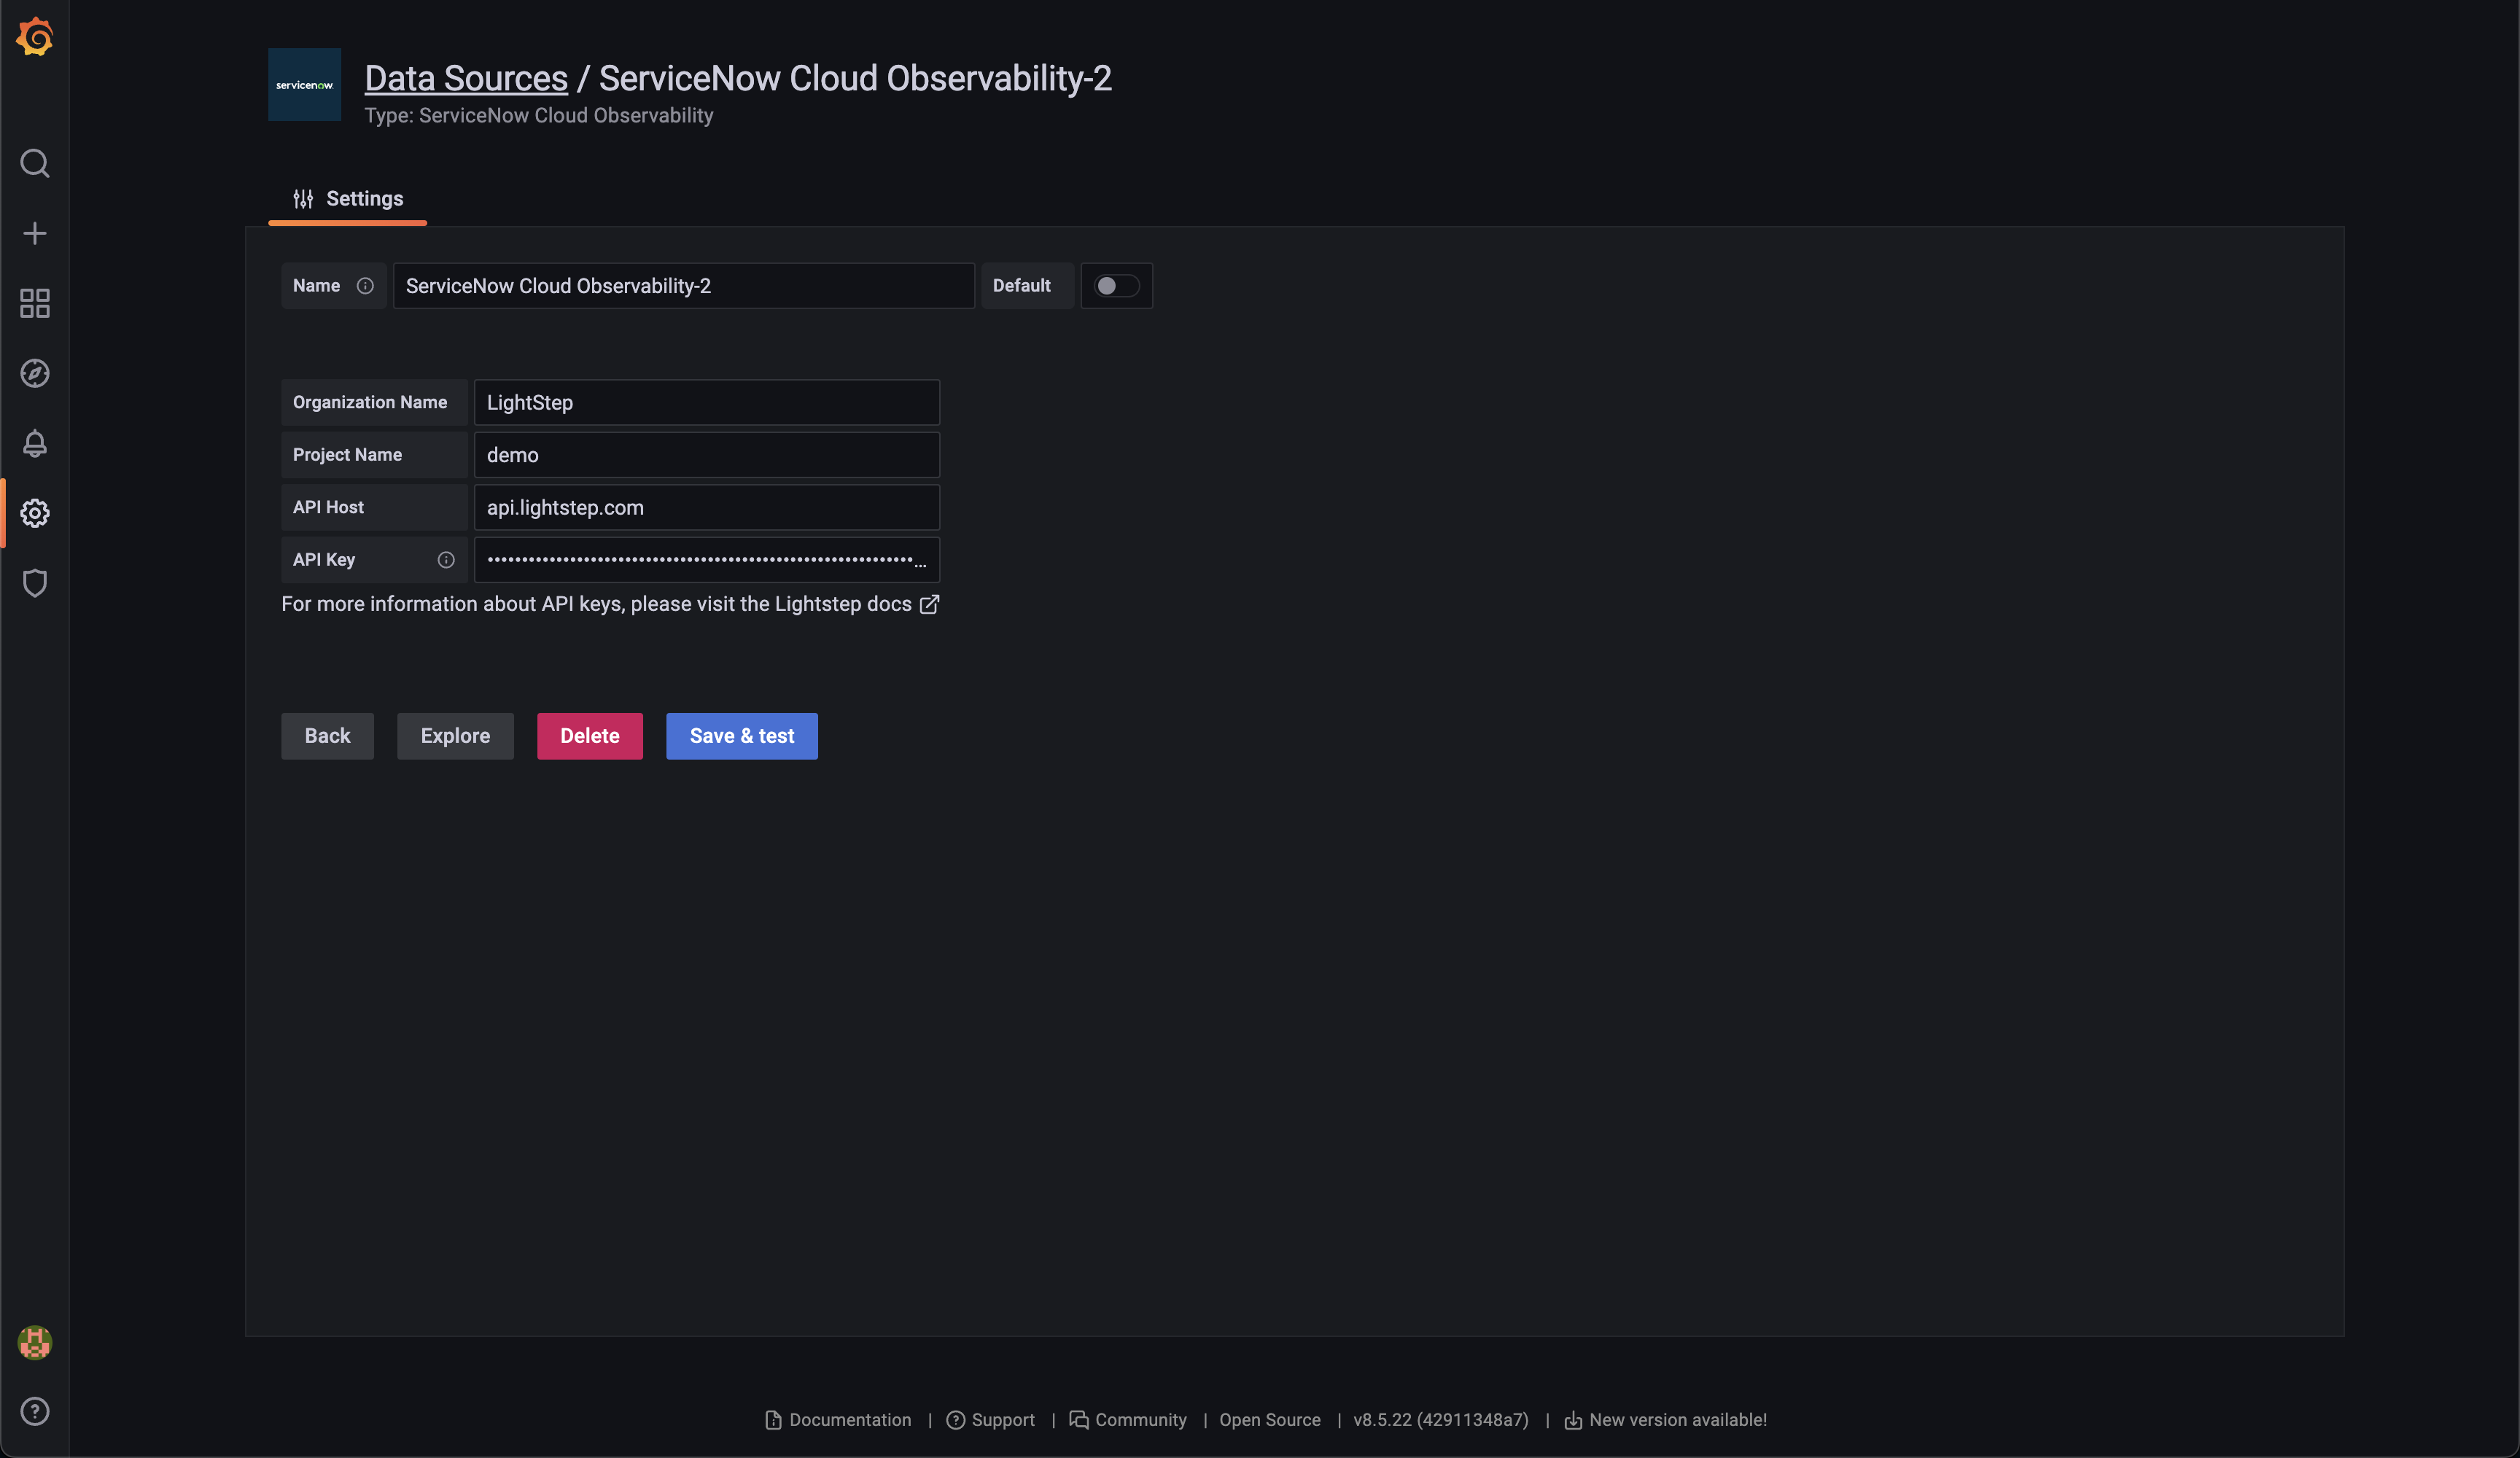
Enter your Cloud Observability organization and project name. If you want to use the data source with multiple projects, enter the name of each project separated by a comma into the project name field. Then paste in your Cloud Observability API key and click Save & Test.
Grafana confirms that it’s connected to Cloud Observability.
You can now create dashboards and charts in Grafana using data provided by your Cloud Observability project.
Create Grafana charts
With the plugin installed, you can query your Cloud Observability data directly from Grafana.
-
From the Query tab of the Edit Panel, select ServiceNow Cloud Observability data source from the Data source drop-down.
-
Add a query to the text input, using Cloud Observability’s Unified Query Language (UQL).
Click out of the field (or press
shift+Enter) to run your query.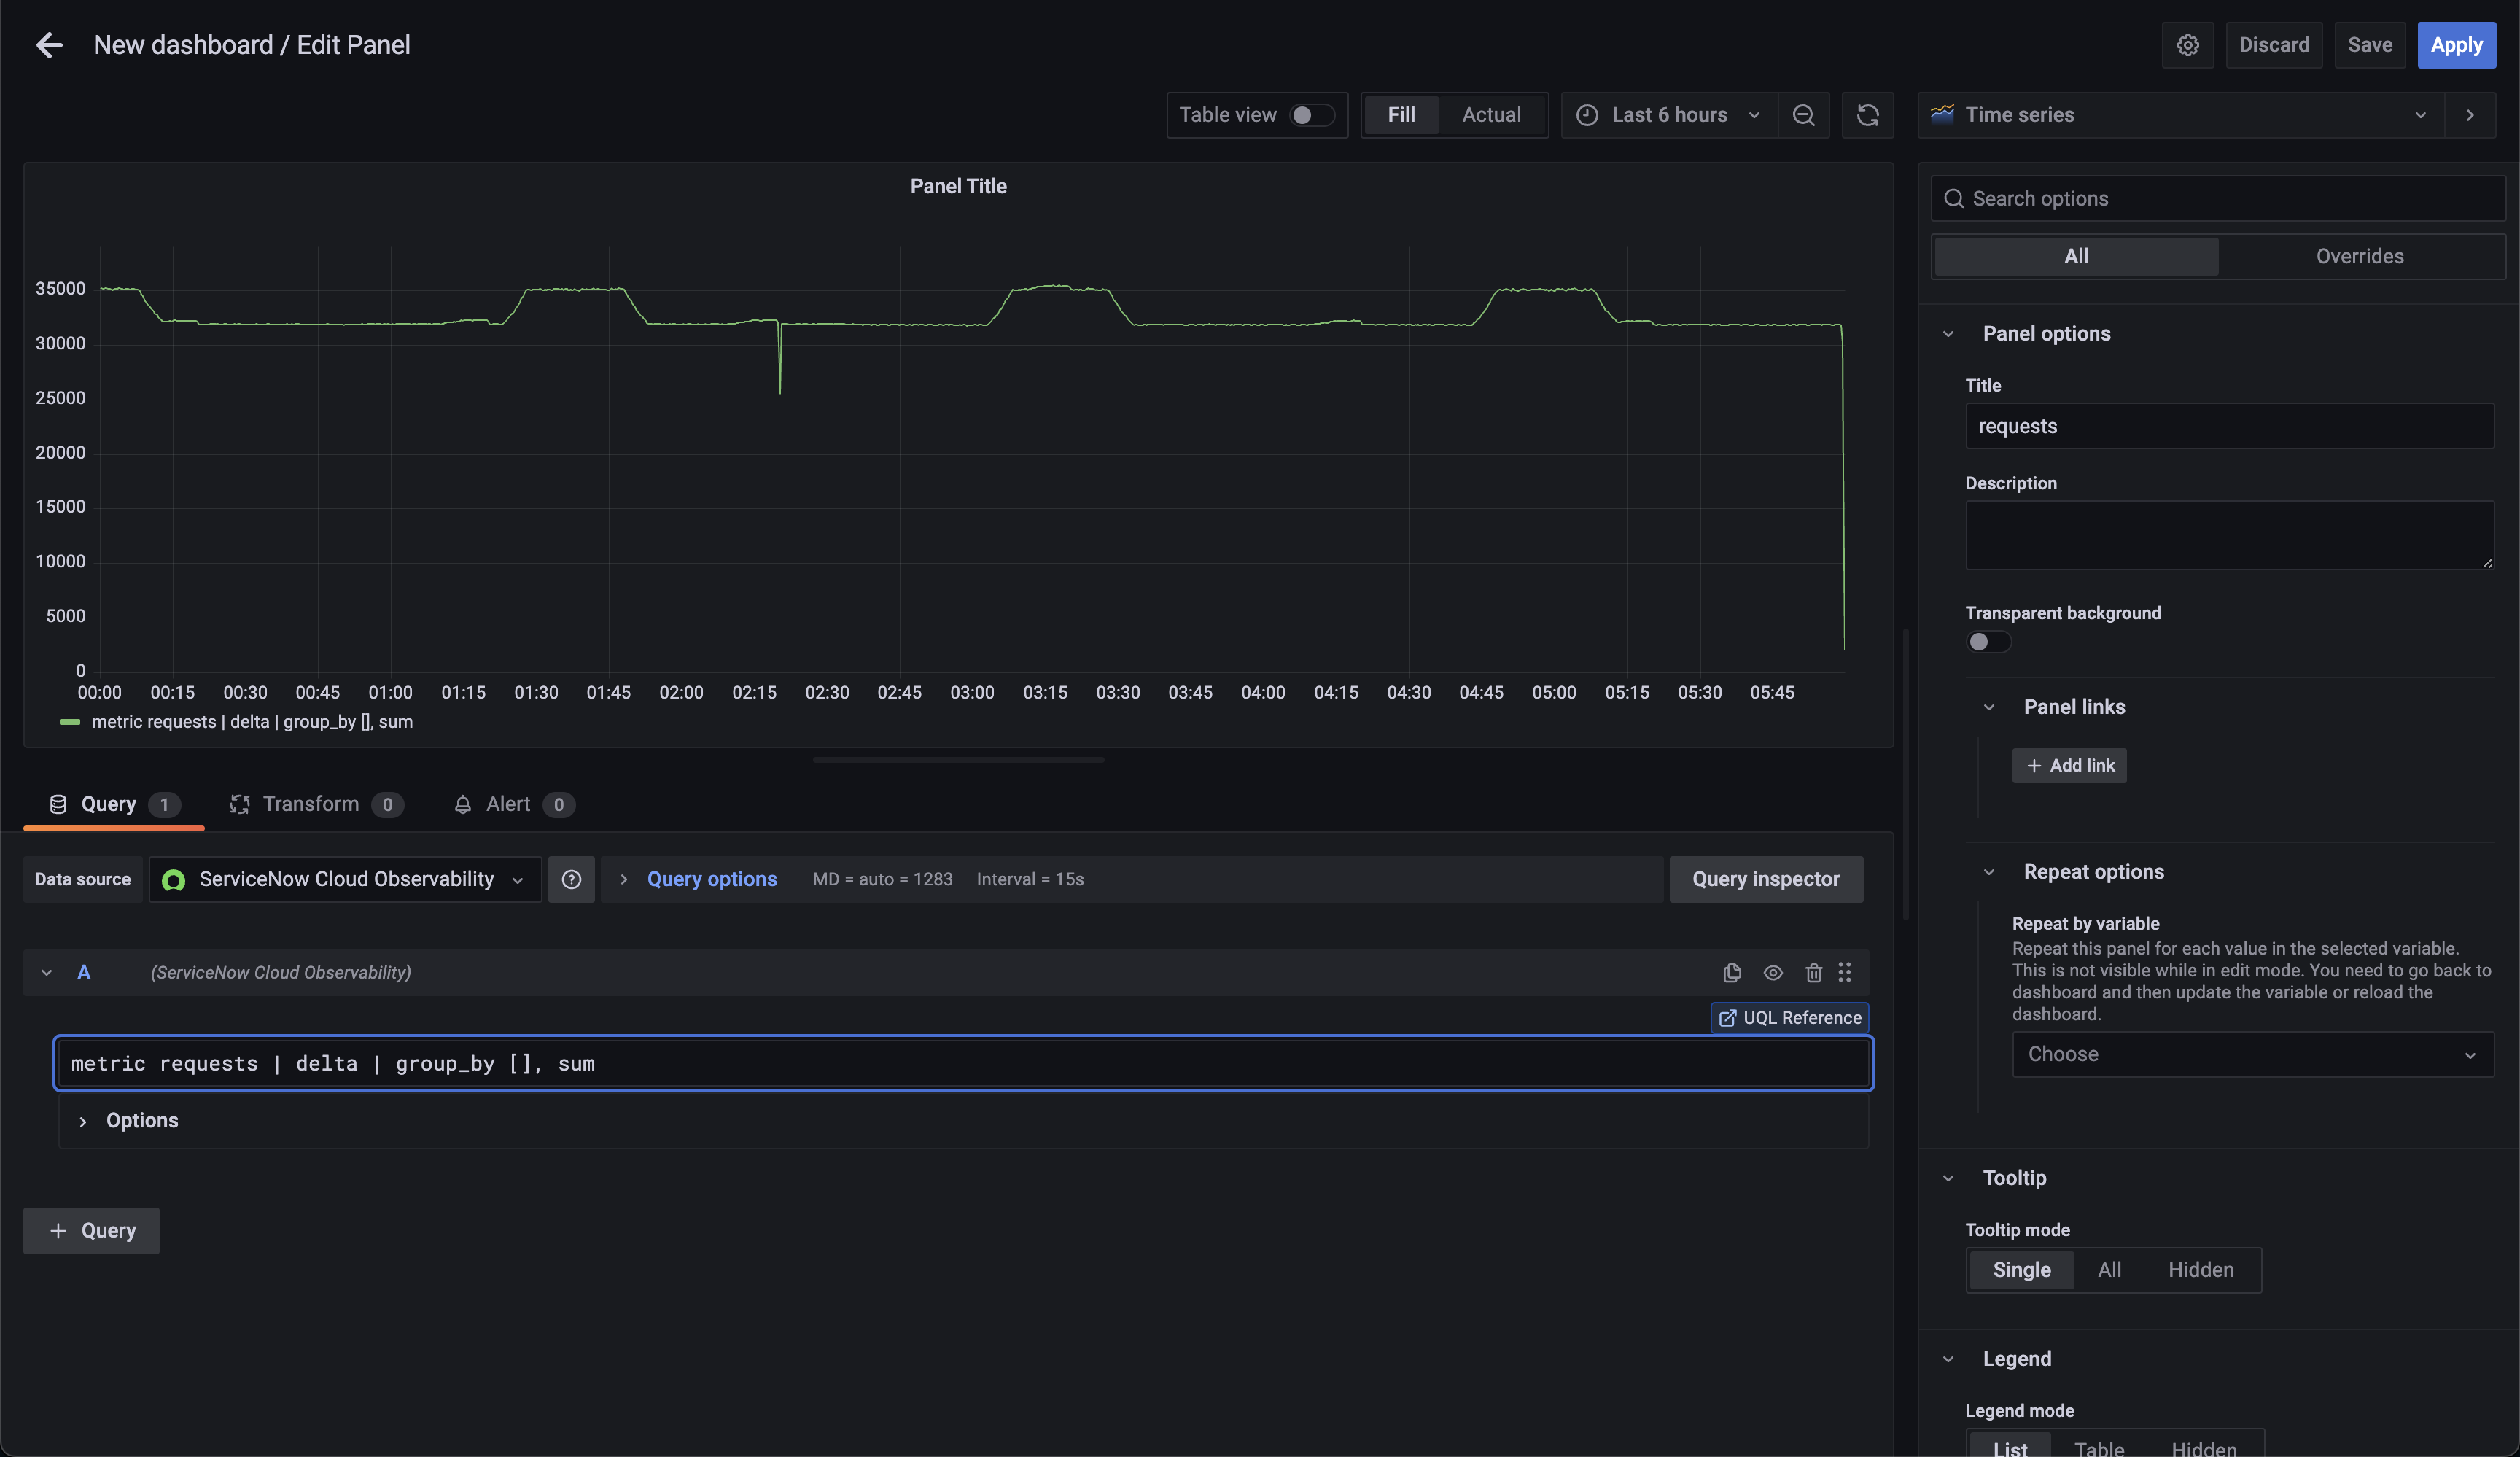
-
Choose the visualization for the chart (Cloud Observability supports either Graph or Time Series). Click Apply to create the graph.
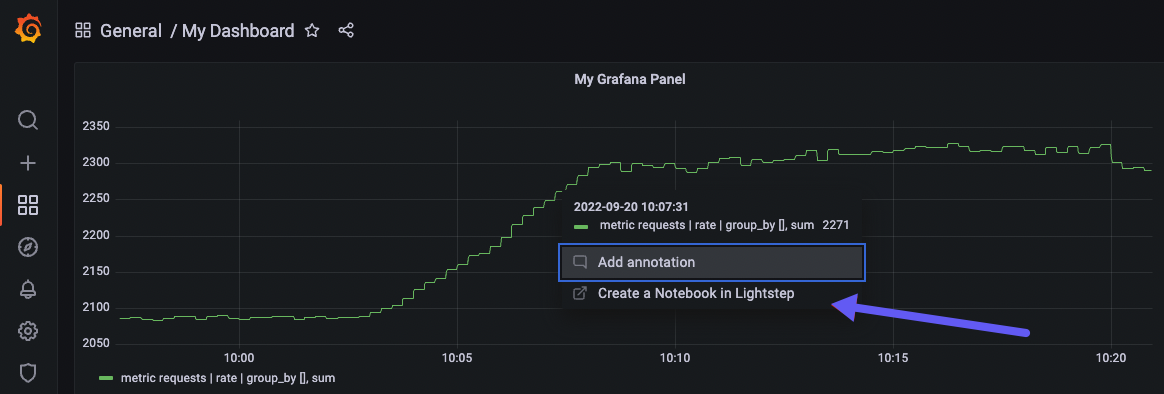
Investigate a deviation from a Grafana chart
Now that you have a chart in Grafana, when you notice an unexpected change in your data, you can investigate in Cloud Observability to rapidly find the root cause.
To investigate, click into the deviation and select Create a Notebook in Cloud Observability.
You’re taken to a notebook in Cloud Observability with your query pre-populated where you can start your investigation.
Use Cloud Observability’s correlation feature or Trace view to further your investigation.
See also
Ingest Prometheus metrics with an OpenTelemetry Collector on Kubernetes
Ingest metrics using the Collector
Updated Jun 26, 2023