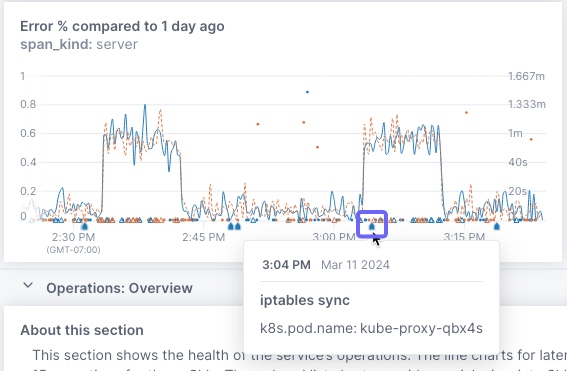
Often events outside of what your telemetry data sends can affect the performance of your system. For example, commits and merges to an environment might introduce errors or latency. Or the deployment of a feature flag might cause changes up or downstream. By displaying markers on your dashboards, you can see when an event occurred around the same time as performance changes. 
You create event markers using 3rd-party webhooks to send event data to Cloud Observability. If you’re already sending logs, you can also use that data to create event markers. You query the data from the webhooks or telemetry logs to determine when and how to display the markers.
We offer a pre-built event marker for GitHub and you can also create a custom webhook from most any 3rd-party app.
Learn how to create and use event markers in our new topic.
Updated Mar 14, 2024
