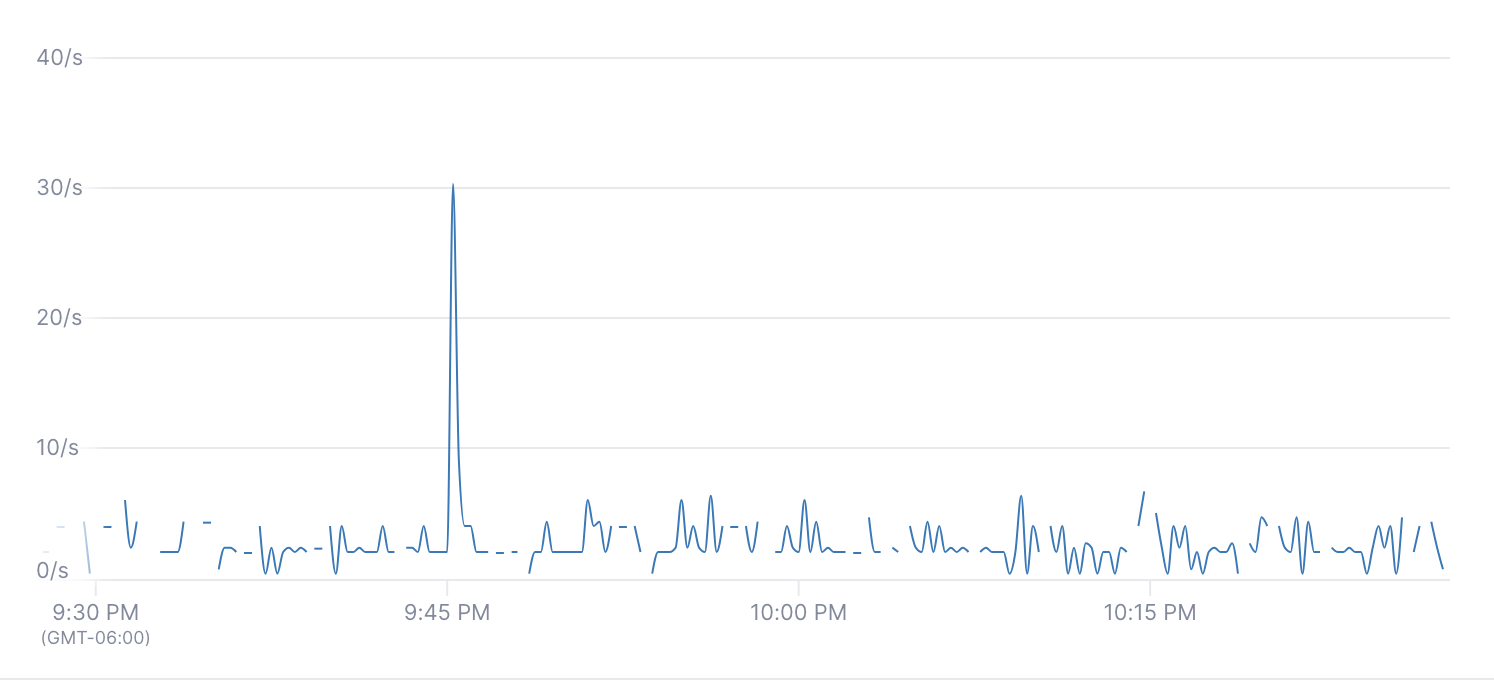
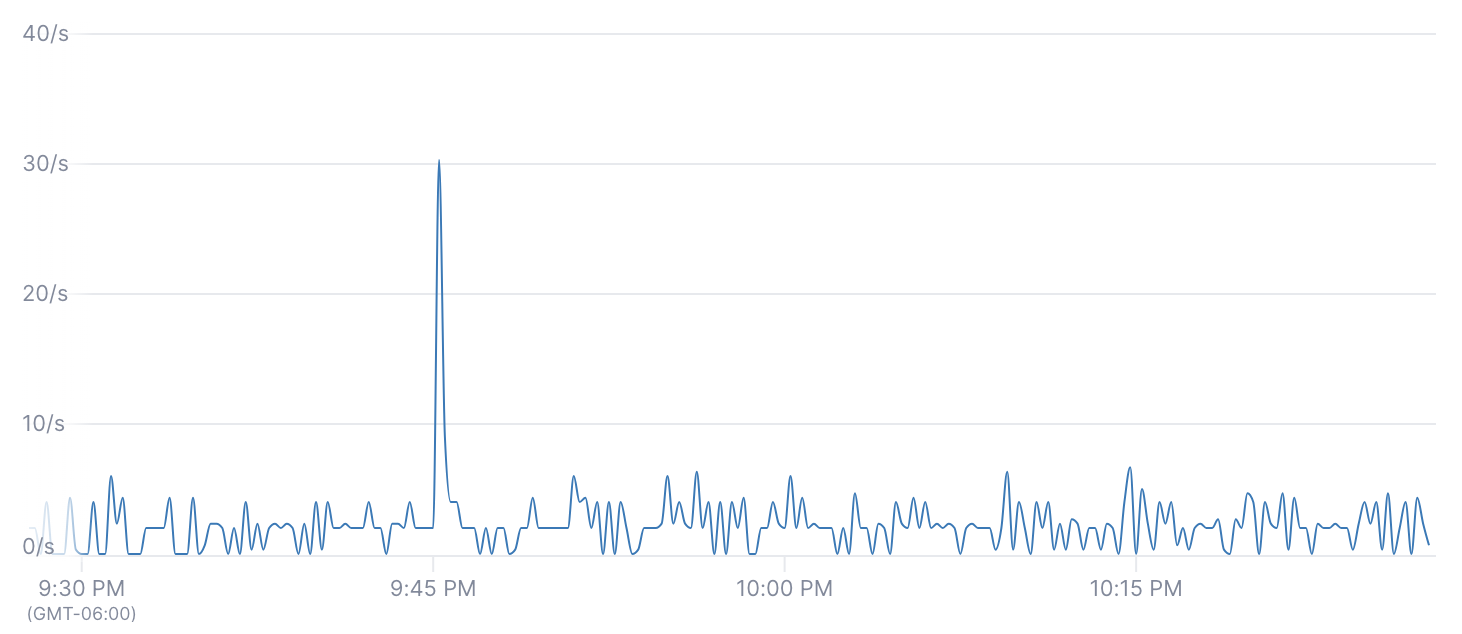
You can now use fill stage in UQL when dealing with gaps in time series. For example, let’s say there is a metric that doesn’t report every minute. Without fill, the chart would show gaps in a time series chart like below:

To get rid of those gaps, you can do the following:
Query with fill
1
2
3
4
metrics infrequent_counter
| rate
| group_by [host], sum
| fill 0

See the UQL reference for more details.
Updated Sep 4, 2024
