Logging is now generally available to help you unify your observability workflows. You can manage, monitor, and investigate logs, metrics, and traces in one place.
Read the sections below to learn more about logging in Cloud Observability and what it means for you.
Search in the new logs tab
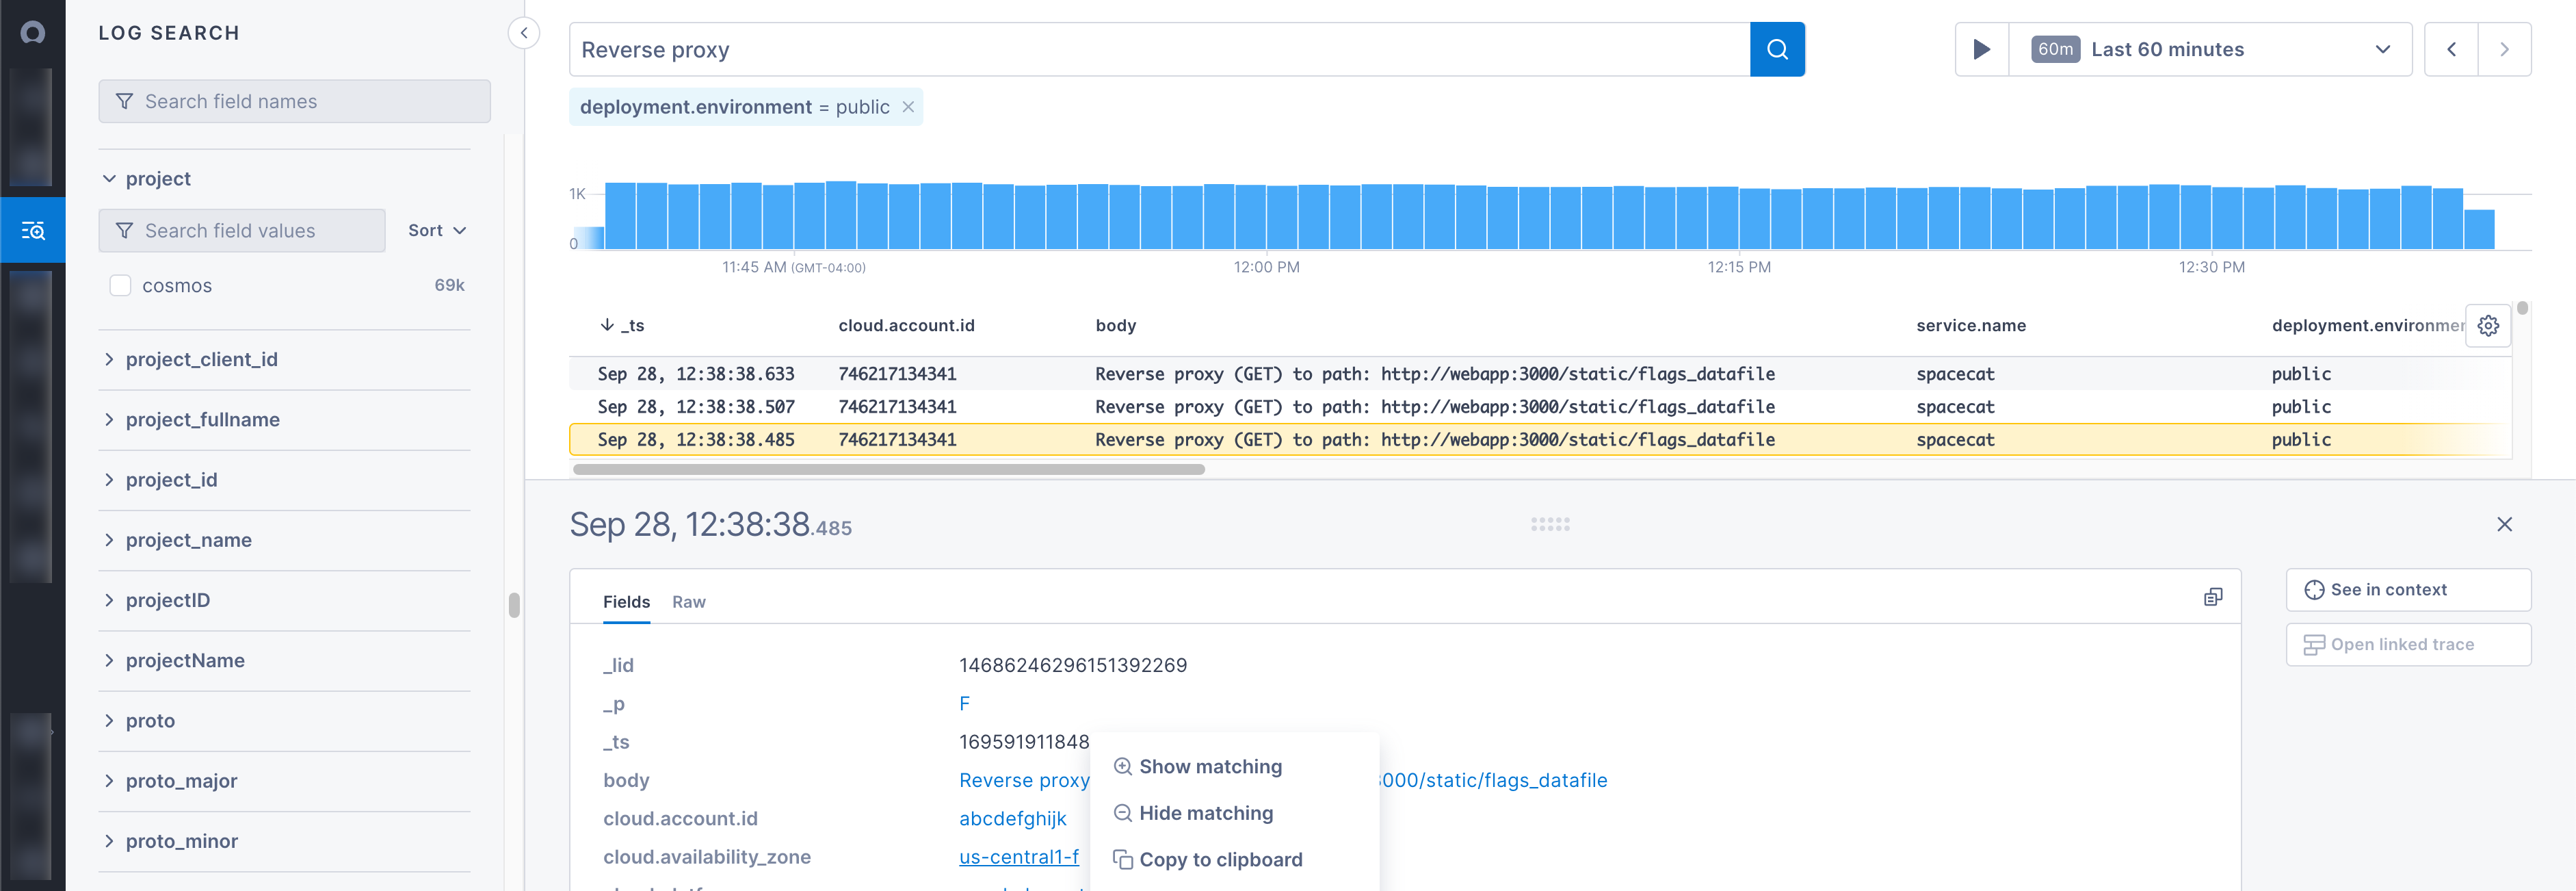
Cloud Observability has an all-new logs tab to help you monitor performance and troubleshoot issues. Use it to search logs, filter logs, connect logs to traces, and view logs in context:

To learn more about the logs tab, visit Explore logs.
Integrate with existing workflows
This release integrates logs into existing workflows. You can use the same Cloud Observability features and languages on all three telemetry types.
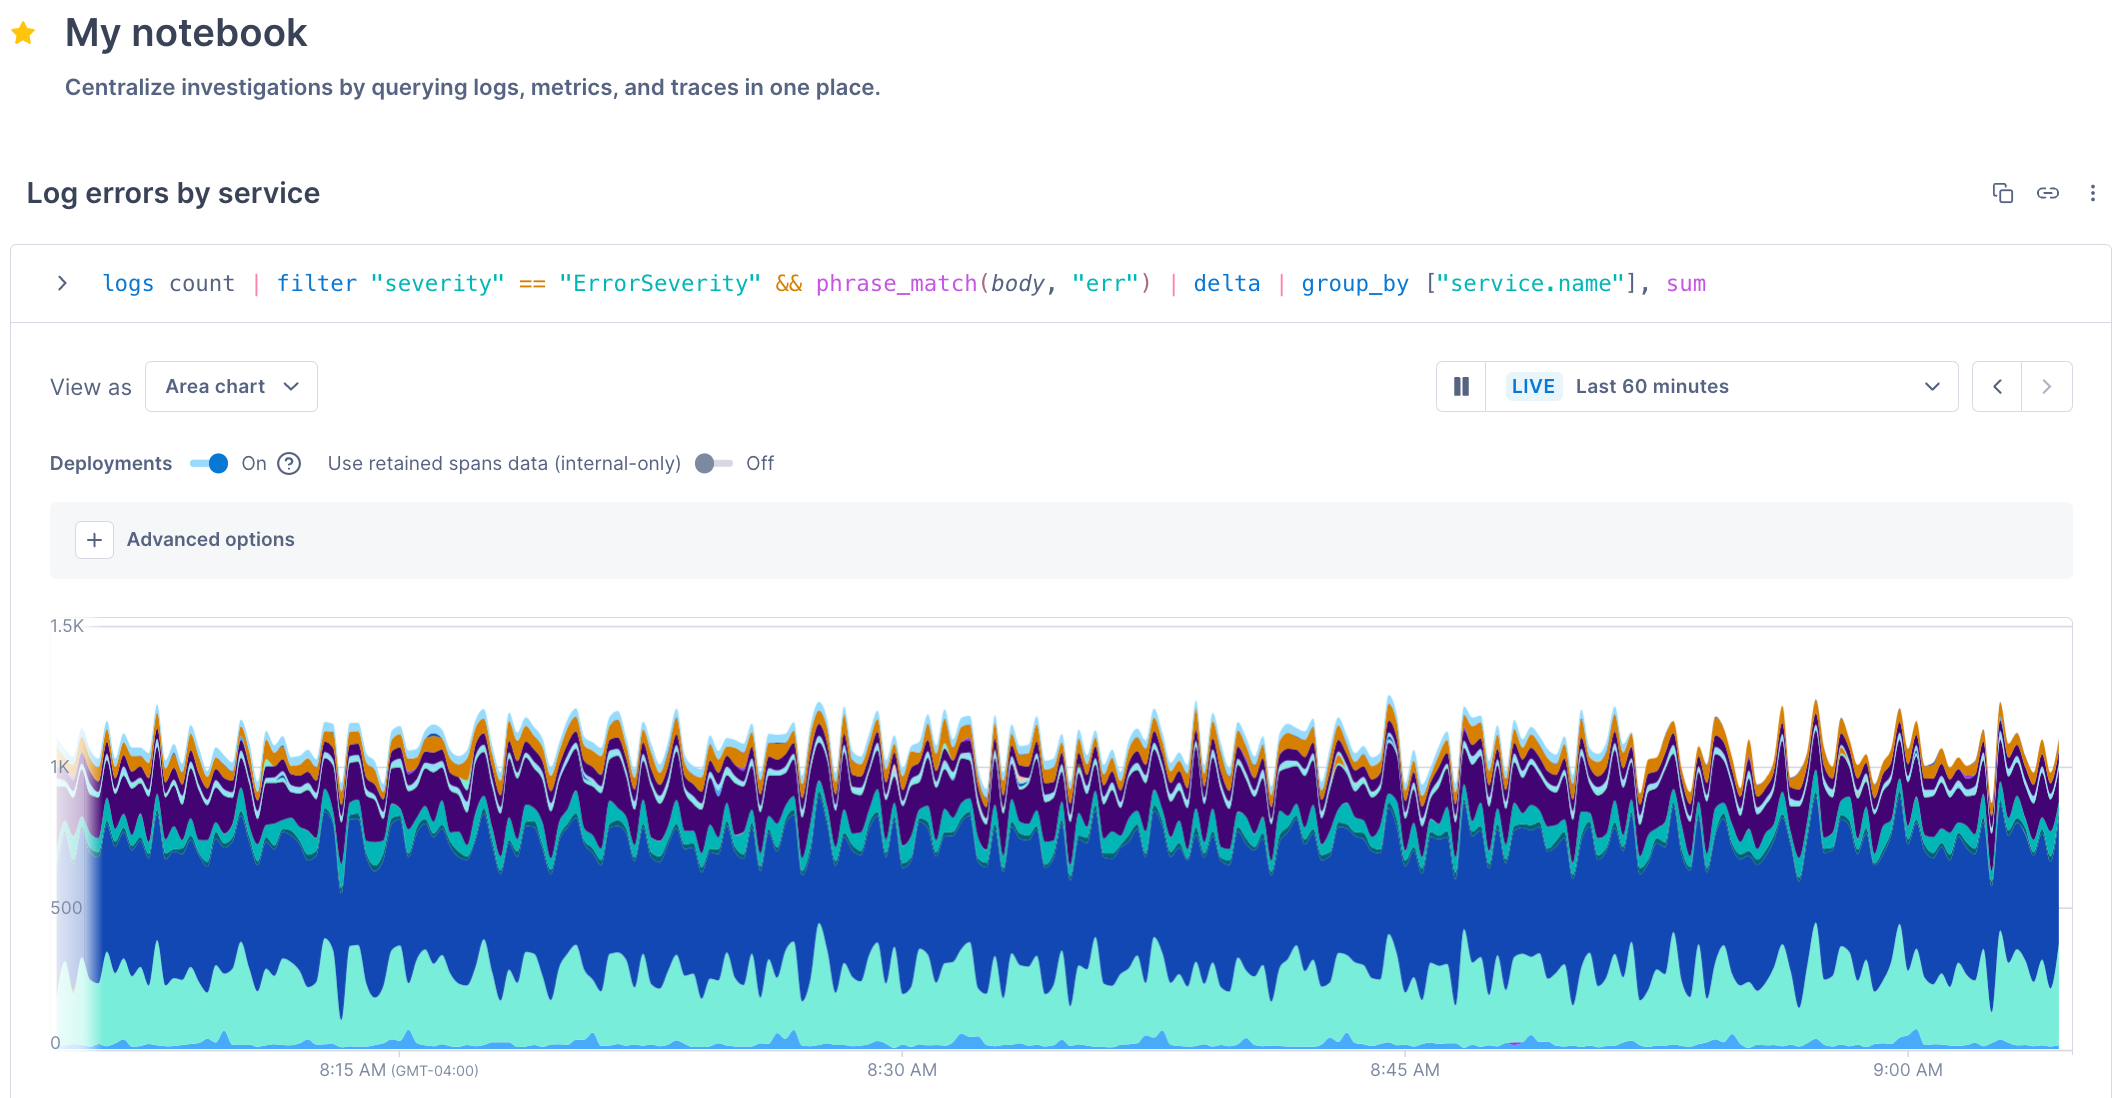
In addition to supporting metrics and traces, Cloud Observability’s Unified Query Builder (UQB) and Unified Query Language (UQL) now support logs. With that update, you can use the UQB and UQL – tools you already know – to add logs to alerts, dashboards, and notebooks:

Cloud Observability also helps you make connections across logs, metrics, and traces:
- Connect logs to traces in the logs tab and trace view.
- Create notebooks to centralize investigations across telemetry types.
- View logs related to metrics and traces in charts.
For this release, Cloud Observability’s correlation engine continues to work with metrics and traces only. To investigate issues using logs, work with the logs tab, notebooks, and trace view.
Explore the past with rehydration
Finally, Cloud Observability now offers log rehydration. Log rehydration lets you move logs from less-expensive, un-queryable cold storage to queryable hot storage. The feature can help you lower storage costs and explore logs related to past events.
Visit Rehydrate logs to learn more.
Get started
Reach out to your Account Manager to get access to logging in Cloud Observability.
To learn more about logging, visit these links:
- Get started with logs - Quickly write and query logs in Cloud Observability.
- Log integrations - Configure tools such as Logstash and OpenTelemetry Collector to send logs to Cloud Observability.
- Explore logs - Learn how to view and search logs in the logs tab.
- Query logs - Learn how to query logs with Cloud Observability’s UQB.
Updated Sep 30, 2023
