To help you gain system insights and troubleshoot with logs,
Cloud Observability offers two new features: logs queries and Logs list visualizations.
Logs queries
logs queries return individual logs matching certain conditions.
You can work with logs queries in notebooks and dashboards.
1
logs | filter "customer" == "sweetpines" && phrase_match(body, "err")
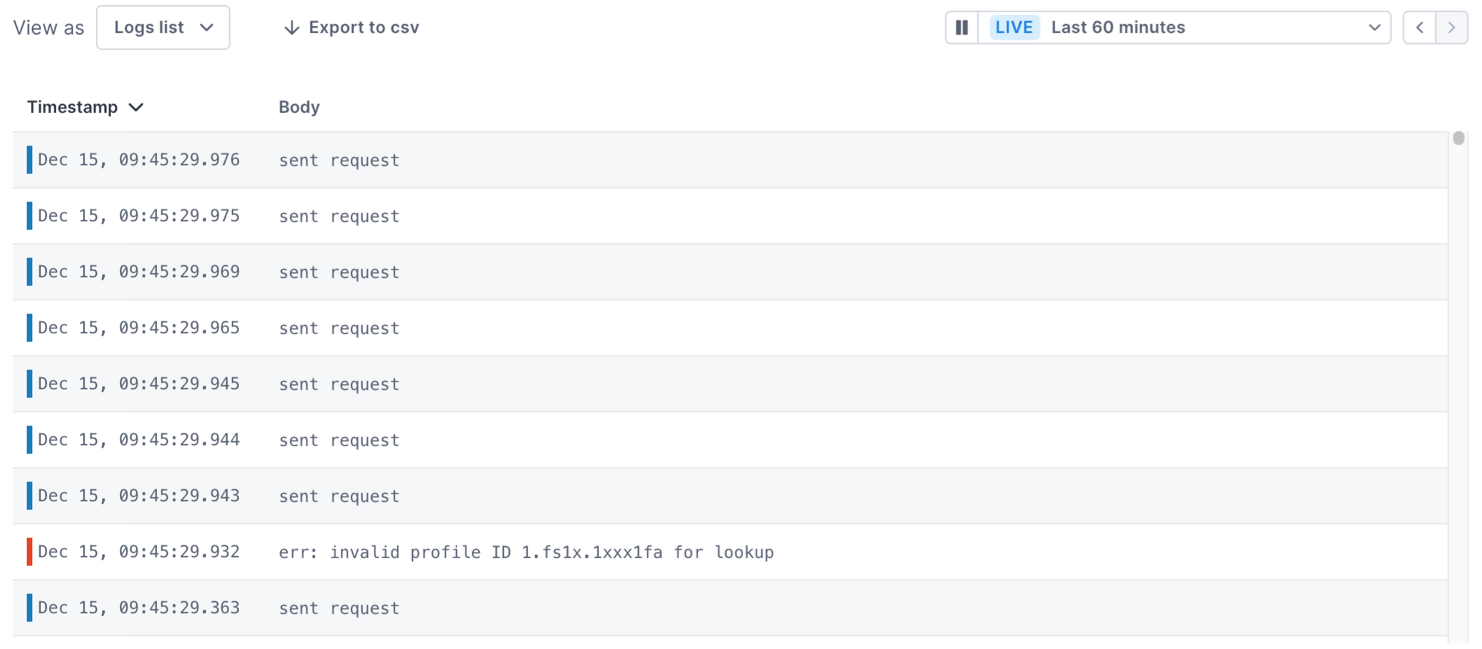
Logs list visualizations
Logs lists are a new visualization type in Cloud Observability notebooks and dashboards.
They show timestamps and body values of up to 1000 logs.
You can click a log in a Logs list to open the Log details panel. The panel shows the log’s fields in tabular and JSON format. The panel also helps you open linked traces and see logs in context.
Learn more
Visit the updated documentation to learn about the new features and how they fit into your unified observability solution:
Updated Dec 19, 2023