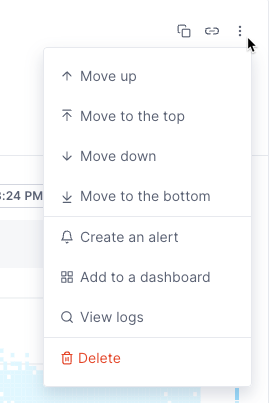
We’ve made improvements to our notebooks, including the ability to move charts and to create reverse links into Cloud Observability, allowing you to use the notebook as a template.
Move charts
You can now move charts up and down and to the top and bottom of a notebook. 
Use a notebook as a template (aka “reverse link”)
You can create a notebook and then use a “reverse link” that opens Cloud Observability and creates a new notebook containing the same charts as the original.
For example, say you want to add a link to your runbook for the iOS service and use it to create a notebook with charts showing error percentage and latency rate. You can create a notebook with those charts and then copy and paste the template link into your runbook. When users click the runbook link, Cloud Observability opens to a new notebook that contains the error and latency charts for the current time period.
Updated Jan 29, 2024
