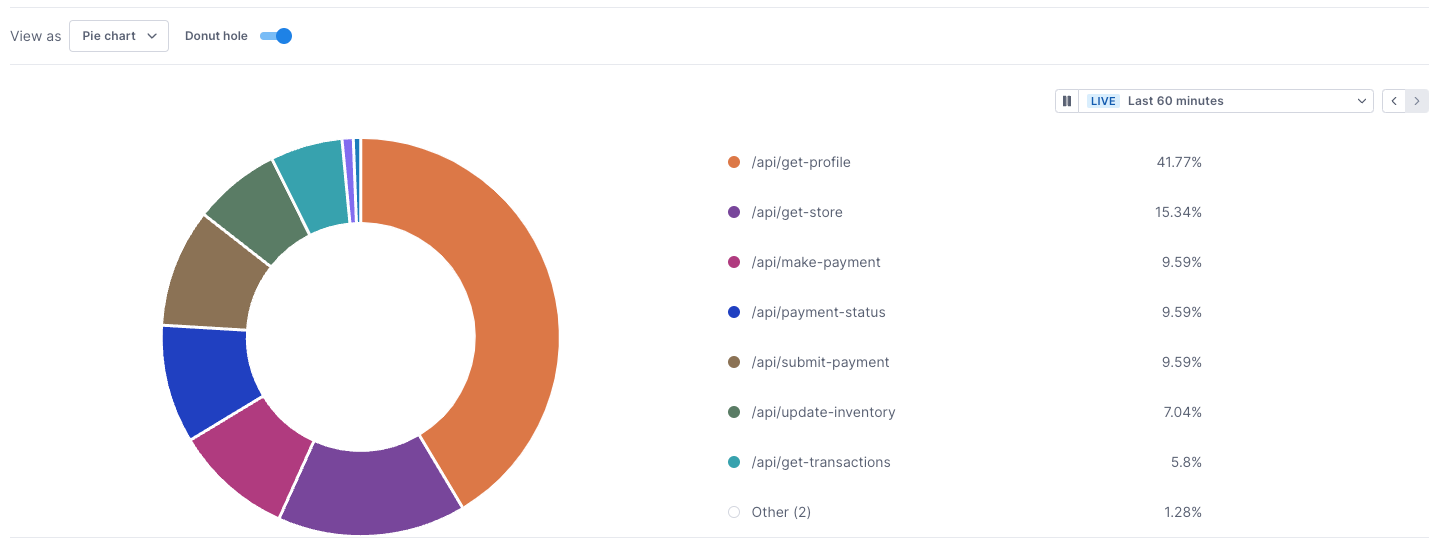
The pie chart displays the result of a query in proportional values that fill up a circle. A legend shows the colors assigned to each value in the chart.
You can display a pie chart as a donut chart by activating the Donut hole option.
Updated Feb 29, 2024