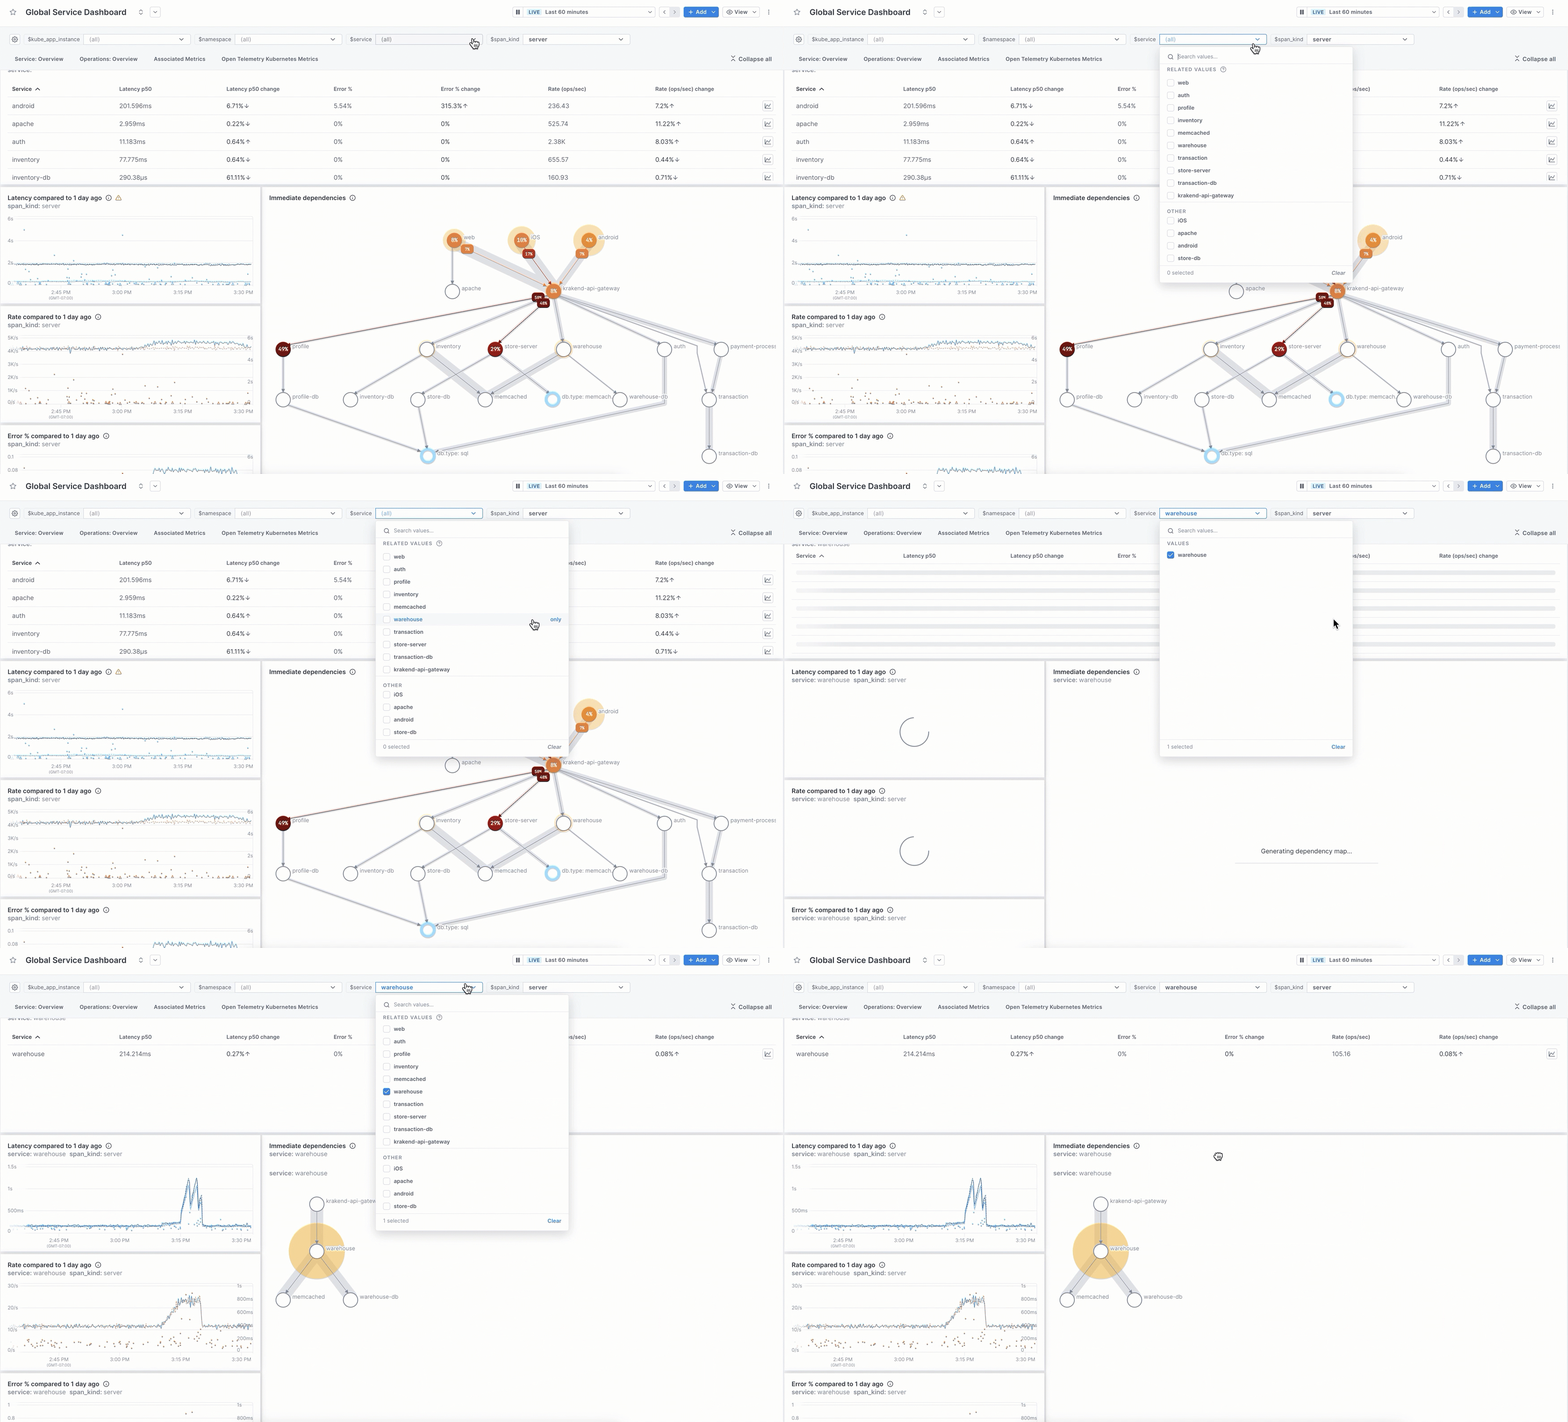
Cloud Observability now provides two types of pre-built service dashboards. Both provide an overview of performance for a service, its operations, and if you’re ingesting Kubernetes metrics, the associated metrics that the service is emitting.
Seeing the transaction level information about your service (SLIs from spans) and infrastructure health (metrics) in the same dashboard provides a powerful view into the overall health of your system.
-
Global service dashboard: A single dashboard that uses a template variable for the service, allowing you to view all your services from one dashboard. Change the
servicevariable value to view a specific service.
-
Individual service dashboard: Available for every service reporting to Cloud Observability. This dashboard provides the same information but because it’s scoped to a single service, it also provides an additional section about the performance of the individual operations on that service.
Updated Jul 18, 2023
