We’ve improved our sampling algorithms that determine the sample spans to display. Your span queries will now show more example spans representing peaks and rare groups.
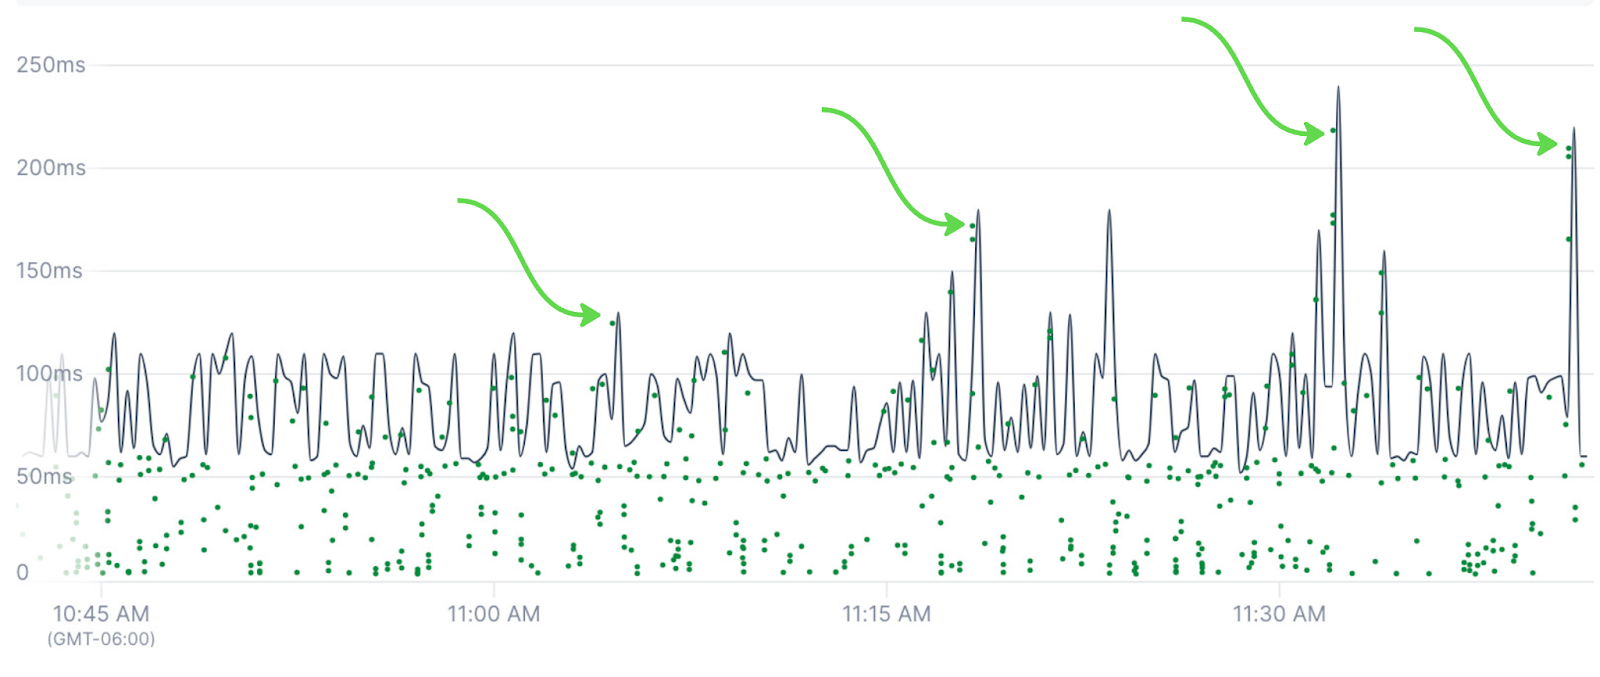
Cloud Observability computes time series using all ingested and stored span data that match your query. No sampling happens at this point - the series represents every span. To keep the chart readable, Cloud Observability does sample that data to display the example spans (the dots on a chart). We’ve modified the algorithm that determines these examples to favor rarer groups.
This sampling differs from ingest sampling, which decides whether or not Cloud Observability ingests and stores the data.
In our internal testing, we’ve observed:
-
Likelihood of selecting exemplars exceeding the p99 has improved by 80%
-
Likelihood of selecting exemplars exceeding the p99.9 has improved by 290%
When looking at latency, this should help identify the cause faster than before.
Updated Jun 7, 2024