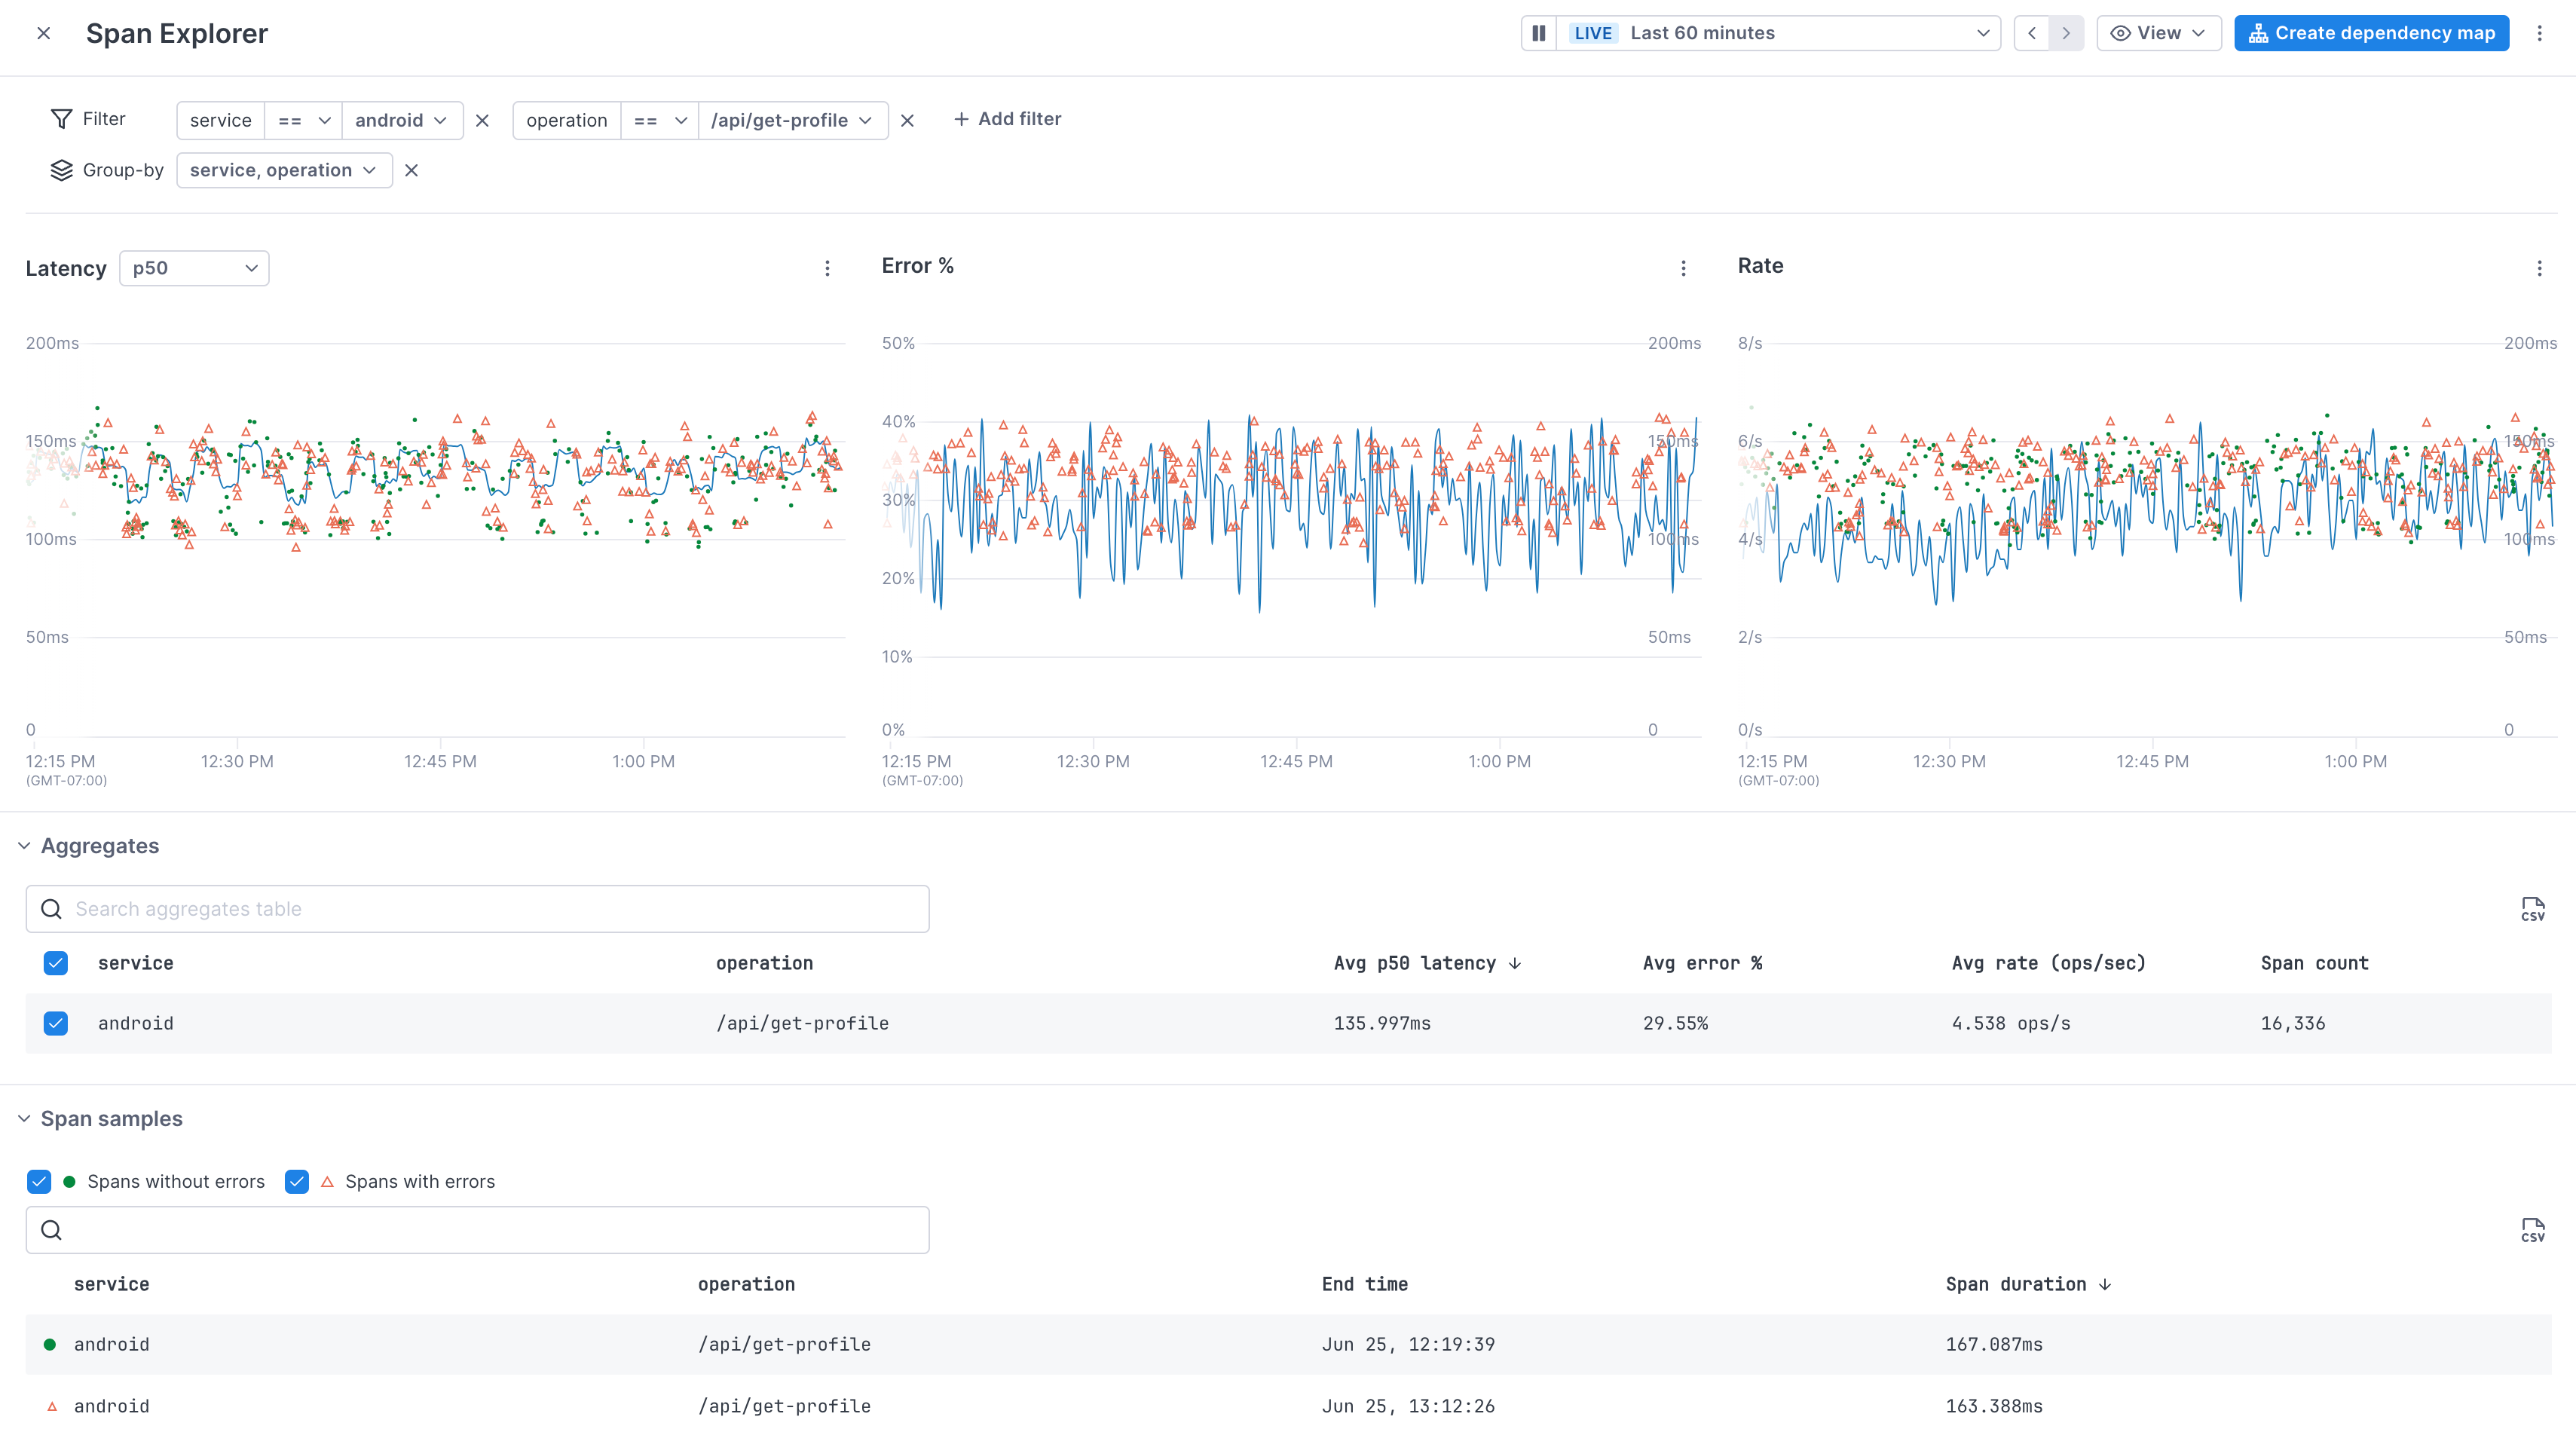
New Span Explorer
Span Explorer, accessed from both the Deployments and the Operations tab of the Service directory, lets you quickly see span data from your operations. From here, you can view latency, error percentage, and rate time series for operations, along with example span data. You can further filter your data to zero in on areas of your system, or you can group your data to see performance for specific entities. Click a span example in the charts or table to view that span in the context of a trace in Trace view.
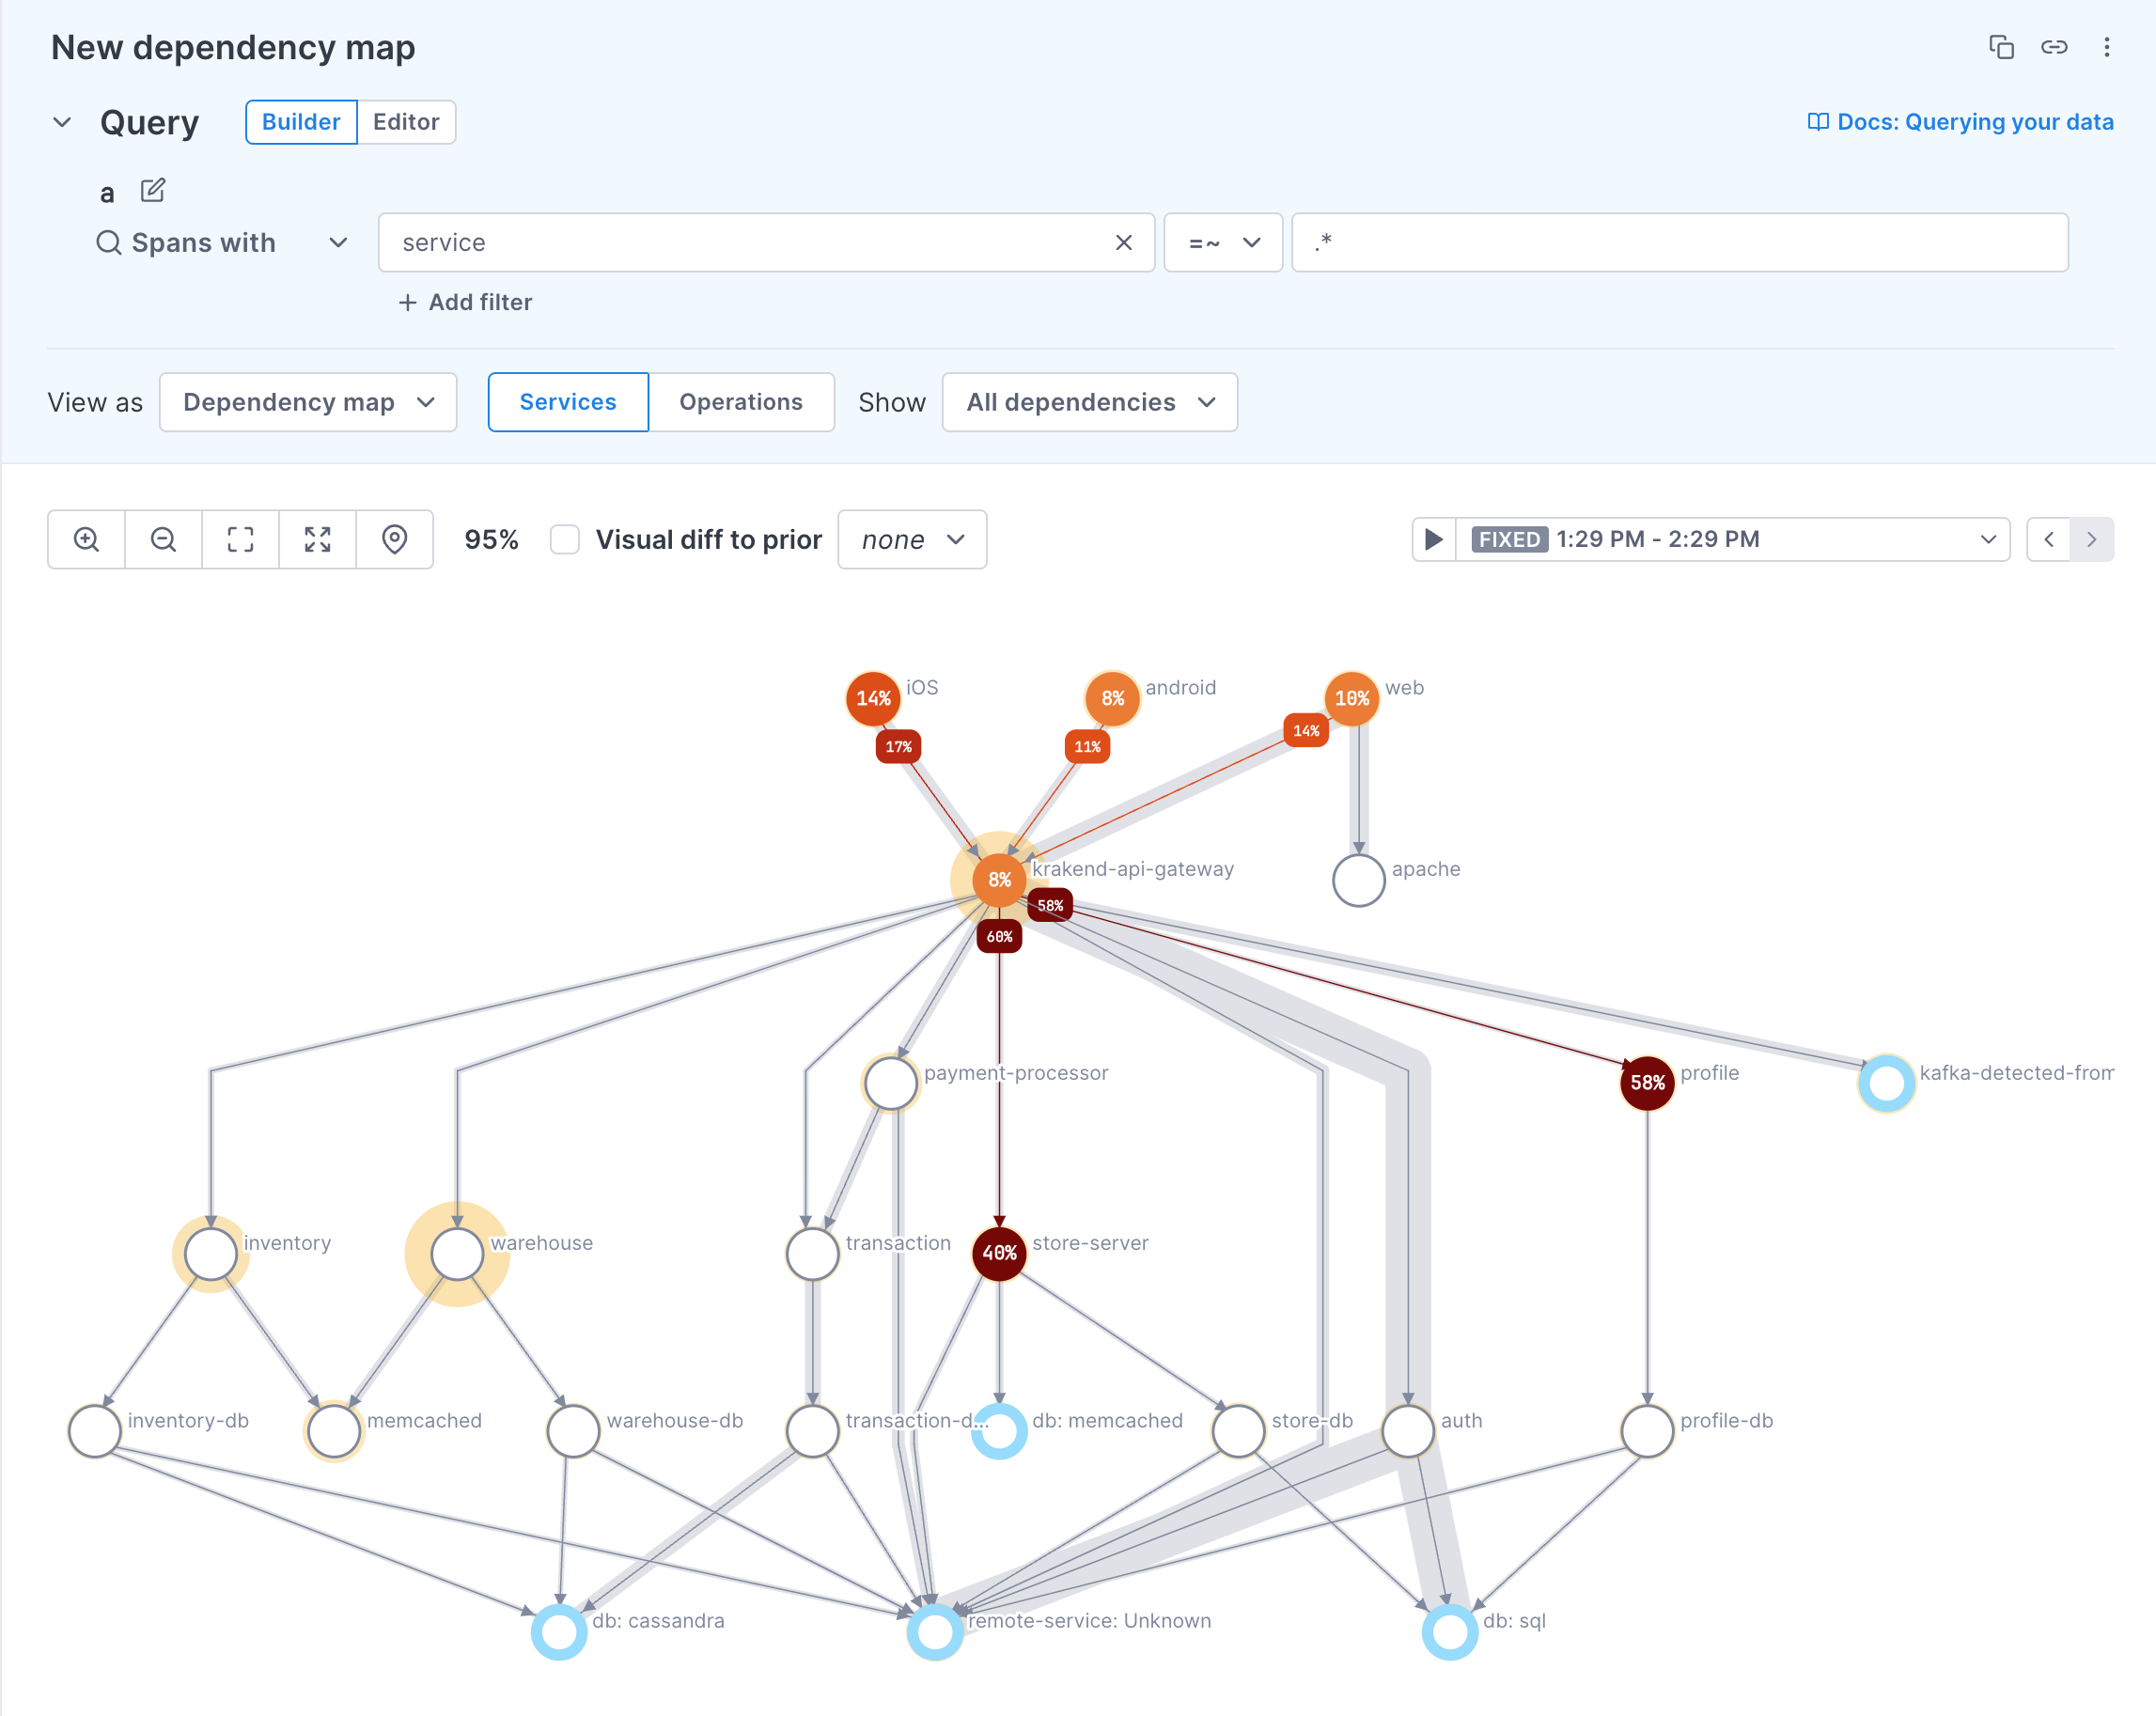
Updated dependency map and service diagram
The visualization for dependency maps and service diagrams has been updated to give you more insights into the performance of your system. These visualizations now show:
- Error percentages for services and operations, as well as relative color coding to show you where errors are happening most frequently.
- Error percentages for the edges of services and operations, differentiating between errors in the service and errors being propagated from further down the stack.
- Traffic between services and operations with relative shading to depict higher levels of traffic.
- (BETA) Comparison of current performance to past performance, highlighting areas where there has been degradation (dependency maps only).
Updated May 8, 2024