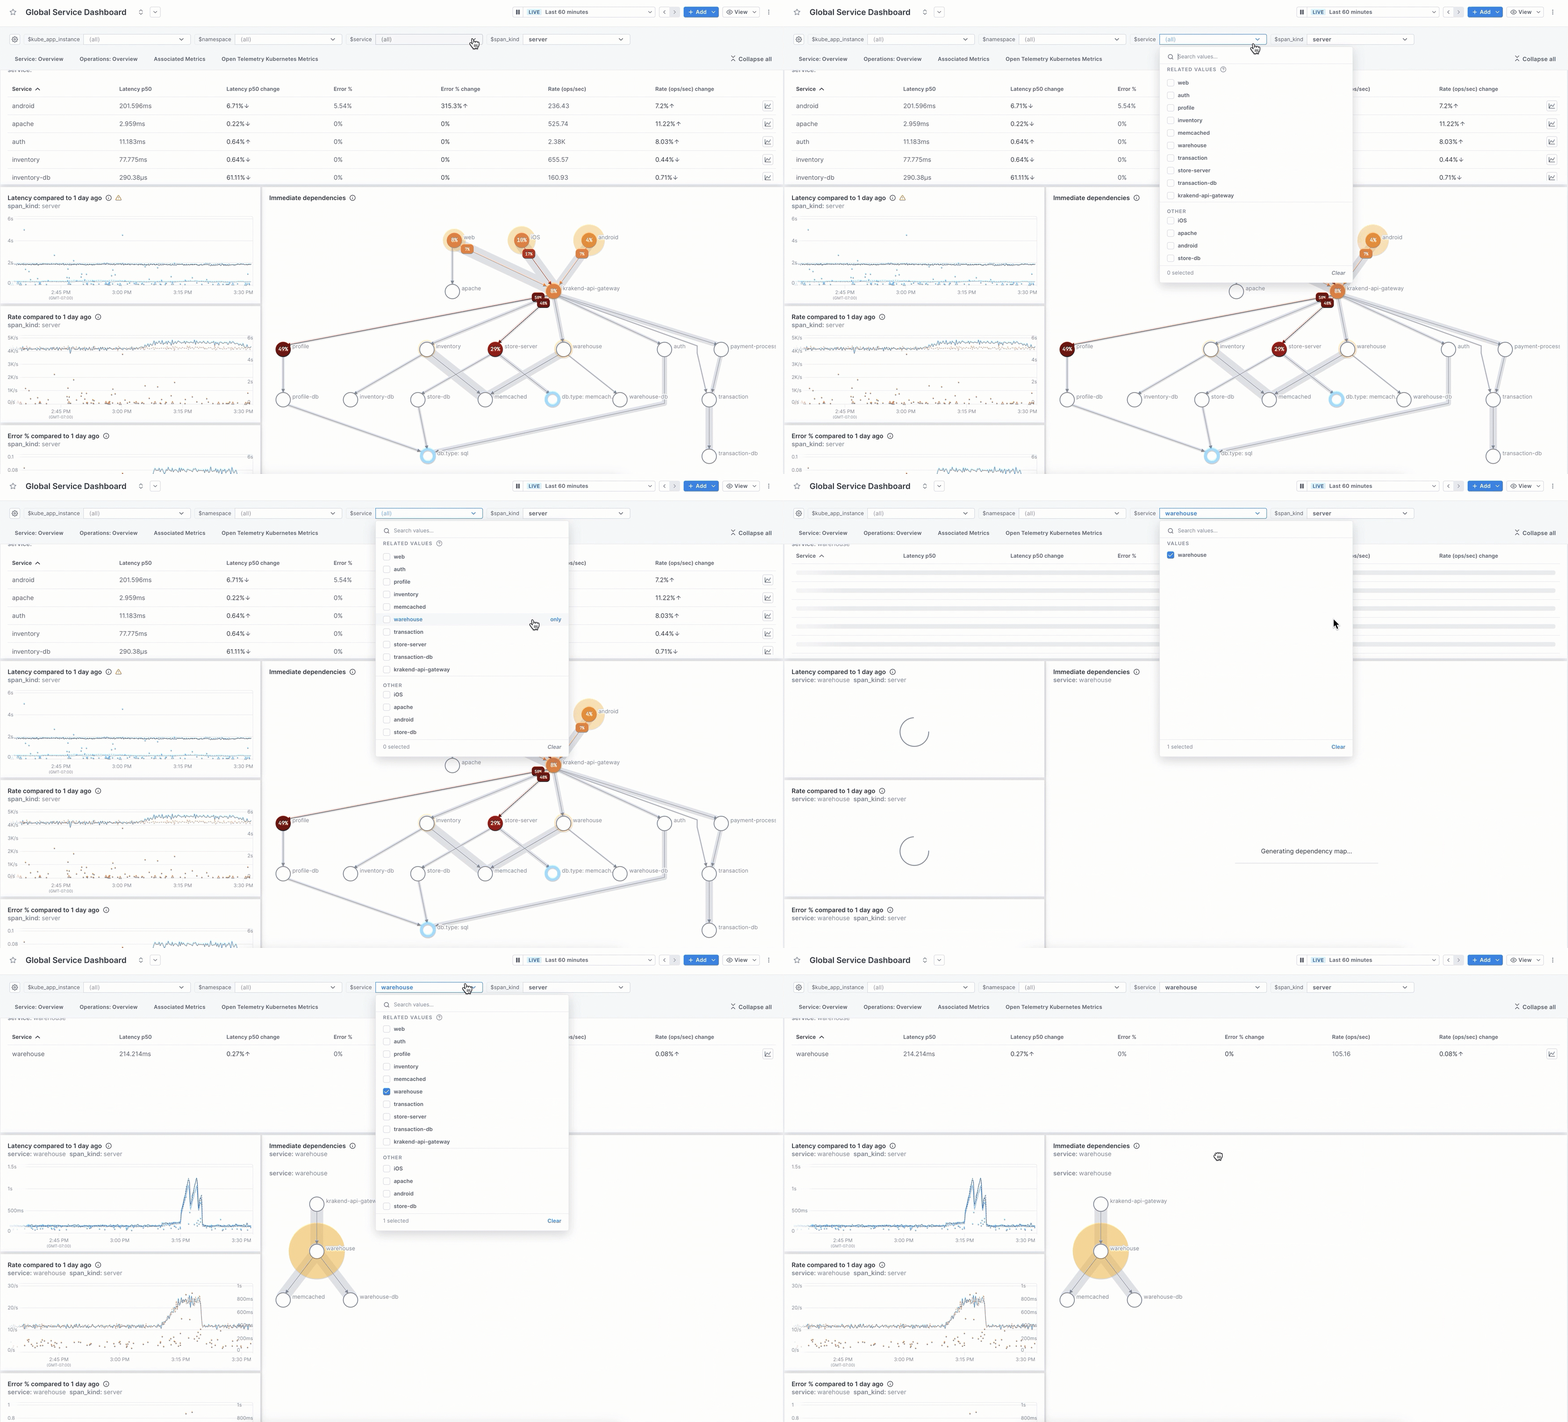
Template variables allow you to dynamically filter charts in a dashboard based on attribute values returned by the data. Instead of creating a chart for each value, you create one chart and then filter the dashboard to a specific value.
For example, say you want to view the health of your services. Instead of creating a separate dashboard for each service, you create one dashboard that uses service as a template variable. On initial load, the charts show data using the default value of the variable (usually all, so in this case, from all services). You use the variable dropdown to select only the service you’re interested in.

To learn more, see Use template variables.
Updated May 31, 2023
