You can now add tricharts to a dashboard or notebook. Tricharts display latency, rate, and error percentages, all on one chart. This set of metrics is considered the most helpful in understanding the overall health of microservices.
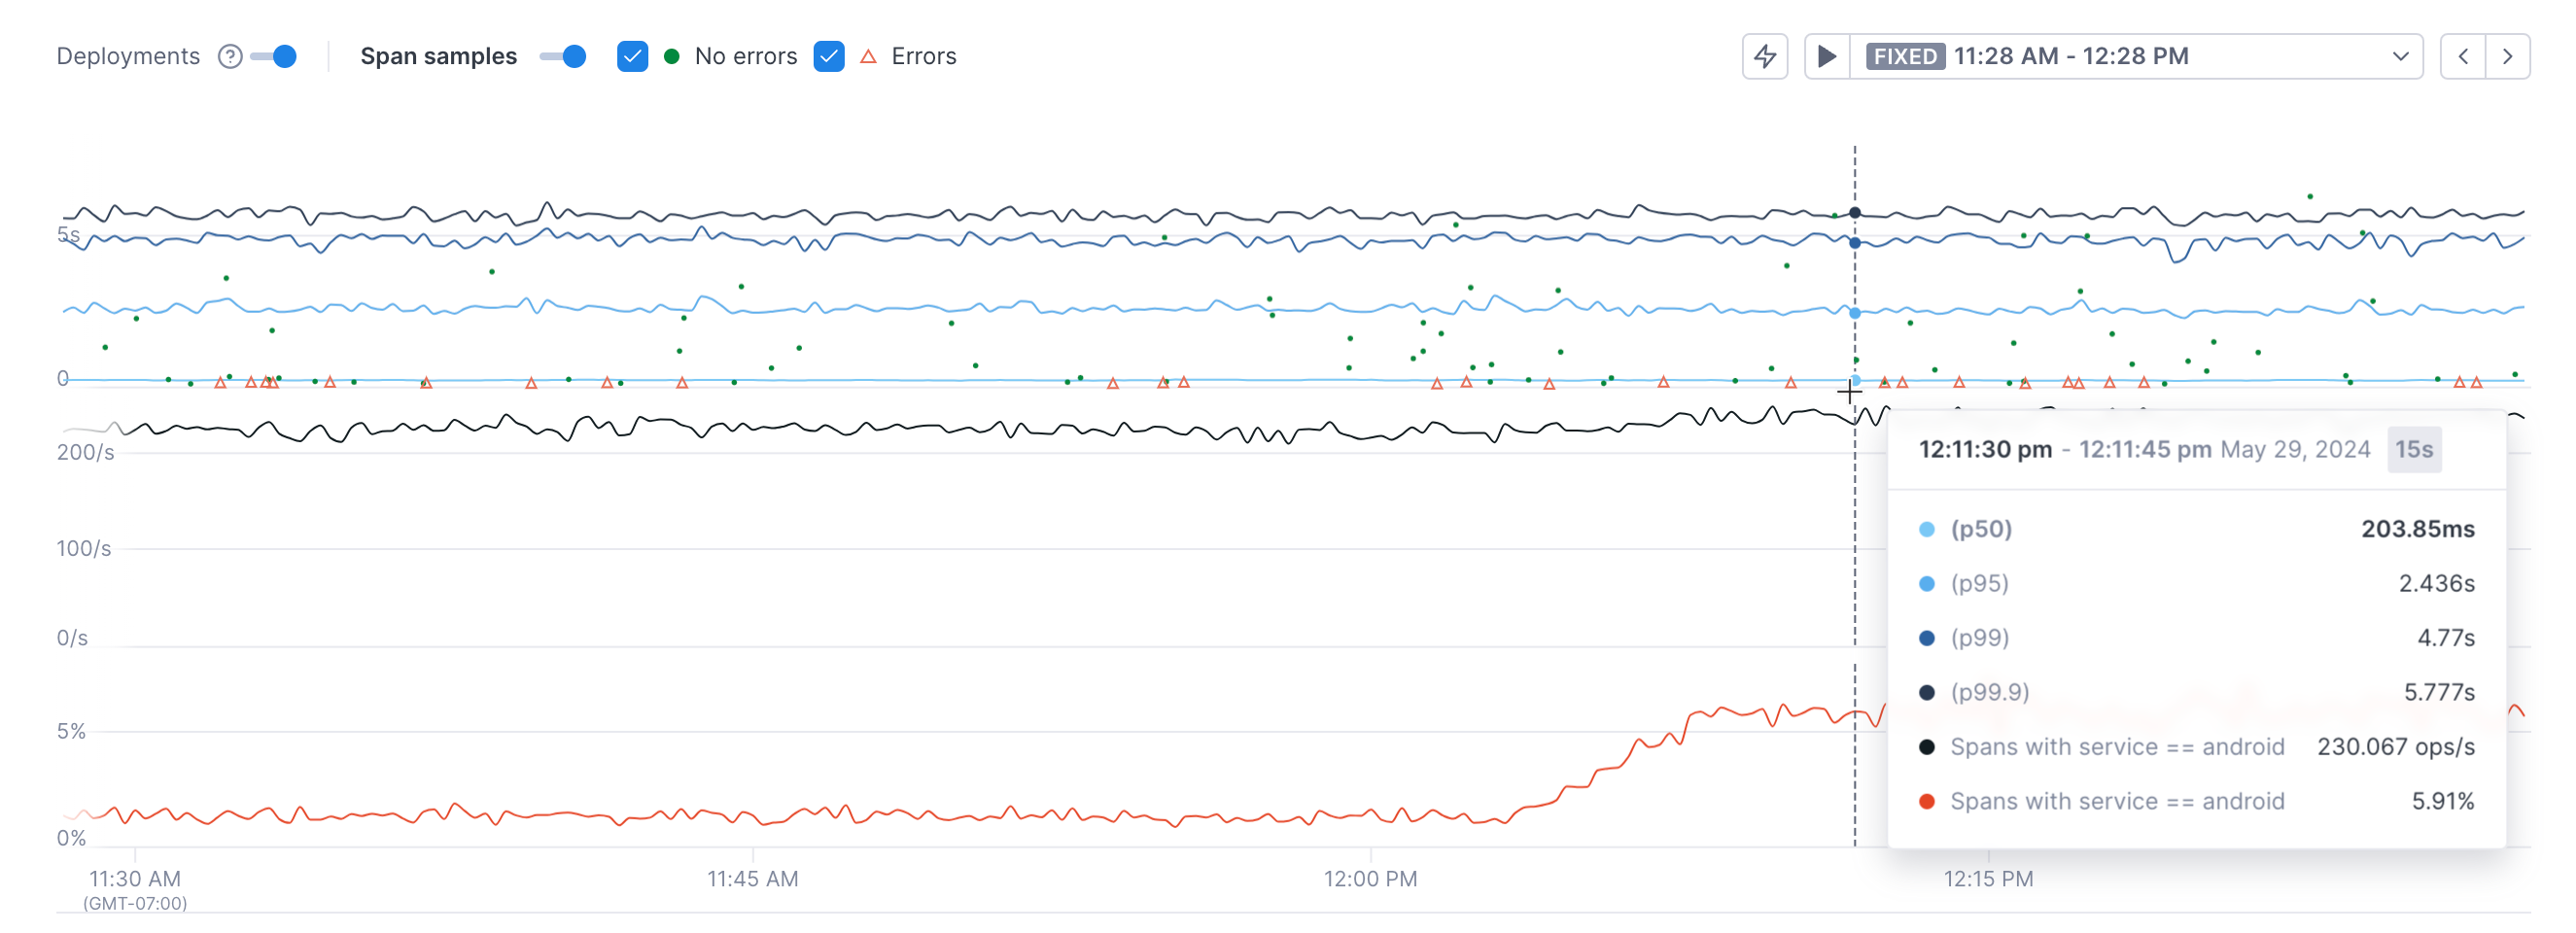
Now when viewing an operation or Stream from the Service directory, instead of three separate charts being added to a dashboard or notebook, only the trichart is added.
Updated Jun 12, 2024