Cloud Observability offers a plugin for Grafana that allows you to view Stream charts directly in Grafana. You can navigate directly from the chart in Grafana to Cloud Observability where you can continue your investigation.
Looking for our metrics plugin for Grafana instead?
The Grafana Stream integration is on a per-project basis. If you want this integration for multiple Cloud Observability projects, follow these instructions for each of your projects.
Prerequisites
You’ll need the following to enable and use the plugin:
- Your Cloud Observability Project and Organization name. You can find that information in Project settings and Account management.
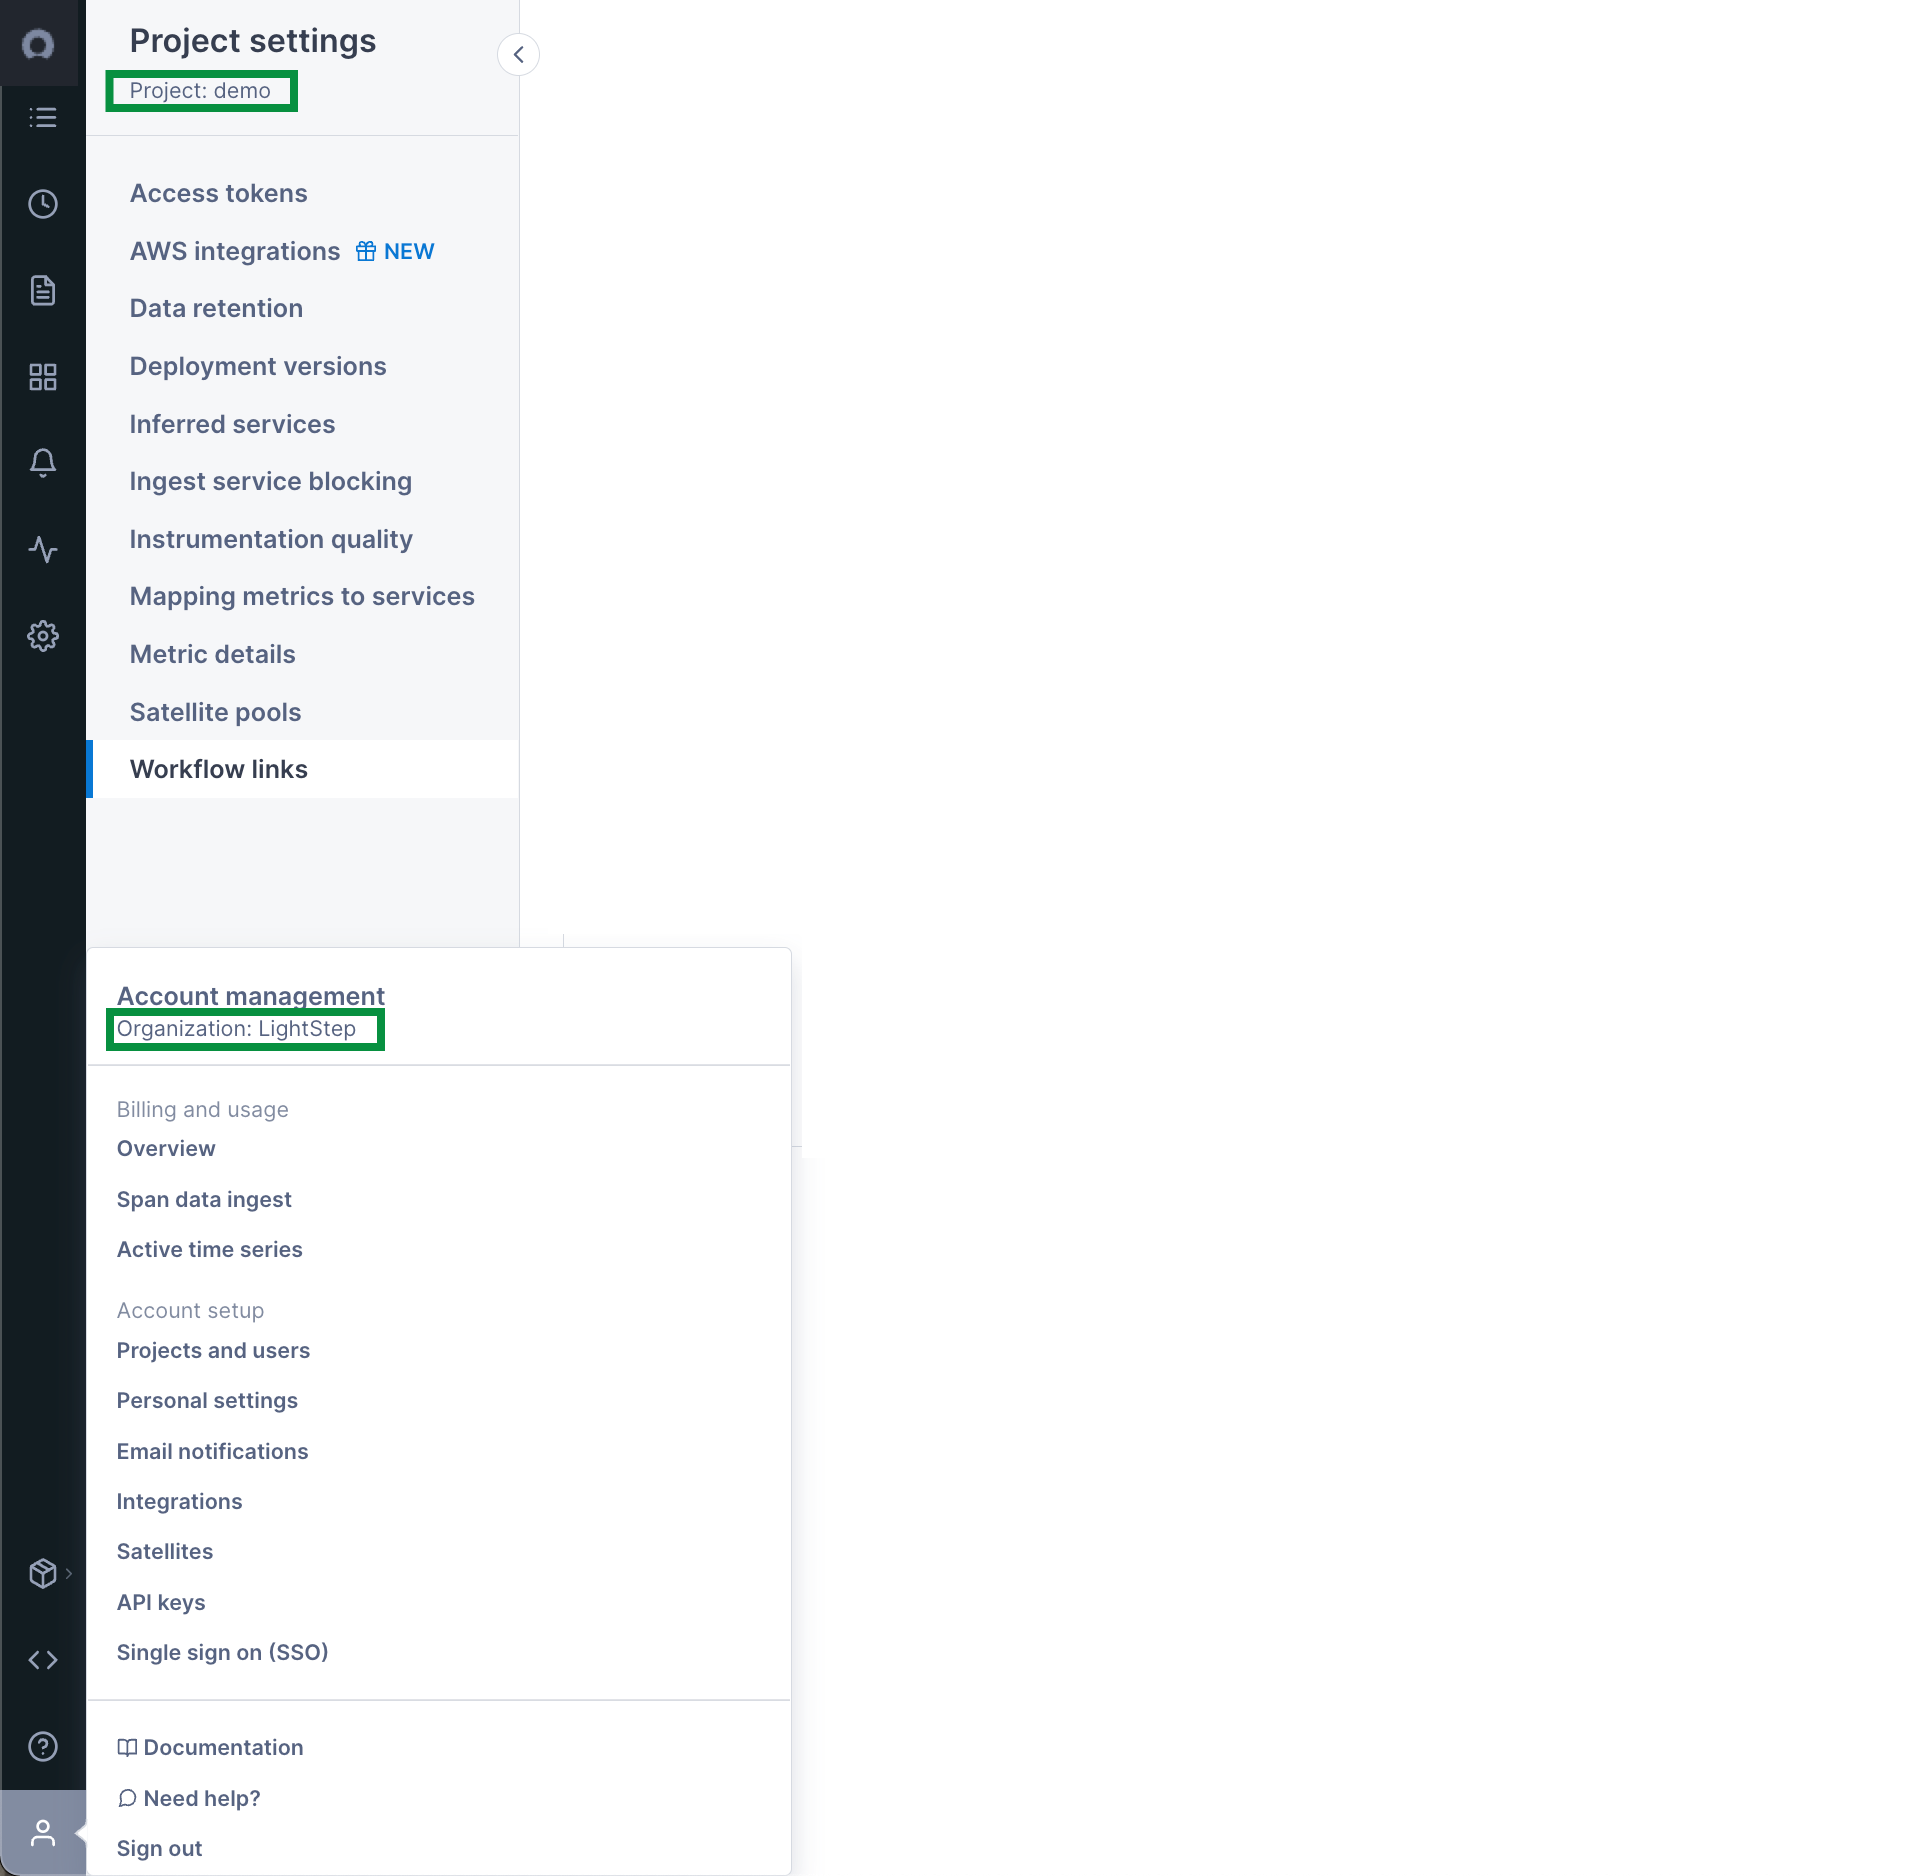 .
. - An API key created just for Grafana.
- Existing Streams in Cloud Observability.
Installation
Install the plugin from the Grafana CLI using Grafana’s plugin installation instructions.
The Cloud Observability plugin is located in GitHub, and the zip archive is available from the Release page.
1
grafana-cli --pluginUrl https://github.com/lightstep/lightstep-grafana-plugin/releases/download/v1.2.0/lightstep-grafana-plugin-v1.2.0.zip plugins install lightstep-tracing-app
Enable the Cloud Observability plugin in Grafana
After you install the plugin, follow these steps:
Steps may vary slightly depending on your version of Grafana.
- Restart the
grafanaserver so it can discover the new plugin. - On Grafana’s Home Dashboard, on the right, click Enable Now for the Lightstep App.
- Click on the Grafana menu icon on the top left, and select Data Sources.
- On the top right, click Add data source.
- Set the name of your new data source (e.g. Lightstep).
- Set the type to Lightstep.
- Set your Organization and Project name.
- Set your API key.
- Make sure you leave the Access setting under Advanced set to
Proxy. - Hit Add at the bottom to save your new data source.
Use the Cloud Observability plugin in Grafana
With the Lightstep plugin installed, you can query your Lightstep streams directly from Grafana.
- In the Edit Panel view, make sure Lightstep is selected as the data source.
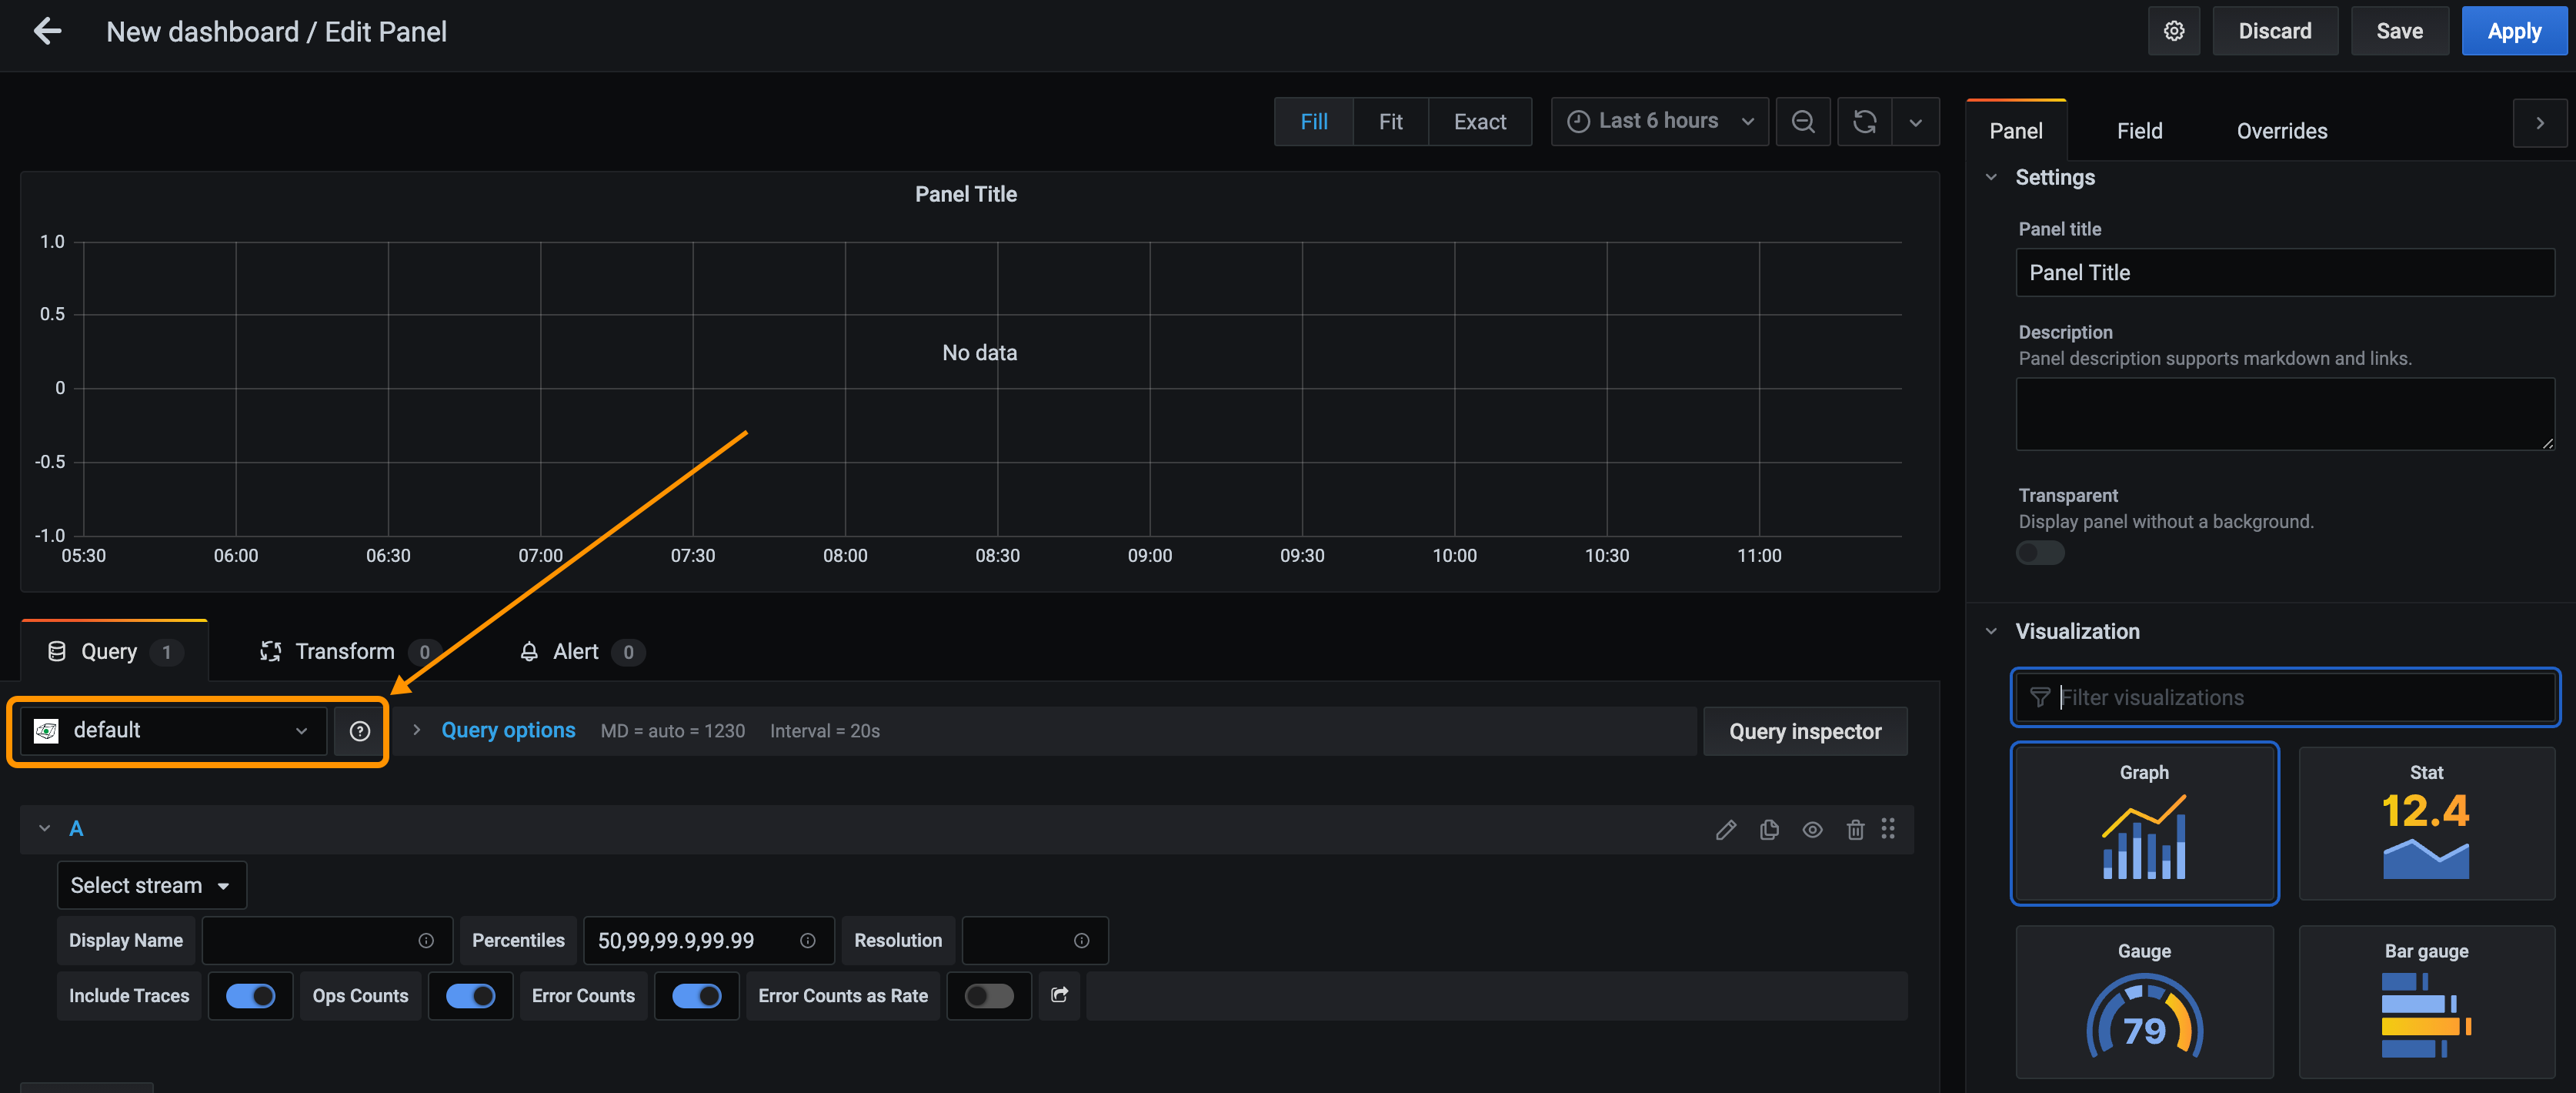
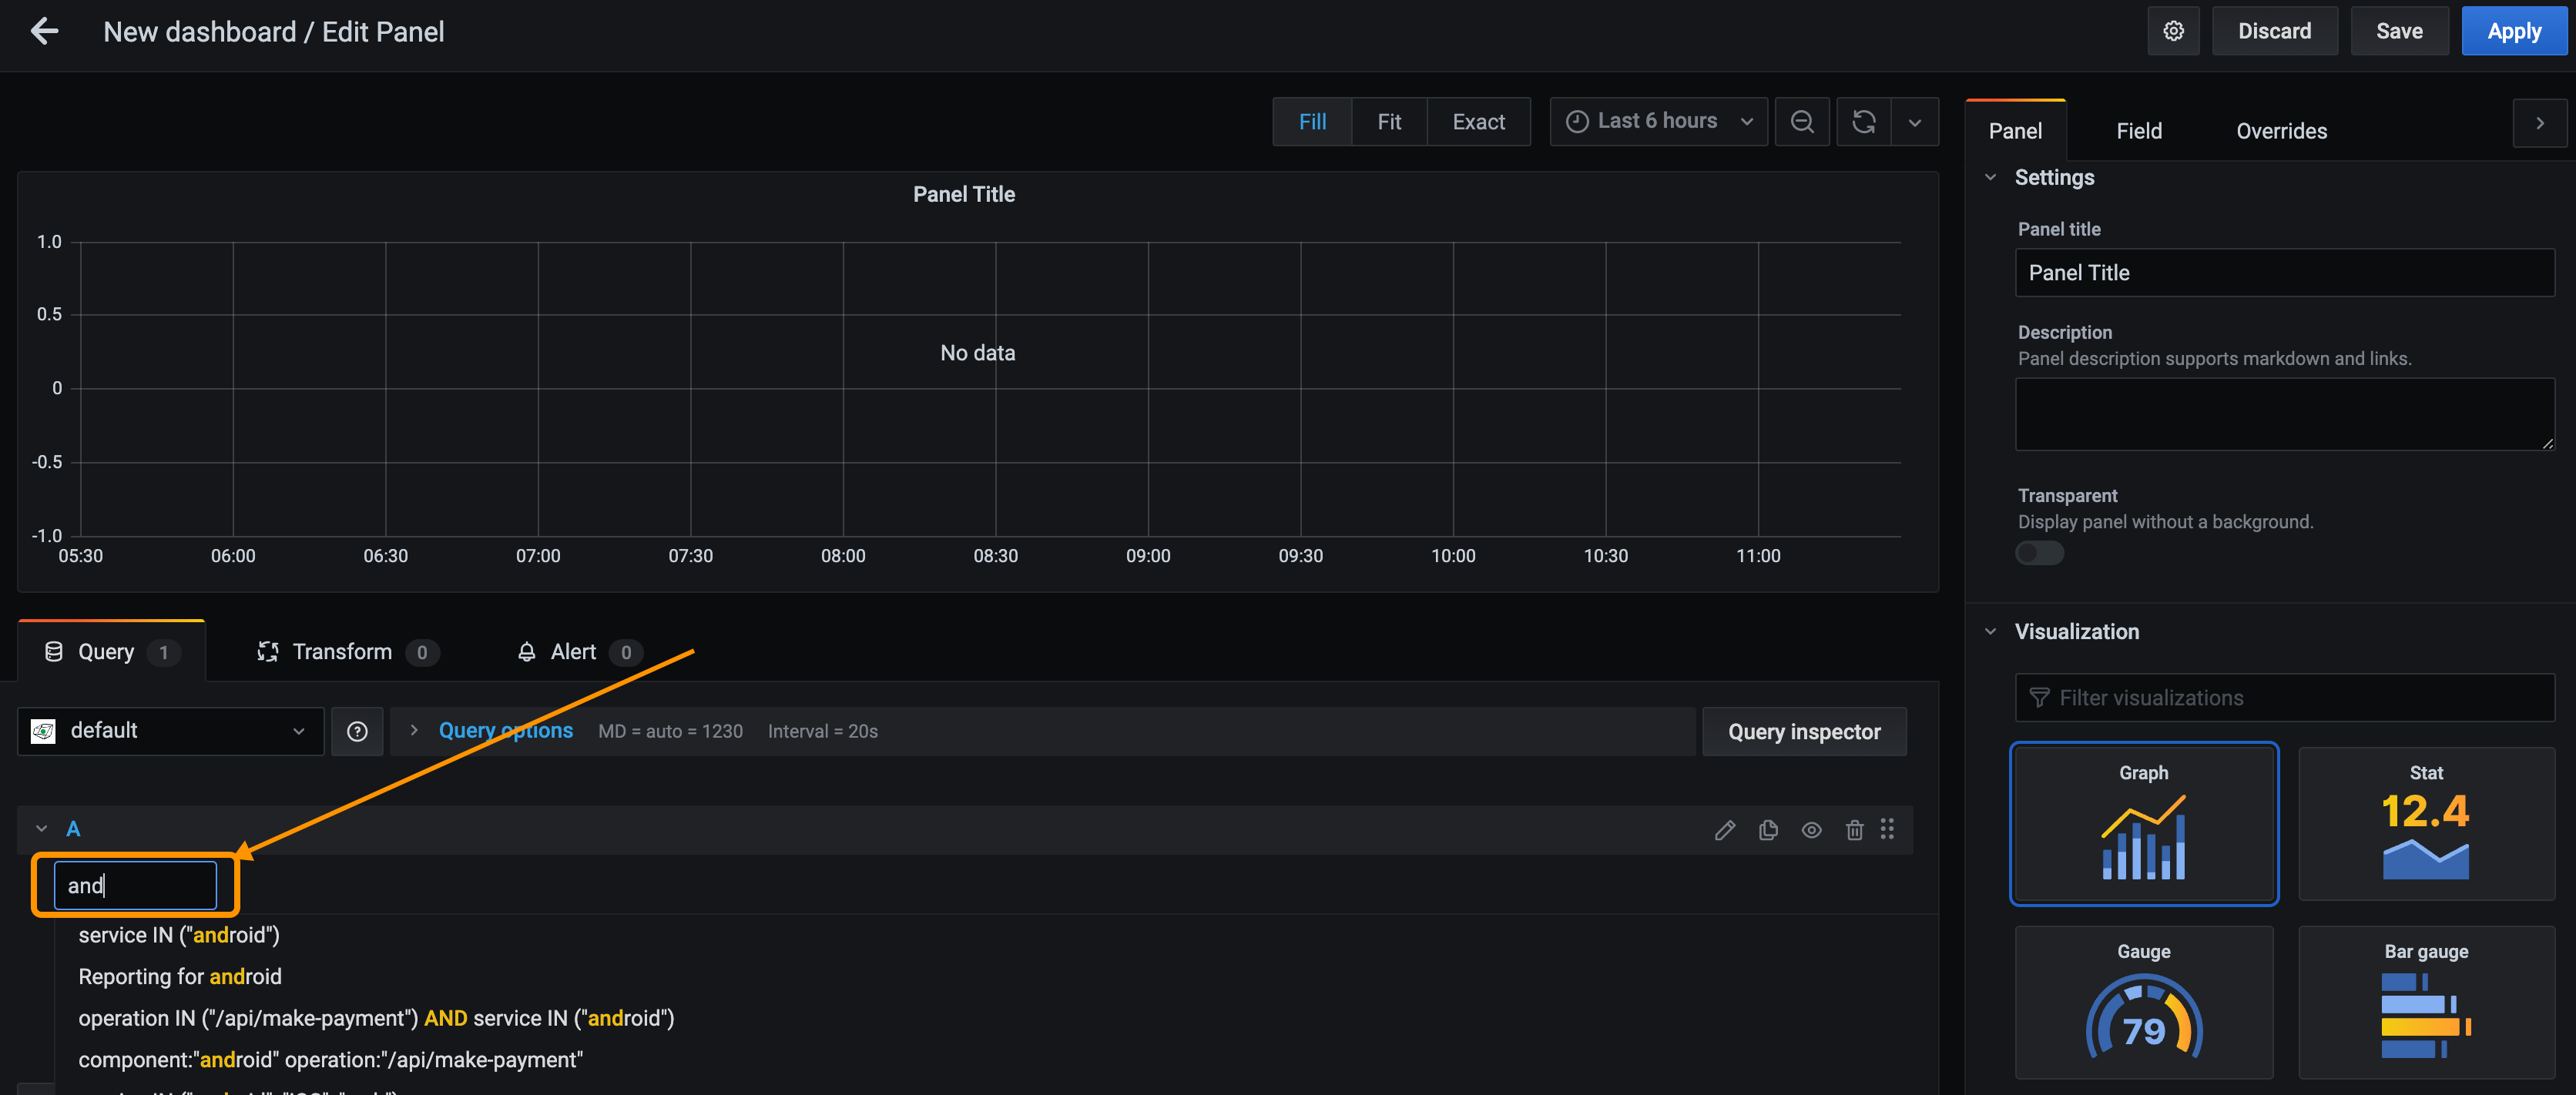
- In the Select stream dropdown, start typing the Stream’s name to find it.
- To visualize the data correctly, in the Visualization Panel, select Lightstep Graph.
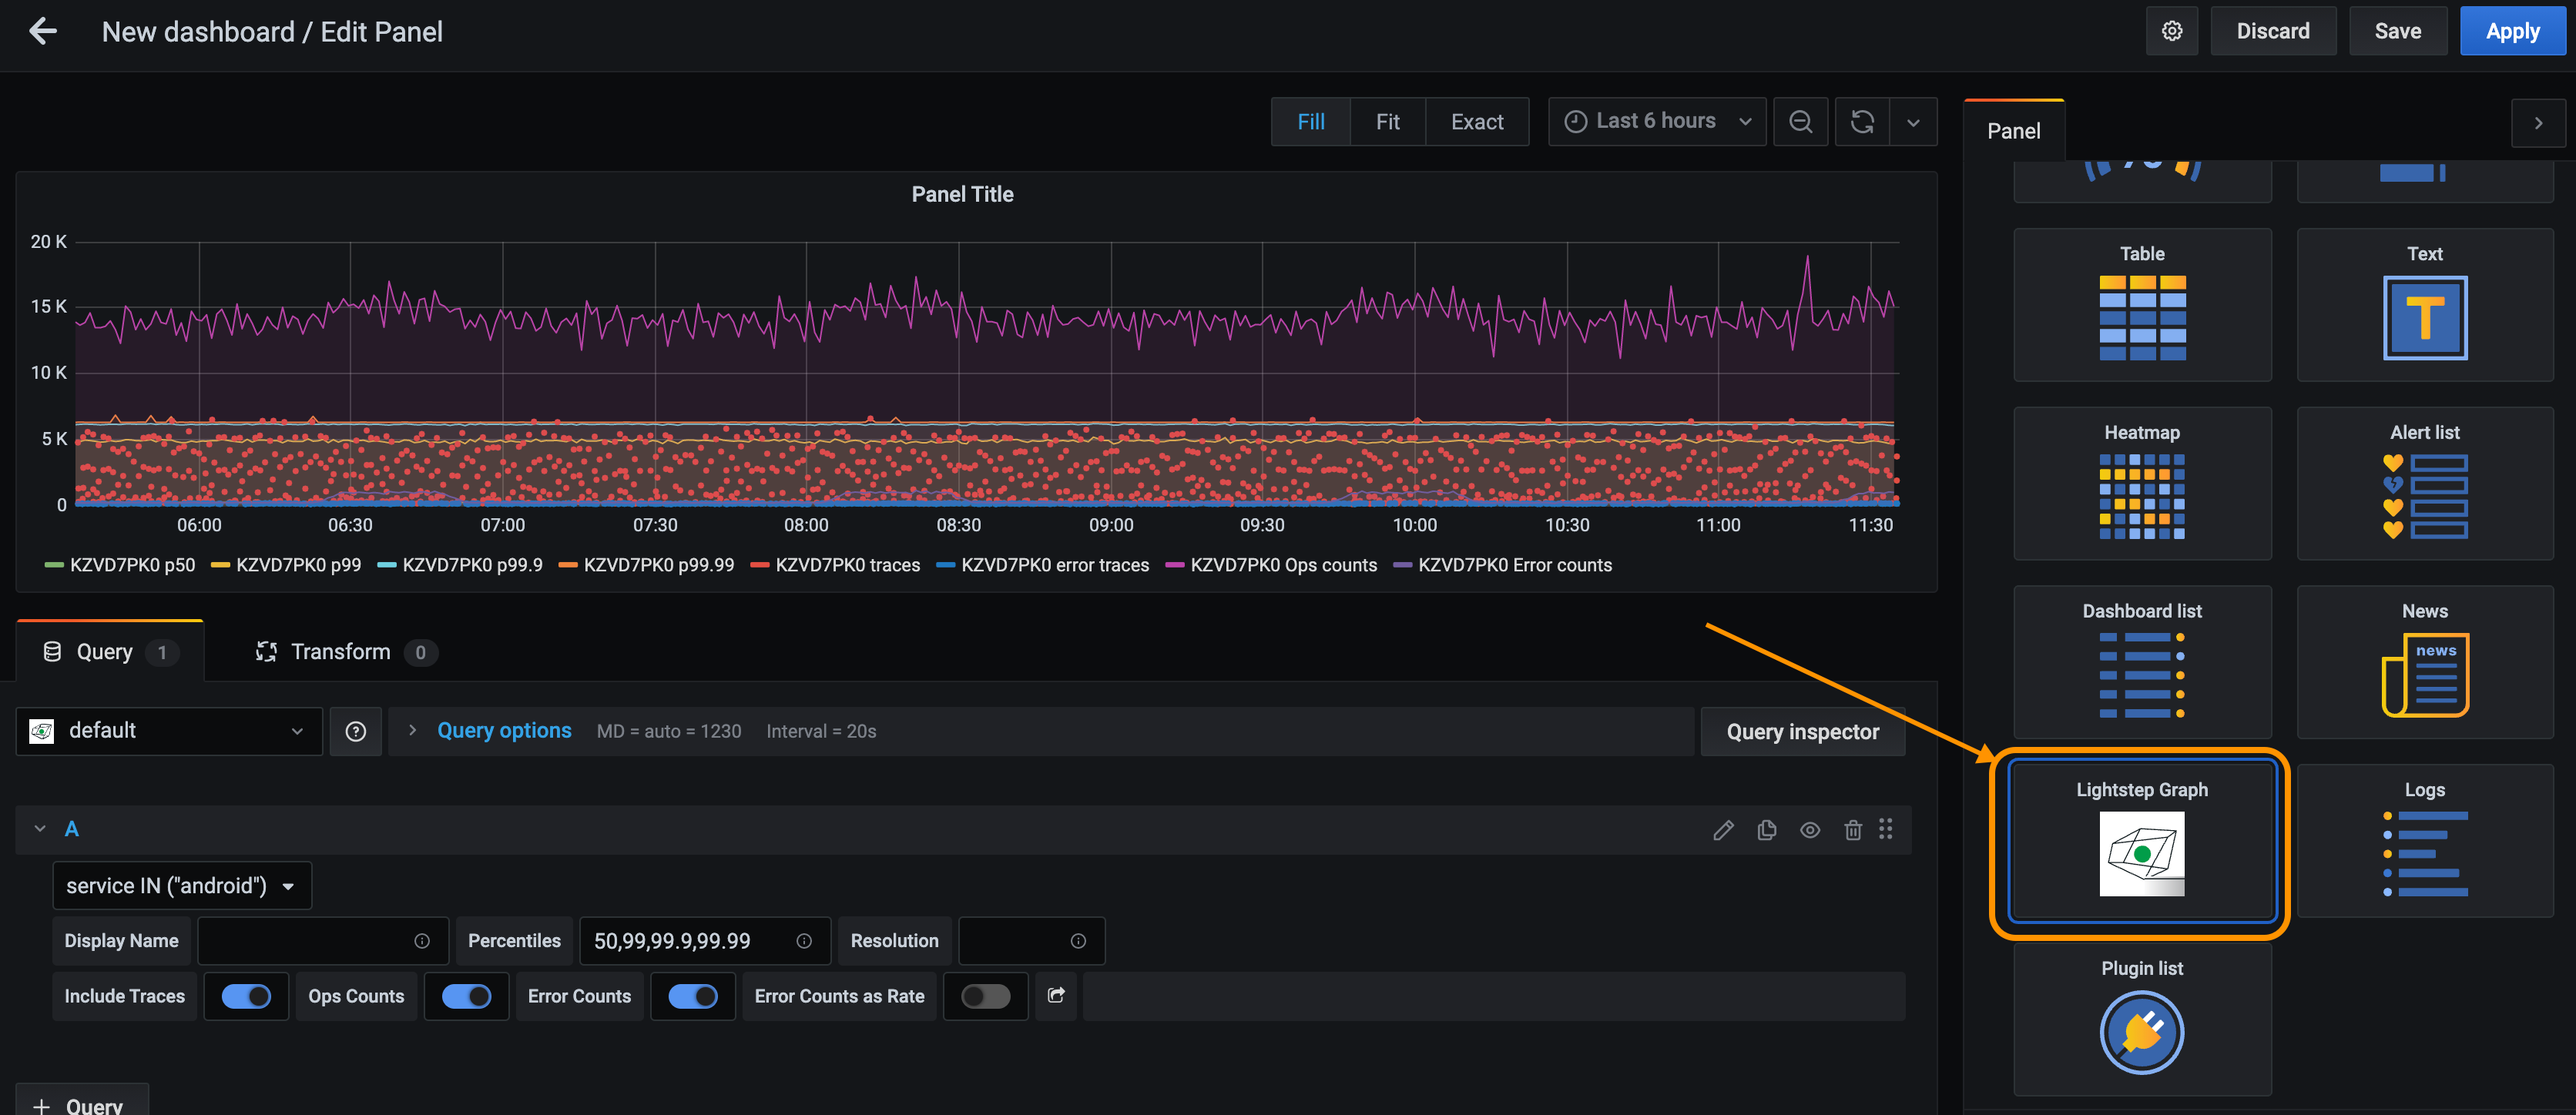
- Click Apply to create the graph.
When viewing the graph, you can navigate to a trace in Cloud Observability by clicking any of the exemplar traces in the graph.
Updated Oct 14, 2020