
View alert examples and adapt them to your system.
The sections below show queries for Cloud Observability’s alert templates. For the basics on creating alerts and configuring thresholds, visit Create alerts.
Custom alerts
Alert on metric values
This alert triggers if a service’s disk usage is above 85%.
In the alert query, the gauge metric, disk.percent_used reports the disk utilization as a float between 0 and 100.
Grouping by service and using the max aggregator ensures the alert triggers if any service has a disk usage percentage above 85%.
The final reducer (reduce 10m, mean) smooths the data, reducing the likelihood of a flappy alert – it only alerts if the average over the last 10 minutes is above 85%.
For the alert threshold, set Critical threshold to 85.
The alert triggers if a service’s disk usage is above 85% over the last 10 minutes,
1
2
3
4
metric disk.percent_used |
latest 30s, 30s | # this aligner is required, because it's a gauge metric
group_by [service], max |
reduce 10m, mean
Alert on latency SLOs
This alert triggers when ingress-operation latency for the api-proxy service is above 1000ms.
The alert query is a latency spans query filtered to an operation and service, excluding errored requests.
For the alert threshold, set Critical threshold to above 1000ms.
1
2
3
4
5
6
spans latency |
delta 1h |
# look at the ingress operation for the api-proxy service and exclude "bad" requests
filter operation == "ingress" && service == "api-proxy" && http.status_class != "4xx" && error != true |
group_by [], sum |
point percentile(value, 99.0) # take the 99th percentile of latency
Alert on error percentages
This alert triggers if the rate of errors for a service is above a certain threshold.
The alert query is an error percentage alert that takes the ratio of spans for a service that have the tag error=true against all spans for that service.
You set the threshold in the Alert configuration section.
1
2
3
4
with
	errors = spans count | delta | filter service == warehouse && error == true | group_by [], sum;
	total = spans count | delta | filter service == warehouse | group_by [], sum;
join errors/total * 100
Change alerts
Alert on changes over time
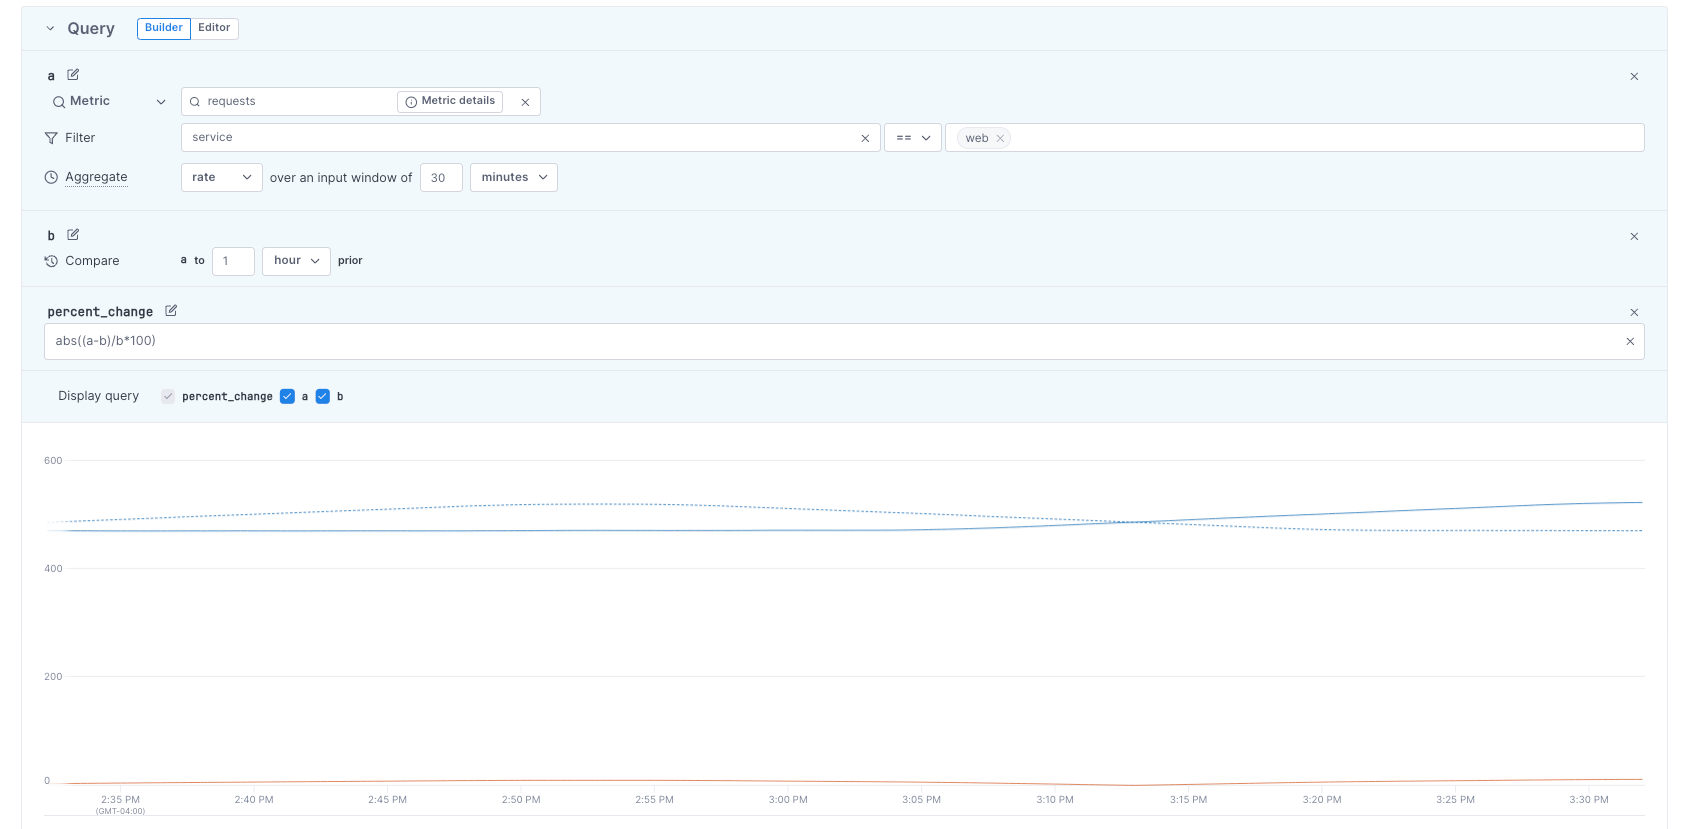
This alert uses the Change template to query request rates aggregated every 30 minutes (a), compared to the same data from one hour ago (b). The join formula (abs((a-b)/b*100)) calculates the absolute percentage change between a and b.
The chart visualizes the query results, showing all three series (a, b, and abs((a-b)/b*100)).
The query’s join formula affects how you configure alert thresholds. The join formula below (abs((a-b)/b*100)) uses the abs() arithmetic operator. abs() returns non-negative values, for example, the absolute values of -2% and 3% are 2% and 3%. With abs(), you’ll set alert thresholds for the overall change instead of the change’s direction. For example, if your alert threshold is above 150%, you’ll be notified if the percentage change is either -151% or 151%.
The same formula without abs() ((a-b)/b*100) lets you set alert thresholds based on the direction of the change. For example, if your alert threshold is above 150%, you’ll be notified if the percentage change is 151% but not -151%. Similarly, if your alert threshold is below -150%, you’ll be notified if the percentage change is -151% but not 151%.
For Change alerts, you may see this note under Alert configuration:
Your alert will activate in X days when Cloud Observability has enough data to run the alert query.
Because Change alerts use historical data, Cloud Observability may need to wait and collect that data before evaluating your alert.
Cloud Observability automatically activates the alert when ready.
You can check your alert’s status in Cloud Observability’s Alerts tab.
Alert on seasonality
Use a seasonality alert if an endpoint has fairly predictable daily traffic patterns and you want to be alerted if that pattern changes.
In the alert query, the season is short (one day).
The alert triggers if the current number of requests, averaged over the last hour, differs by more than 20% from yesterday’s average (over the same hour window).
For the alert threshold, set Critical threshold to above 20.
1
2
3
4
with
 req = metric requests | reduce 1h, mean | group_by [], mean;
 baseline = metric requests | time_shift 1d | reduce 1h, mean | group_by [], mean;
join abs((req-baseline)/baseline) * 100
Composite alerts
Alert on short- and long-term rates
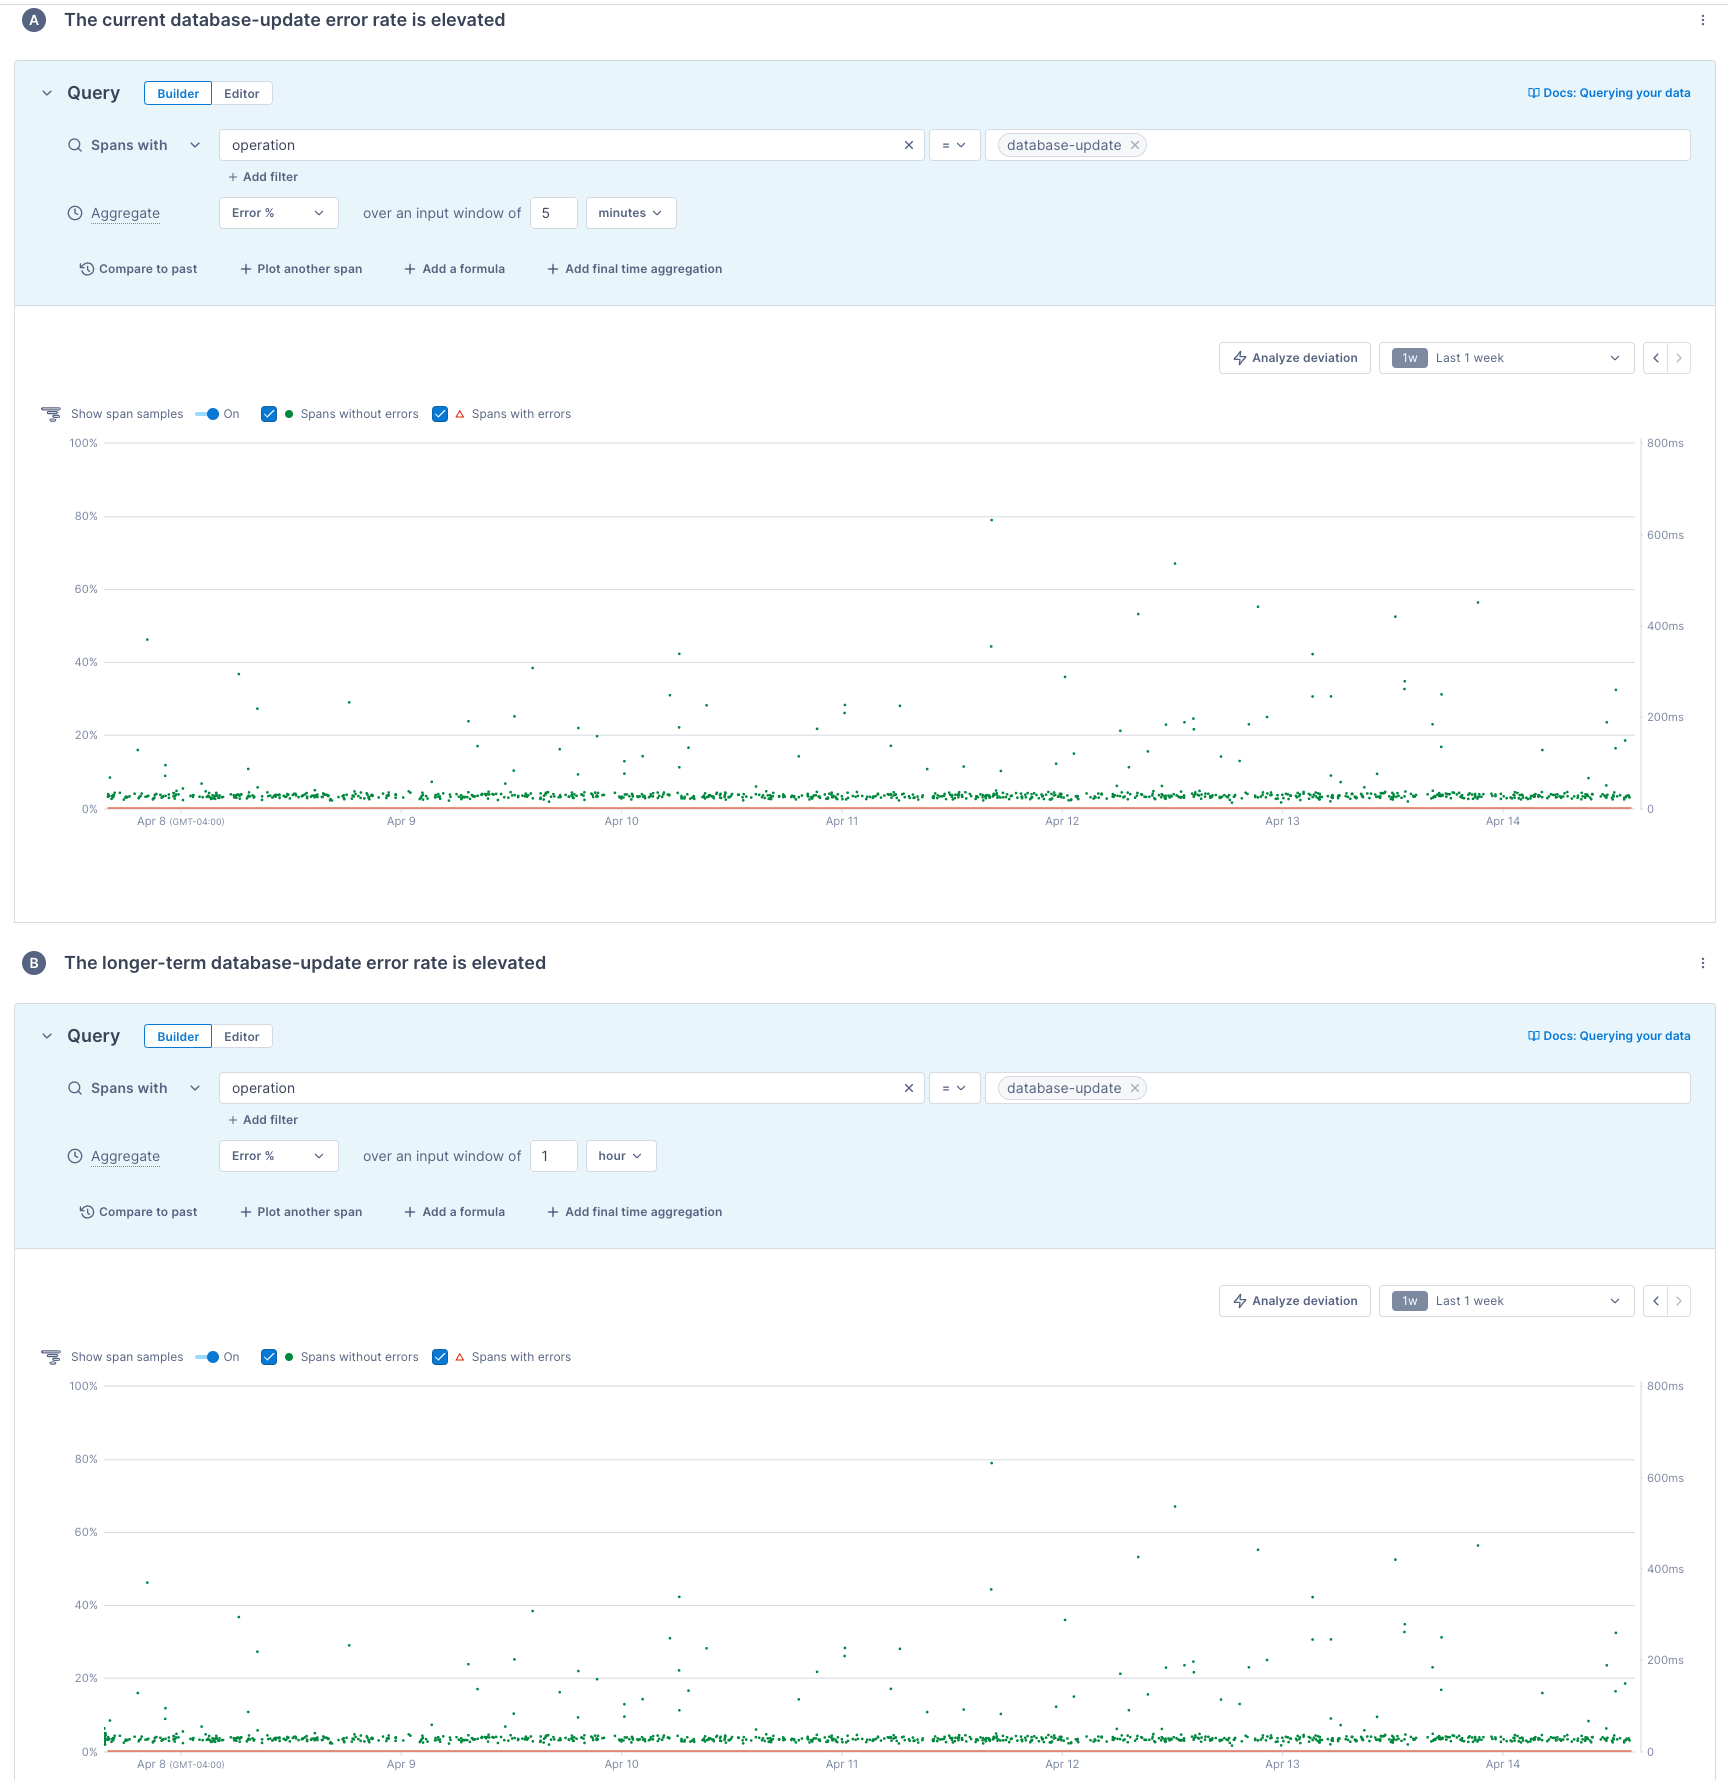
This example uses the Composite template to alert if short- and long-term rates meet a threshold.
The alert has two queries. You can add up to ten queries by clicking Add another alert.
The two queries return short- and long-term error rates, and the charts visualize the results:
- Query A requests error rates calculated over five minutes.
- Query B requests error rates calculated over one hour.
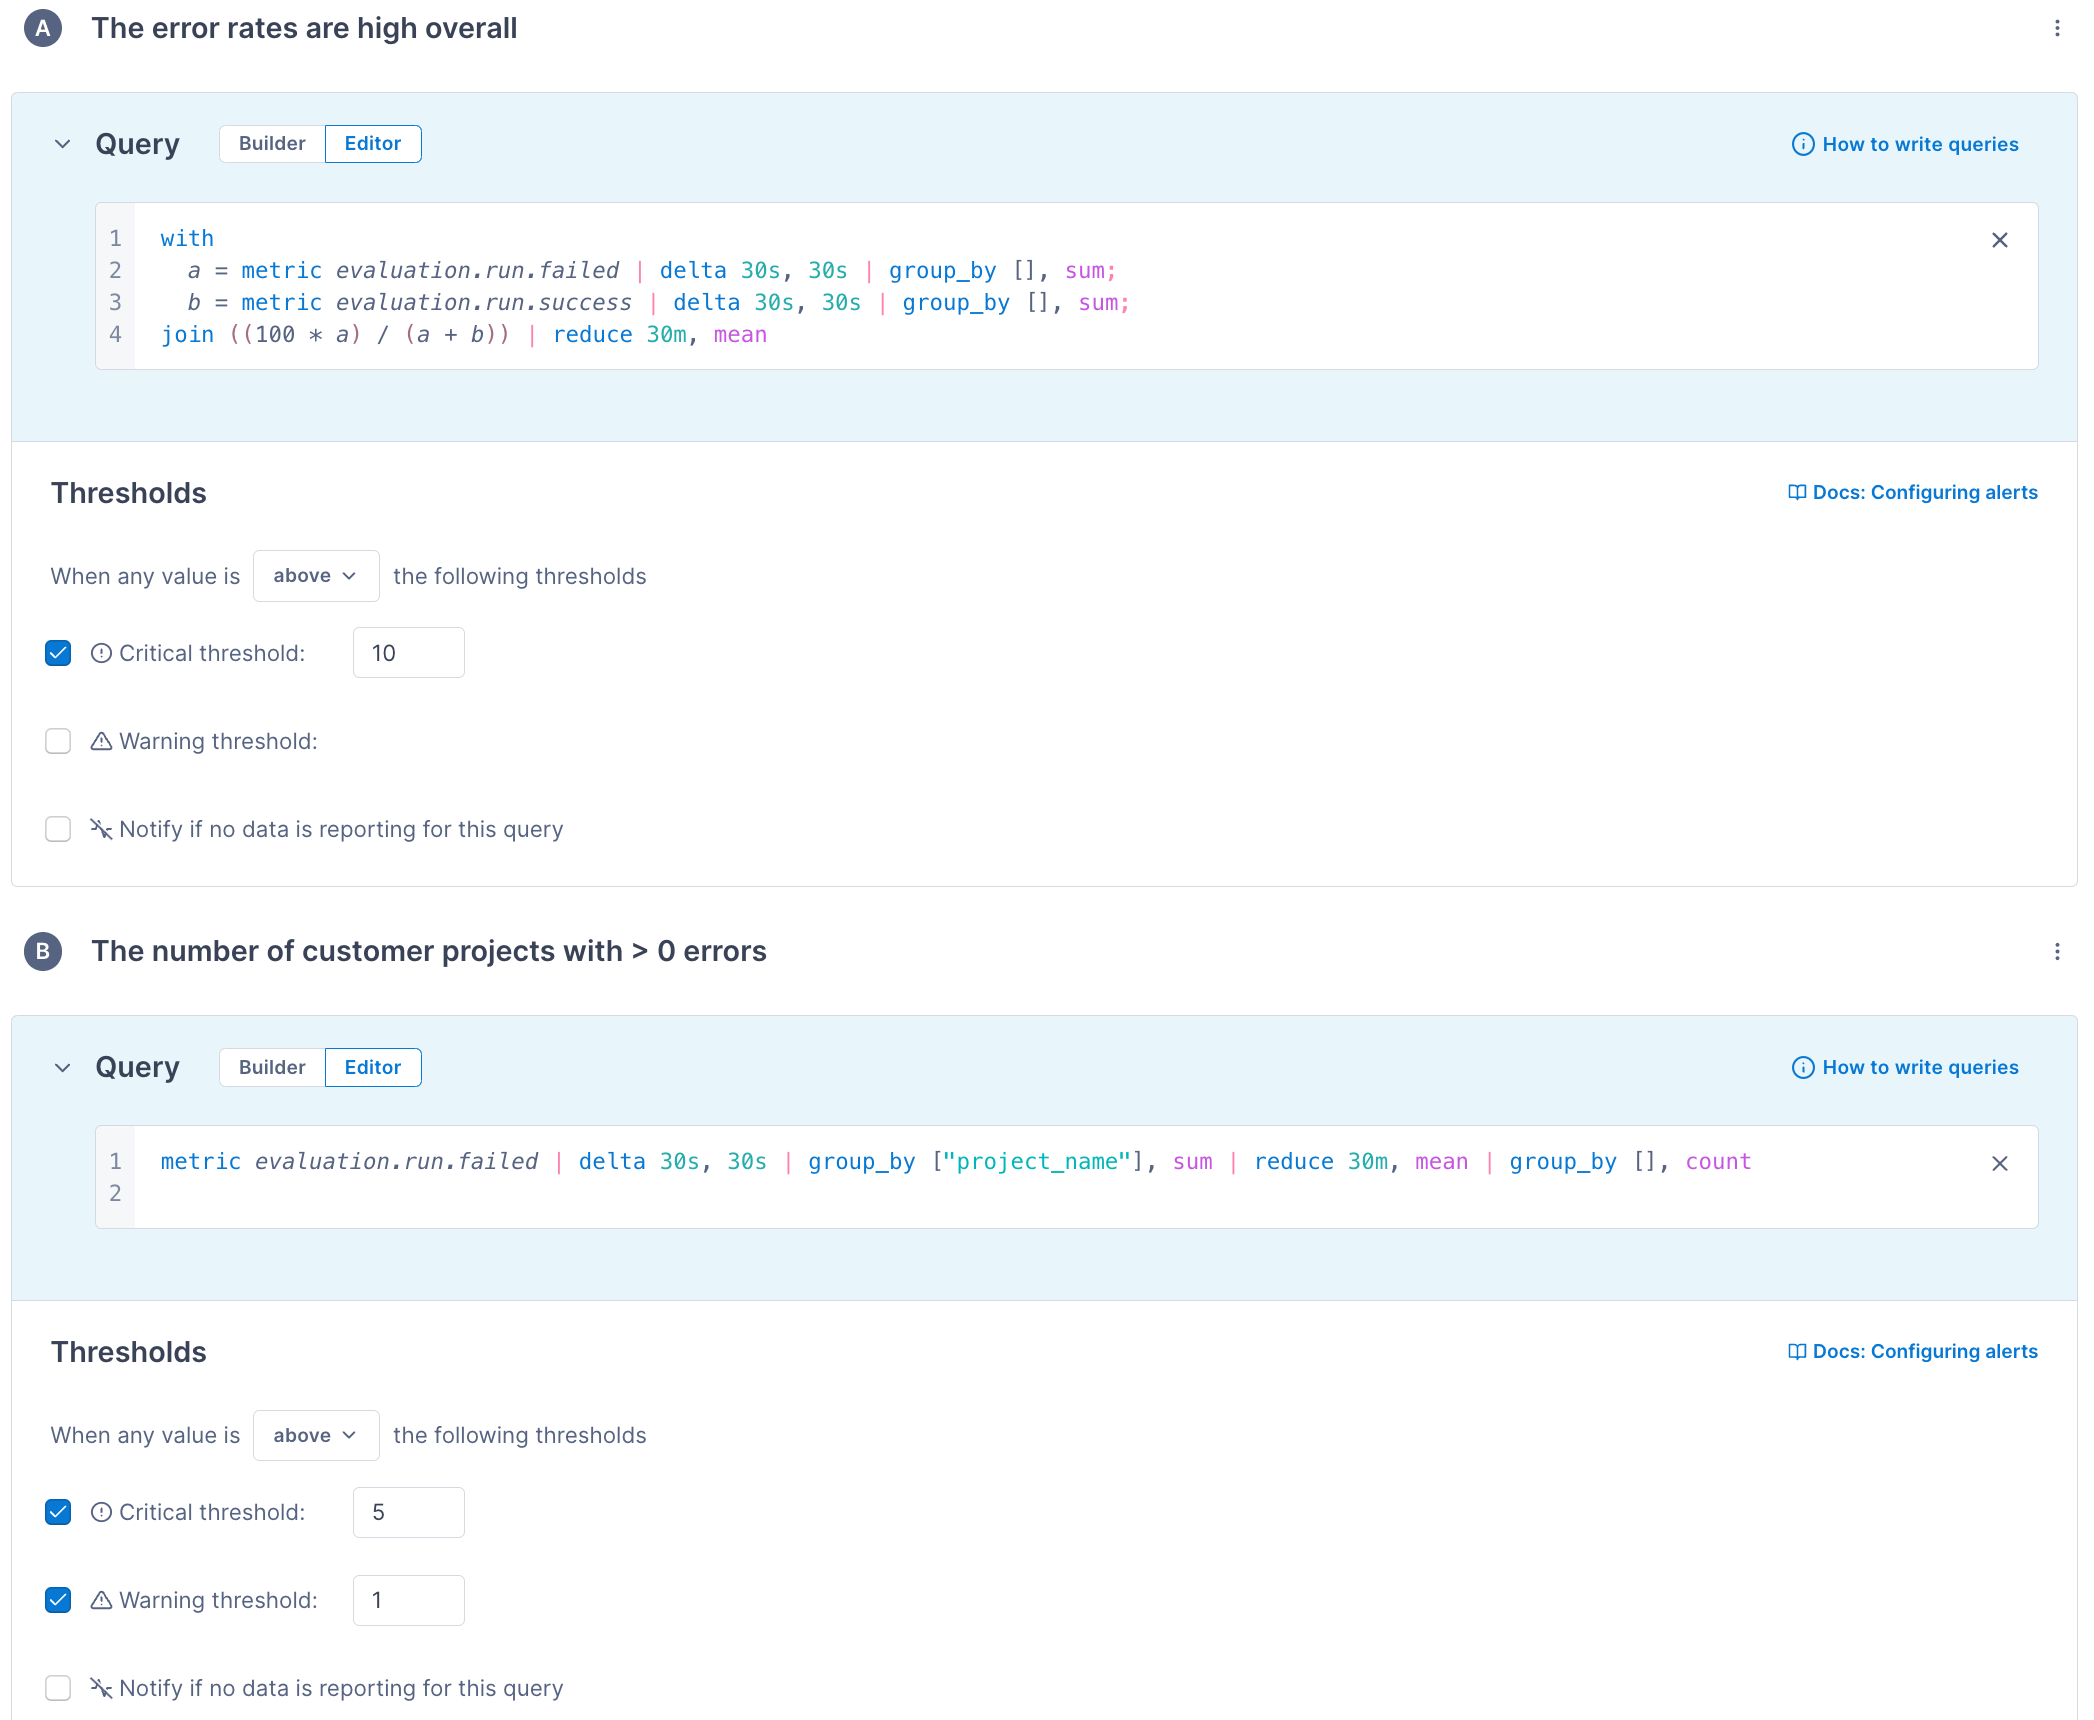
Alert on how many customers experience an issue
The Composite alert below monitors how many customers experience an issue. It only sends alert notifications if the two sub alerts trigger:
-
Sub alert A sets a threshold for an overall error rate:
1 2 3 4
with a = metric evaluation.run.failed | delta 30s, 30s | group_by [], sum; b = metric evaluation.run.success | delta 30s, 30s | group_by [], sum; join ((100 * a) / (a + b)) | reduce 30m, mean -
Sub alert B sets thresholds for the number of customer projects with the relevant errors:
1
  metric evaluation.run.failed | delta 30s, 30s | group_by ["project_name"], sum | reduce 30m, mean | group_by [], count
Anomaly alerts
Alert on unusual, large bursts of traffic
This example uses the Anomaly template to query for large bursts of traffic in a short period. If you set the threshold to above 3, you get alerts when a customer’s request rate is more than 3 standard deviations higher than the past hour’s average.
1
2
3
4
5
6
7
8
9
10
11
12
13
14
15
16
17
18
19
20
with

current = metric requests
  | filter service = web
  | rate 1m
  | group_by [customer], sum;

hourly_average = metric requests
  | filter service = web
  | rate 1m, 1m
  | group_by [customer], sum
  | reduce 1h, mean;

hourly_stddev = metric requests
  | filter service = web
  | rate 1m, 1m
  | group_by [customer], sum
  | reduce 1h, std_dev;

join (current - hourly_average) / hourly_stddev
Alert on standard deviations
Instead of alerting if the number of requests has changed by some percentage since yesterday, you can instead alert if the current number of requests is more than two standard deviations from the mean over the last day. To calculate this, you need three time series: the current number of requests, the average over the last day, and the standard deviation over the last day.
Because you’re taking the absolute value in the query, you don’t need to set both an above and below threshold. The alert triggers if the value is more than two standard deviations from the mean.
1
2
3
4
5
with
	average = metric requests | delta 30s, 30s | group_by [], sum | reduce 1d, mean;
	standard_dev = metric requests | delta 30s, 30s | group_by [], sum | reduce 1d, std_dev;
	actual = metric requests | delta | group_by [], sum;
join abs(actual - average)/standard_dev
Outlier alerts
Alert on uneven load balancing across services
This example uses the Outlier template to query for uneven request load balancing across service instances. If you set the threshold to above 2, you get alerts when a service instance handles more than 2 standard deviations more incoming requests versus its peers.
1
2
3
4
5
6
7
8
9
10
11
12
13
14
15
16
17
18
19
20
with

instance = metric requests
  | filter service = android
  | delta 10m
  | group_by [host.name], sum;

average = metric requests
  | filter service = android
  | delta 10m
  | group_by [host.name], sum
  | group_by [], mean;

stddev = metric requests
  | filter service = android
  | delta 10m
  | group_by [host.name], sum
  | group_by [], std_dev;

join (instance - average) / stddev
See also
Manage notification destinations
Updated May 29, 2024