
Cloud Observability can ingest telemetry data (metrics, traces, and logs) from your cloud-based infrastructure and application components, allowing you to view and monitor their performance. Once Cloud Observability ingests both your infrastructure and application data, you can start your investigation. Cloud Observability can help you correlate issues you might see in your transactions (served by your application) with issues in your resources (served by your infrastructure). But before you can do that, you need to get the telemetry data from both places into Cloud Observability.
Read Ben Sigelman’s Medium post for more about how your resources and transactions work together to provide full observability.
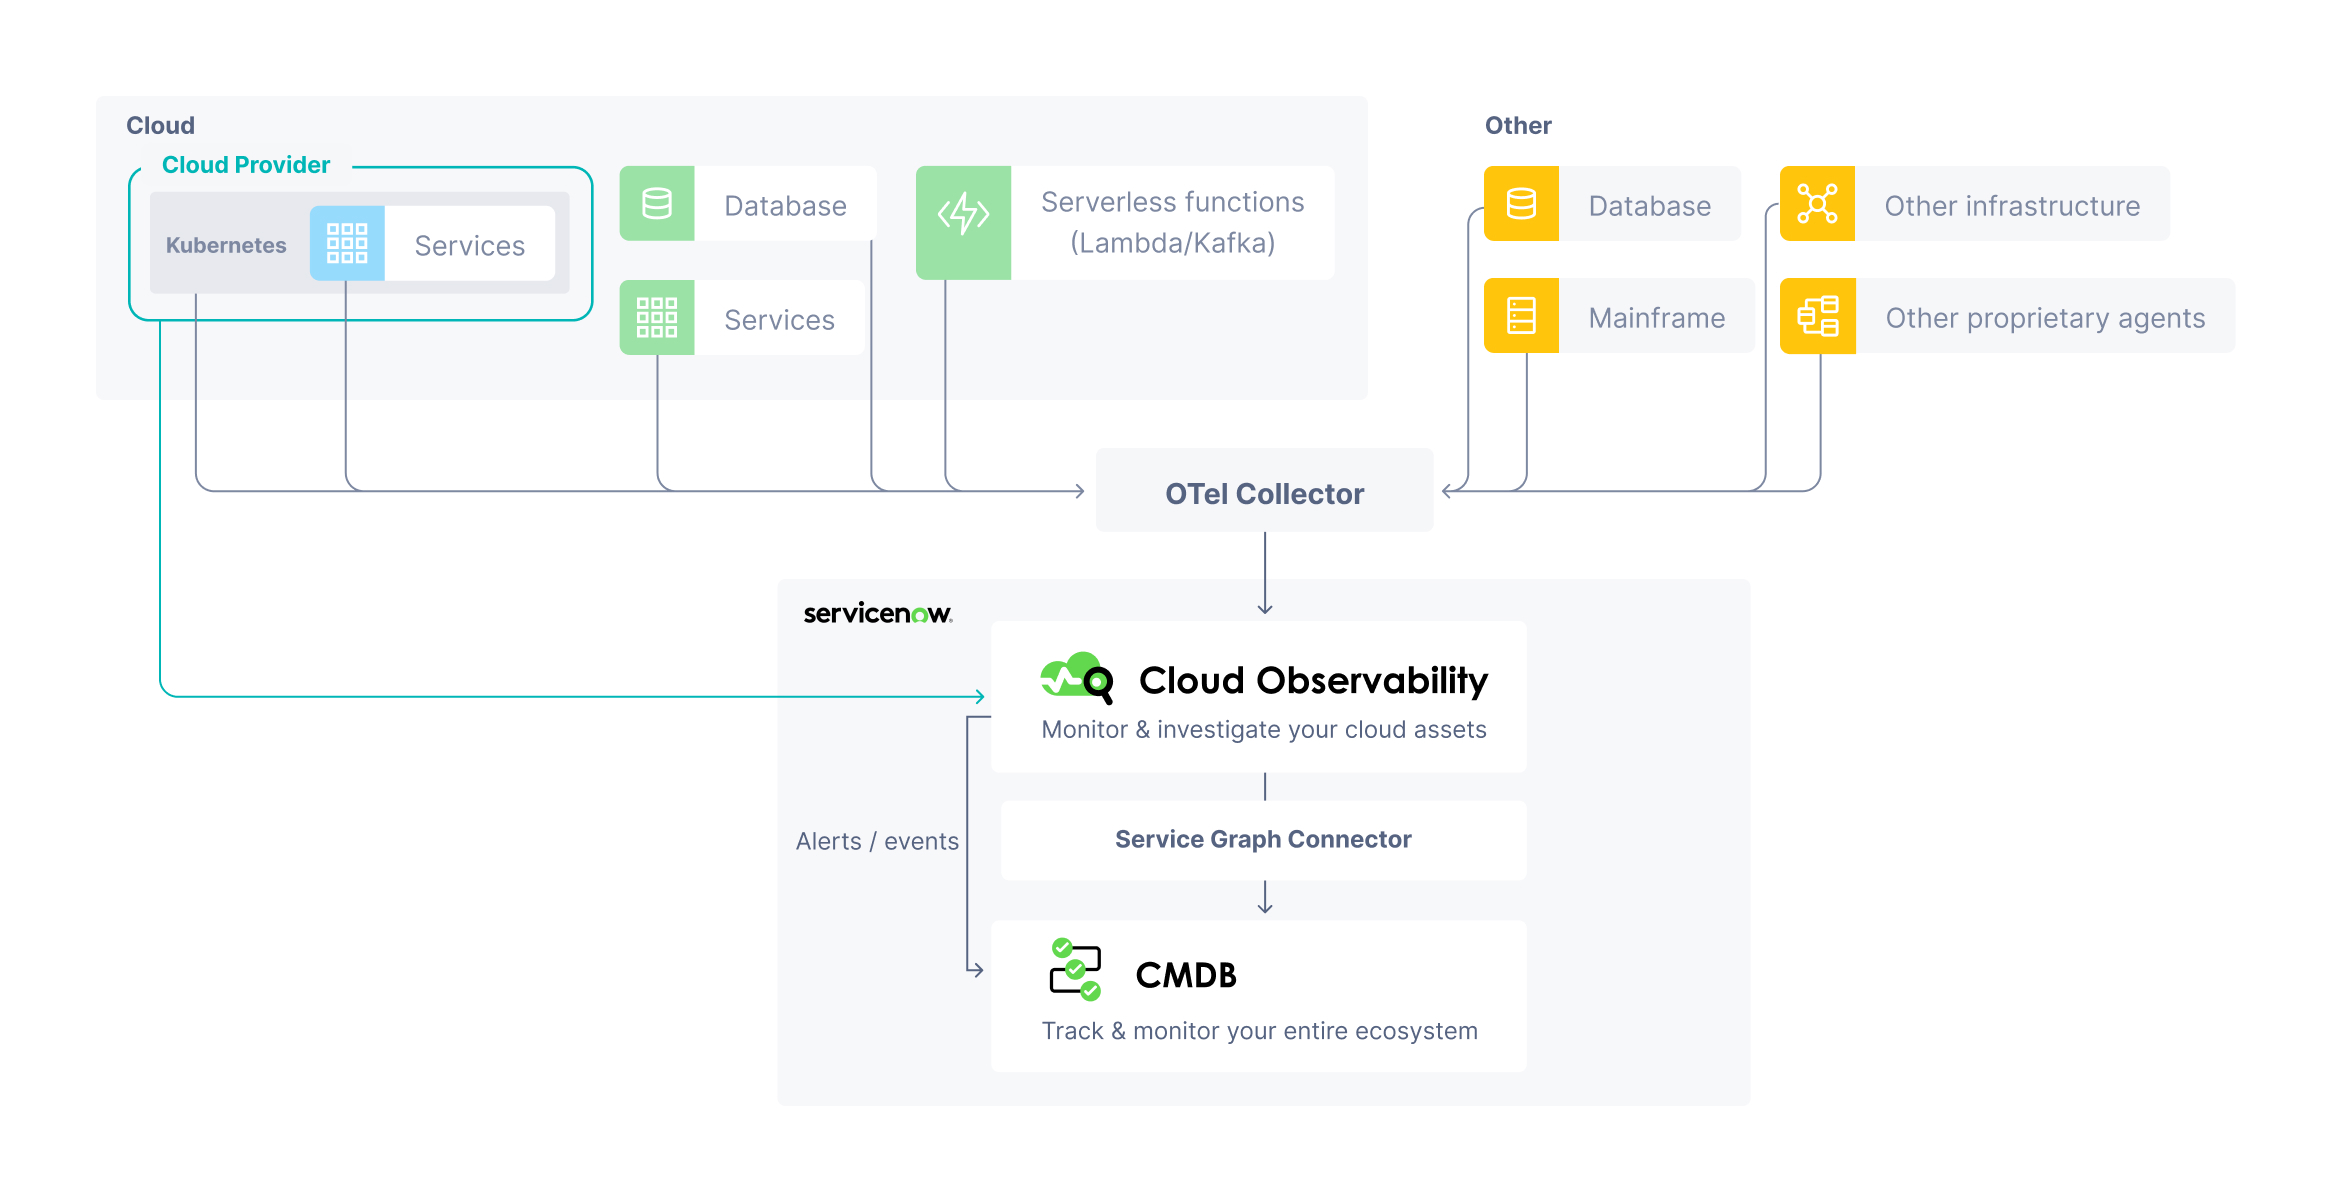
In most cases, you use the OpenTelemetry Collector (and for Kubernetes environments, the OpenTelemetry Operator) to send that telemetry data to Cloud Observability. When you use ServiceNow ITOM for monitoring and remediation, that data can then be sent to the CMDB, so you can get a comprehensive view of your entire system and monitor it in one place.
The following graphic shows a high-level view of how telemetry data can be ingested by Cloud Observability.
Use this table to learn how to get data into Cloud Observability, depending on the source.
| Send data from: | What you’ll use: | What you’ll see: | Docs: |
|---|---|---|---|
| Cloud infrastructure | Cloud Observability + info from your provider | Metrics | Ingest metrics from Amazon Ingest metrics from GCM Ingest metrics from Azure AKS Secondary: Integrations |
| Kubernetes infrastructure | Collector + Operator | Metrics (including Prometheus) Logs |
Quick Start Secondary: Use the OpenTelemetry Collector Integrations |
| Other infrastructure (databases/mainframes/log collectors /network proprietary agents, etc.) |
Collector | Metrics Logs |
Quickstart: Collector for infrastructure metrics Integrations Send logs to Cloud Observability Already using the collector? Secondary: Use the OpenTelemetry Collector |
| Application services | OpenTelemetry instrumentation Collector Operator (if on Kubernetes) |
Metrics Logs Traces |
Quickstart: Tracing instrumentation Quickstart: Collector for application data Secondary: Use the OpenTelemetry Collector |
| Already using the Collector | Configure the Collector | Already using the collector? |
Updated Aug 30, 2023