The OpenTelemetry Collector provides an integration with CouchDB to ingest metrics. Metrics from the /_node/{node-name}/_stats/couchdb endpoint are sent to the OpenTelemetry CouchDB receiver in the Collector. From there the metrics are processed and exported to Cloud Observability.
To complete the integration, you will:
- Configure the CouchDB receiver for the Collector
- Enable the integration by adding it to a pipeline
Prerequisites
- A running instance of CouchDB versions 2.3 or later and 3.1 or later.
- You’ve configured the Collector to export metric data to Cloud Observability.
CouchDB reporting
CouchDB emits metrics through its /_node/{node-name}/_stats/couchdb endpoint by default.
For more details regarding configuring the CouchDB remote connection, see the official CouchDB documentation.
Configure the Collector receiver
In the Collector configuration file, add CouchDB as a receiver and set the following:
endpoint: The endpoint of the hostname/IP address and port or unix socket file path of the CouchDB instance.username: Username for CouchDB.password: Password for CouchDB user.collection_interval: Interval to internally sample the statistics endpoint. When monitoring the_statsendpoint, you need to use a polling frequency of at least twice this to observe accurate results. For example, if the interval is 10 seconds, setcollection_intervalto at least every 5 seconds. This value must be a string readable by Golang’stime.ParseDuration. Valid time units arens,us(orµs),ms,s,m,h.
1
2
3
4
5
6
receivers:
  couchdb:
    endpoint: http://localhost:5984
    username: otelu
    password: $COUCHDB_PASSWORD
    collection_interval: 10s
The OpenTelemetry repo provides additional details about CouchDB configuration.
Enable the Collector receiver
Once the CouchDB receiver is configured, enable it by adding it to one or more pipelines as described in the Collector configuration documentation.
Validate metrics are reporting to Cloud Observability
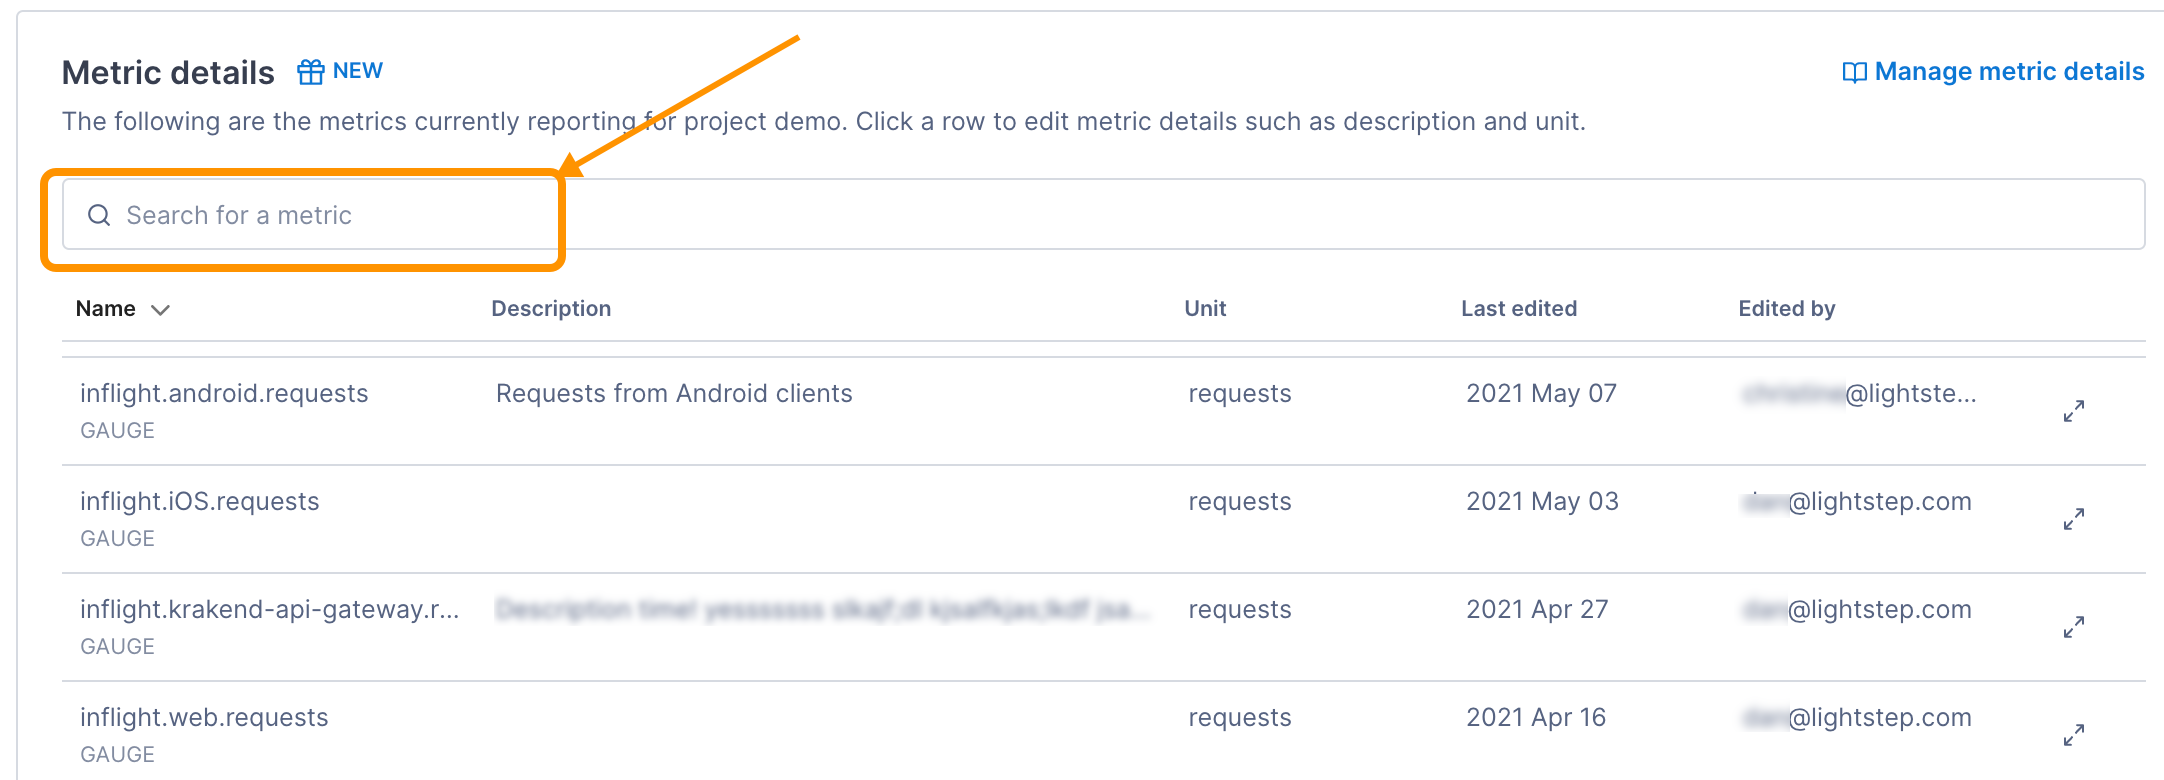
You can validate that metrics are reporting to Cloud Observability on the Metrics details page in Settings.
-
In Cloud Observability, click Settings > Metric details.
-
Search for CouchDB metric names.

See the receiver’s metadata file for a complete list of emitted metrics.
-
If needed, click on the metric to edit the description and how the units are displayed in Cloud Observability.
Create a dashboard for the metrics
Use the Cloud Observability Terraform Provider to create a dashboard for the metrics.
See also
Updated Dec 1, 2022
