The OpenTelemetry Collector provides an integration with Docker stats to ingest metrics about the host machine and the docker daemon’s running containers. Alternatively, you can use the Prometheus receiver to scrape Prometheus metrics from Docker. The Collector fetches metrics from the configured path for either receiver. From there the metrics are processed and exported to Cloud Observability.
The Docker stats receiver is supported only on Linux.
To complete the integration, you will:
- Configure Docker stats to report metrics to the OpenTelemetry Collector
- Configure the Docker stats receiver and/or Prometheus receiver for the Collector
- Enable the integration by adding it to a pipeline
Prerequisites
-
The optional Docker Post-installation steps for Linux have been completed.
For the Manage Docker as a non-root user option, you need to assign group ownership (i.e
chmod u+x /var/run/docker.sock) to the Docker socket where the metrics will be scraped. -
You’ve configured the Collector to export metric data to Cloud Observability.
Configure Docker stats reporting
Configure Docker’s daemon to report metrics to the Collector:
- Add a directive to the Docker daemon configuration in
/etc/docker/daemon.jsonthat exposes metrics at an address, using the key,metrics-addr, and a proper IP address:1
“metrics-addr”: “127.0.0.1:9100”
- In some versions of the Docker daemon you may also need to turn-on experimental features with the key,
experimental:1
“experimental”: true
-
Configure remote access for the daemon.
- Restart the Docker daemon for the changes to take effect. For example, if the Docker daemon runs under
systemd:1
sudo systemctl restart docker.serviceVisit the Docker docs for more information about configuring the Docker daemon and configuring Docker to use Prometheus.
Configure the Collector receiver
You can configure the receiver to scrape metrics from either Docker stats or from Prometheus.
Scrape Docker stats metrics
In the Collector yaml configuration file, add Docker stats as a receiver and set the endpoint:
1
2
3
4
receivers:
  docker_stats:
    endpoint: http://localhost:9100
The OpenTelemetry repo provides additional details about Docker stats configuration.
Scrape Prometheus Docker metrics
In the Collector configuration file, configure the Prometheus receiver to use the Docker Prometheus endpoint as a scrape target.
1
2
3
4
5
6
7
receivers:
  prometheus/docker:
    config:
      scrape_configs:
        - job_name: docker-otel-eg
          static_configs:
            - targets: [“${IP_ADDRESS}:2375”]
The OpenTelemetry repo provides additional details about Prometheus receiver configuration.
Details about full configuration of the Prometheus scrape configuration can be found here.
Enable the Collector receiver
Once the Docker stats receiver is configured, enable it by adding it to one or more pipelines as described in the Collector configuration documentation.
Validate metrics are reporting to Cloud Observability
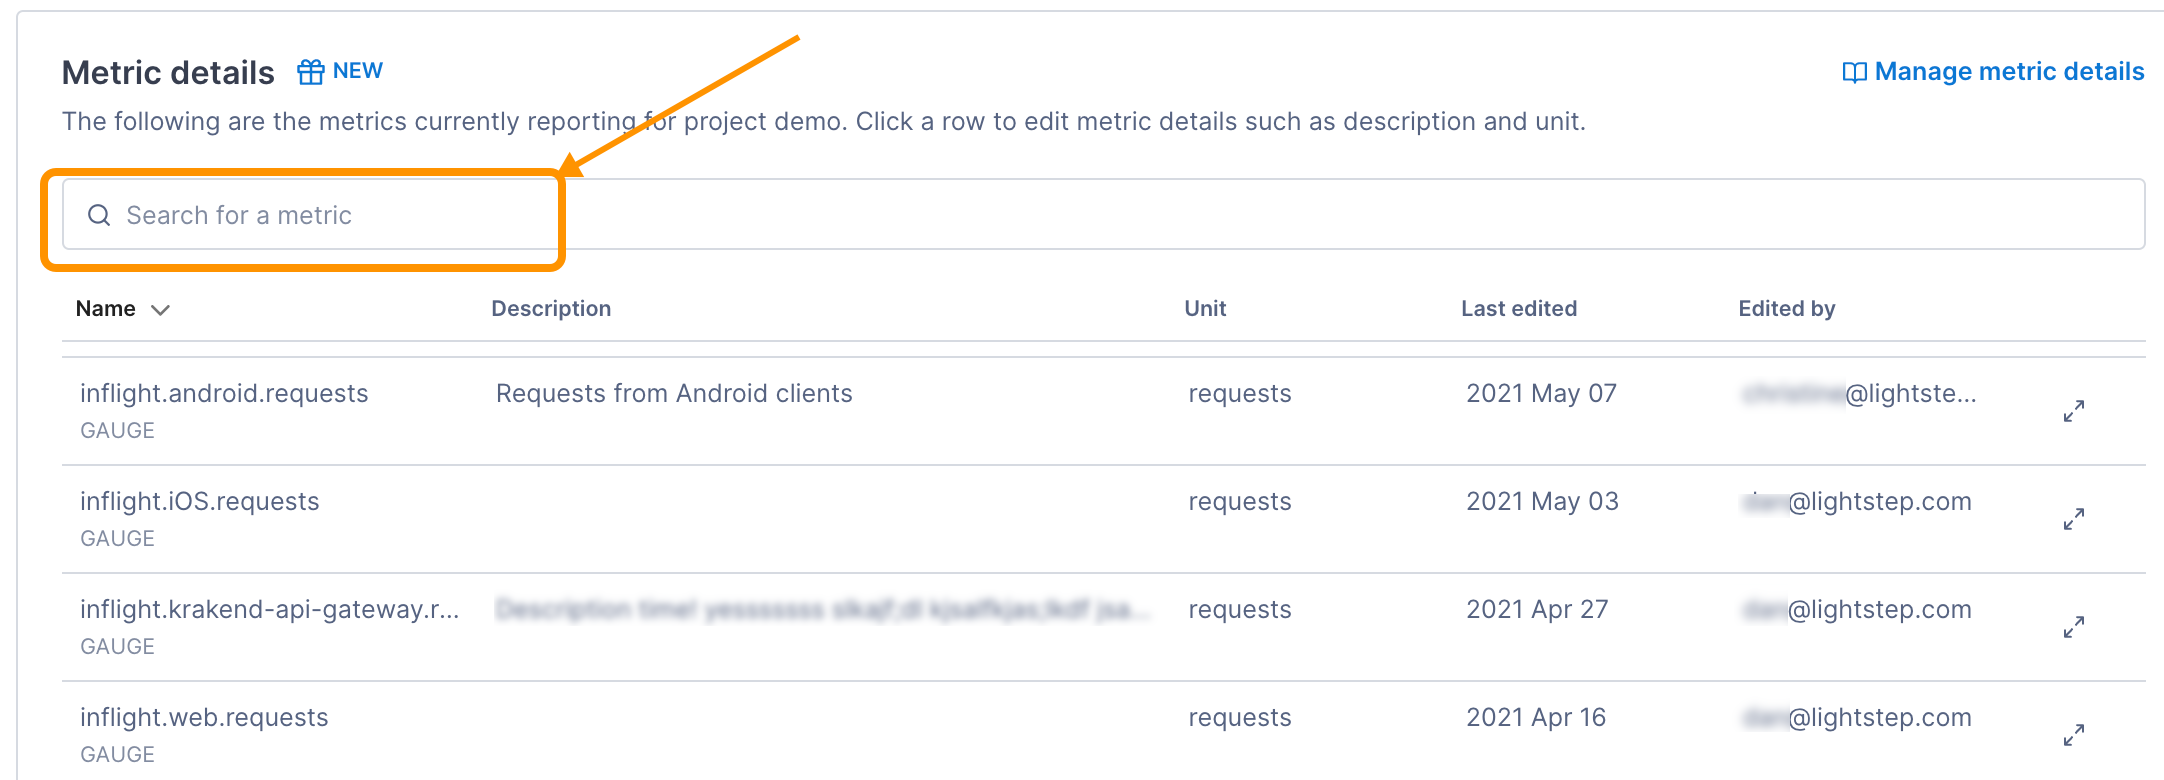
You can validate that metrics are reporting to Cloud Observability on the Metrics details page in Settings.
-
In Cloud Observability, click Settings > Metric details.
-
Search for Docker stats metric names.

-
If needed, click on the metric to edit the description and how the units are displayed in Cloud Observability.
Create a dashboard for the metrics
Use the Cloud Observability Terraform Provider to create a dashboard for the metrics.
Additional resources
For a more complete example that’s ready to run, see the Docker stats integration in Cloud Observability OpenTelemetry Examples.
See also
Updated Dec 1, 2022
