The OpenTelemetry Collector, when configured with a Prometheus receiver, provides an integration with etcd to scrape Prometheus metrics. The Collector uses the Prometheus Receiver to fetch metrics from the configured path in the etcd configuration file. From there, the metrics are processed and exported to Cloud Observability.
To quickly ingest Kubernetes metrics into Cloud Observability using the OpenTelemetry Operator for Kubernetes, see instructions in the Kubernetes Quick Start.
To complete the integration, you will:
- Configure etcd to use the Prometheus exporter.
- Configure the Collector to use the etcd endpoint as a scrape target for the Prometheus receiver.
- Enable the integration by adding it to a pipeline.
Prerequisites
- etcd version v3.5 or later.
- You’ve configured the Collector to export metric data to Cloud Observability.
Configure etcd reporting
You need to configure etcd to use the Prometheus Receiver by setting an ETCD Prometheus endpoint. You can use either the etcd configuration file, an environment variable, or a command line flag.
The configuration file takes precedence over all other etcd startup options. If a configuration file is provided, environmental variables and command line flag variables are ignored. Environment variable and command line flags can’t both be set. See etcd https://etcd.io/docs/v3.4/op-guide/configuration/ for more information.
Histograms are not consumable if the metrics environmental variable, startup flag, or configuration variable is not defined other than metrics: basic.
Use the configuration file
- Run the following to access the
etcd.conf.ymlconfiguration file:1
./etcd –config-file=etcd.conf - In the configuration file, add the following:
1
listen-metrics-urls: http://0.0.0.0:5050
Use environment variables
Set the metrics url:
1
2
export ETCD_LISTEN_METRICS_URLS=http://0.0.0.0:5050
./etcd
Use the command line
Set the metrics url:
1
./etcd –listen-metrics-urls http://0.0.0.0:5050
For more information about etcd configuration, see the official etcd documentation. For details about using etcd with the Prometheus exporter, see this etcd operations guide.
Configure the Collector receiver
In the Collector configuration file, configure the Prometheus receiver to use the etcd Prometheus endpoint as a scrape target. You can specify a single node or for failover, multiple nodes in a cluster.
The port(s) used in this configuration must match the ports used when configuring etcd for Prometheus, in the previous step.
Single node
1
2
3
4
5
6
7
8
9
receivers:
  prometheus/etcd:
    config:
    scrape_configs:
    - job_name: 'etcd-scraper'
        scrape_interval: 5s
        metrics_path: "/metrics"
        static_configs:
        - targets: ["0.0.0.0:5050"]
Cluster with multiple nodes:
1
2
3
4
5
6
7
8
9
receivers:
  prometheus/etcd:
    config:
    scrape_configs:
    - job_name: 'etcd-scraper'
        scrape_interval: 5s
        metrics_path: "/metrics"
        static_configs:
        - targets: ["eu-east:5050",”eu-west:5050”,”eu-central:5050”,”ap-south:5050”,”af-south:5050”]
The hosts provided above (i.e eu-east, eu-west) must match the host name on the machines (or VMs) you are running your etcd on.
The OpenTelemetry repo’s readme provides additional details about Prometheus receiver configuration.
Enable the Collector receiver
Once the etcd receiver is configured, enable it by adding it to one or more pipelines as described in the Collector configuration documentation.
Validate metrics are reporting to Cloud Observability
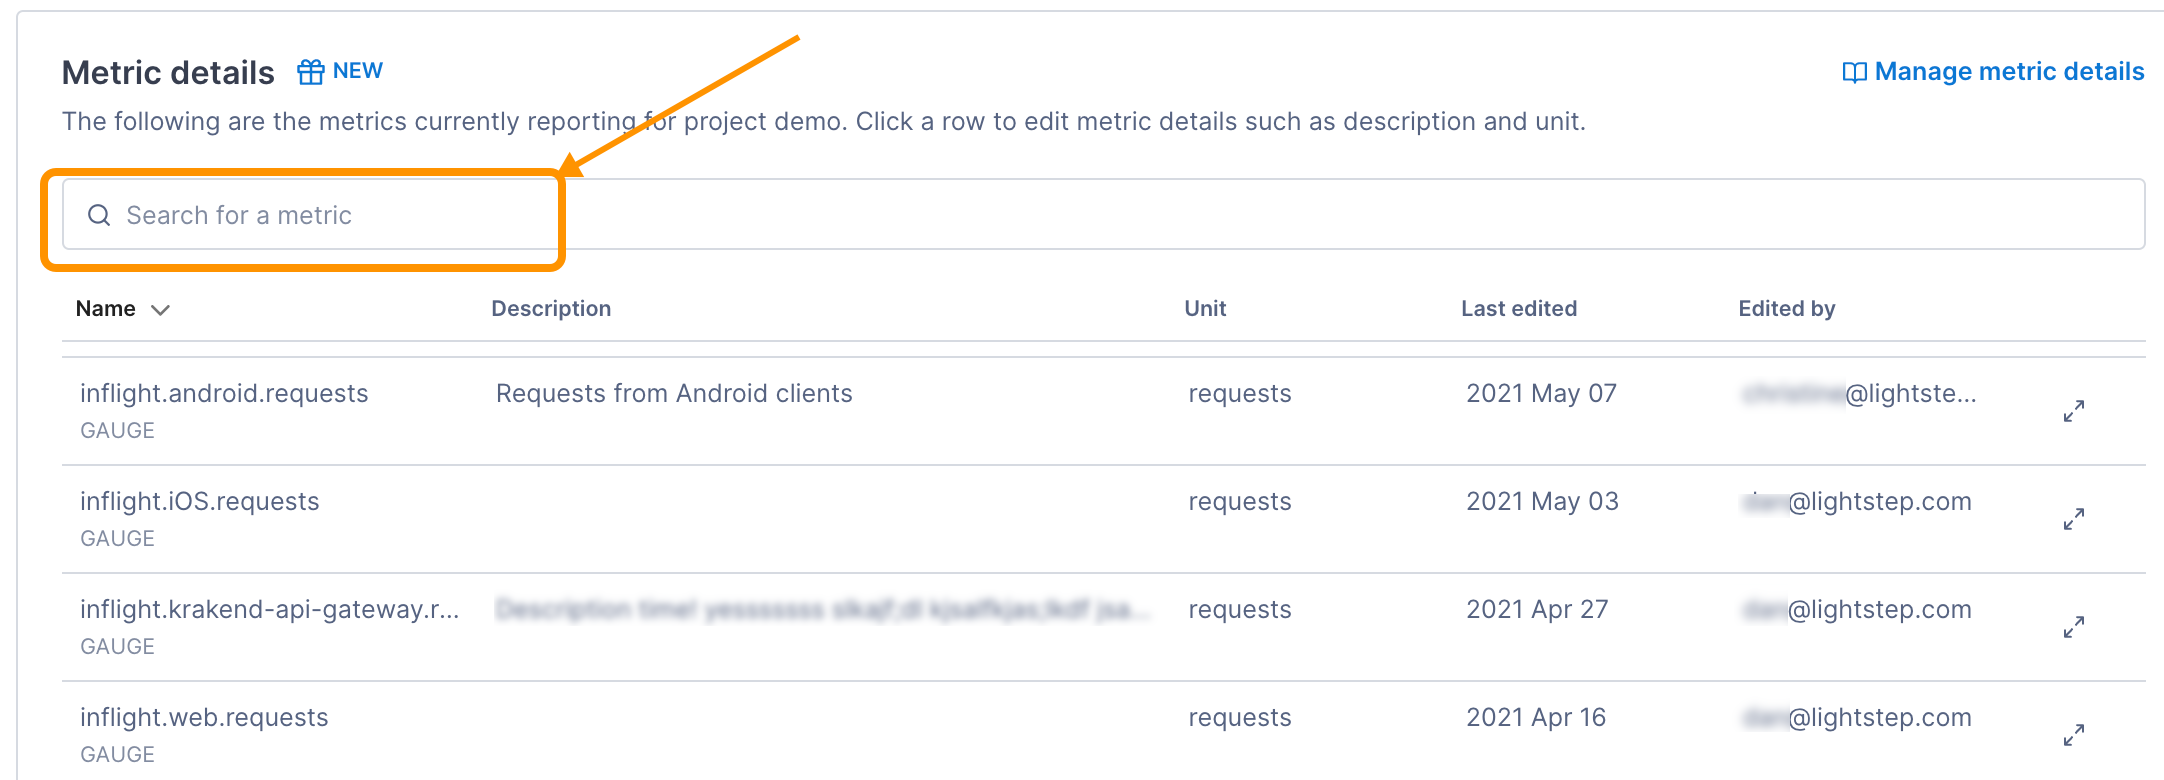
You can validate that metrics are reporting to Cloud Observability on the Metrics details page in Settings.
-
In Cloud Observability, click Settings > Metric details.
-
Search for etcd metric names.

-
If needed, click on the metric to edit the description and how the units are displayed in Cloud Observability.
Create a dashboard for the metrics
Use the Cloud Observability Terraform Provider to create a dashboard for the metrics.
Additional resources
For a more complete example that’s ready to run, see the etcd integration in Cloud Observability OpenTelemetry Examples.
See also
Updated Dec 1, 2022
