To bring metric data into Cloud Observability, you configure a Datadog agent to “tee” traffic to both Cloud Observability and Datadog. The traffic is duplicated and sent to both destinations. If you have existing dashboards that you want to import into Cloud Observability, you can use a script to export them and then send them to Cloud Observability to be imported.
Importing dashboards to Cloud Observability will not affect your existing dashboards in Datadog.
If you’re just starting with Datadog (and don’t need to import dashboards or send data to Cloud Observability), you can send metrics directly to Cloud Observability.
Requirements
Cloud Observability supports both Datadog Agent major versions 6 and 7 tracks.
The following minimum versions are required:
- Major version 6: Minimum version of 6.18.0 (released March 16, 2020)
- Major version 7: Minimum version of 7.18.0 (released March 16, 2020)
Major version 5 of the Datadog agent is not supported.
Prerequisites
You’ll need the following values to complete the steps:
- An organization-level Datadog API key
- An organization-level Datadog App key
- A Cloud Observability access token for the project to report metrics to.
- Download the datadog-fetch.sh script to a local directory.
Send metric data from Datadog to Cloud Observability
To send metrics to Cloud Observability you need to add the Cloud Observability endpoint to your Datadog agent configuration. It takes a key for the Cloud Observability metrics ingest domain at https://metricingest.lightstep.com (https://metricingest.eu.lightstep.com for the EU) and a value of a Cloud Observability access token. This allows the data to be accepted by Cloud Observability. You can do this using the Datadog YAML configuration file.
Use YAML to configure the Agent
- In your
datadog.yamlfile, add theadditional_endpointsproperty in the Basic Configuration section, and configure it with the URL for Cloud Observability metrics ingest and your Cloud Observability access token. If you are currently using v2 of the Datadog API, then you must also set that to false.
1
2
3
4
5
6
7
8
9
10
11
12
#########################
## Basic Configuration ##
#########################

api_key: <EXISTING_DATADOG_API_KEY>

additional_endpoints:
  'https://metricingest.lightstep.com': #US data center
    - <LIGHTSTEP_ACCESS_TOKEN>
  #'https://metricingest.eu.lightstep.com': #EU data center
    #- <LIGHTSTEP_ACCESS_TOKEN>
use_v2_api.series: false
- Redeploy the configuration file and restart the Datadog Agent.
At startup, look for a log message containingForwarder started;. This lists the destinations the agent is sending to (which should include both Datadog and Cloud Observability).
Use environment variables to configure the Agent
The Datadog Docker Agent, the containerized version of the Datadog Agent, supports configuration via environment variables. If you are currently using v2 of the Datadog API, then you must also set that to false.
If you are currently using v2 of the Datadog API, then you must also set the DD_USE_V2_API_SERIES environment variable to false.
- Set the
DD_ADDITIONAL_ENDPOINTSenvironment variable with values for the Cloud Observability metrics ingest domain athttps://metricingest.lightstep.com(https://metricingest.eu.lightstep.comfor the EU) and Cloud Observability access token as serialized JSON.
Start tabs
Docker Run
1
-e DD_ADDITIONAL_ENDPOINTS='{"https://metricingest.lightstep.com": ["LIGHTSTEP_ACCESS_TOKEN"]}'
Kubernetes
1
2
3
4
env:
  - name: DD_ADDITIONAL_ENDPOINTS
    value: '{"https://metricingest.lightstep.com": ["LIGHTSTEP_ACCESS_TOKEN"]}' #US data center
    #value: '{"https://metricingest.lightstep.com": ["LIGHTSTEP_ACCESS_TOKEN"]}' #EU data center
Docker Compose
1
2
3
4
5
services:
  datadog:
    environment:
      - DD_ADDITIONAL_ENDPOINTS='{"https://metricingest.lightstep.com":["LIGHTSTEP_ACCESS_TOKEN"]}' #US data center
      #- DD_ADDITIONAL_ENDPOINTS='{"https://metricingest.eu.lightstep.com":["LIGHTSTEP_ACCESS_TOKEN"]}' #EU data center
End code tabs
- Restart the Datadog Agent.
At startup, look for a log message containingForwarder started;. This lists the destinations the agent is sending to (which should include both Datadog and Cloud Observability).
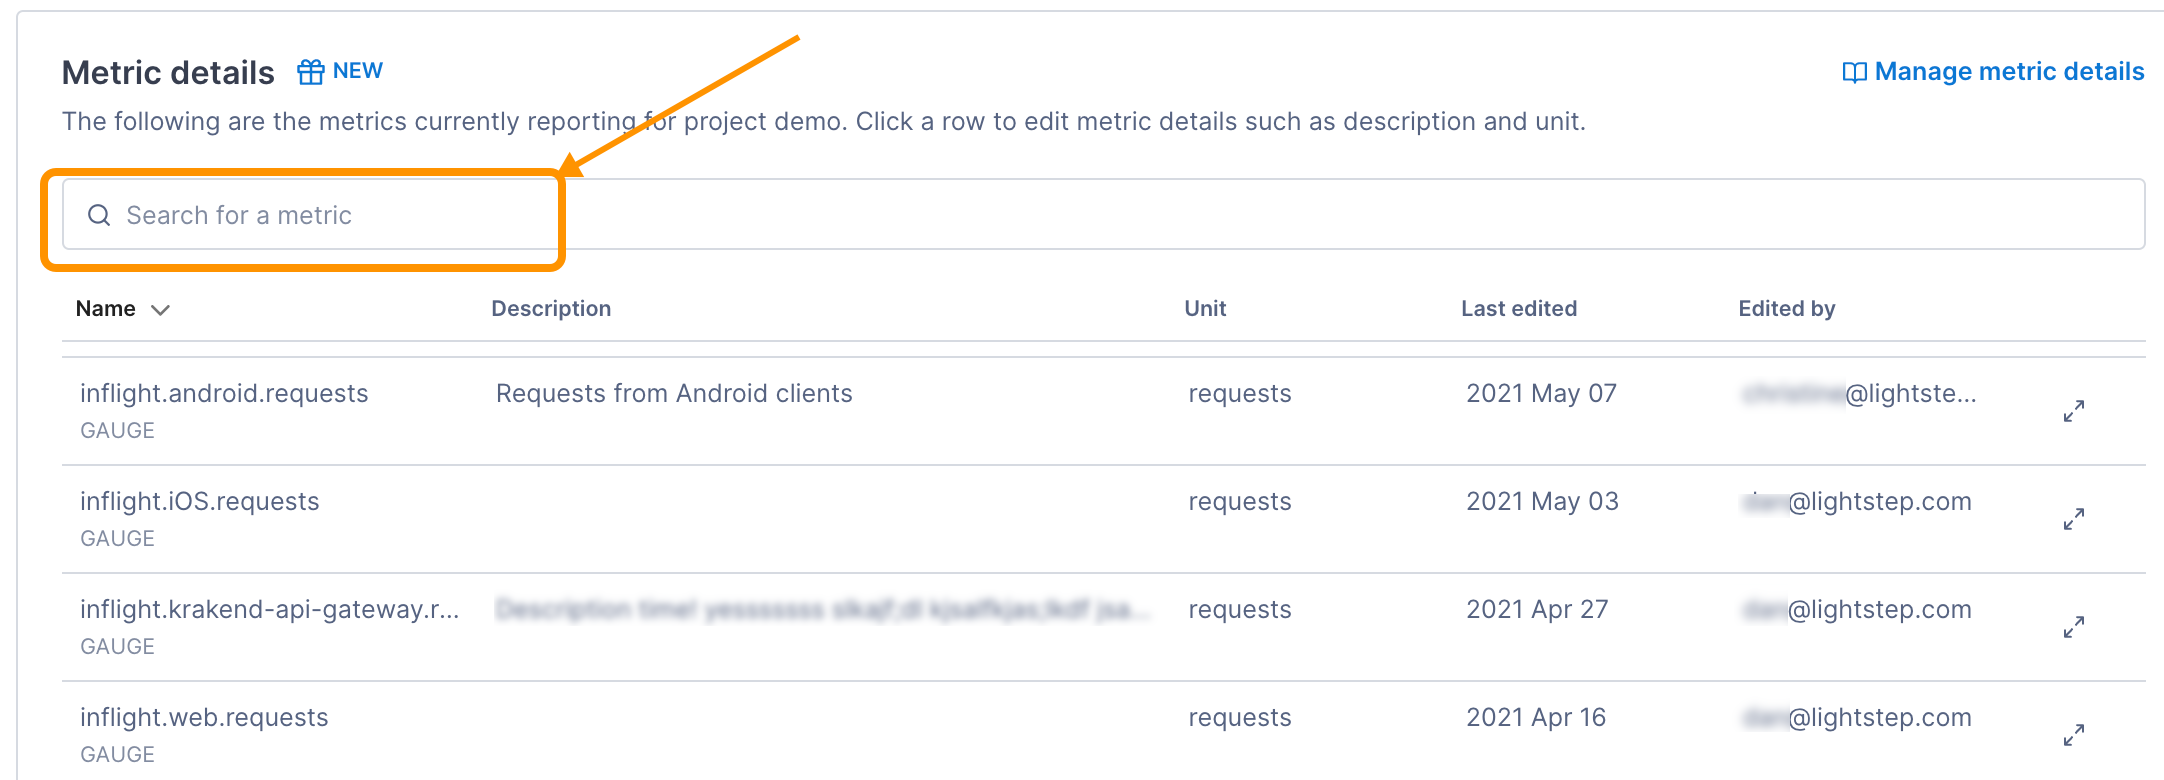
You can validate that metrics are reporting to Cloud Observability on the Metrics details page in Settings.

Import Datadog metric dashboards and data into Cloud Observability
To import Datadog dashboards into Cloud Observability, you run a script to fetch the dashboards, or you can grab the JSON from an individual dashboard in the Datadog GUI. When you run the script, you can export all or a subset. When you send them to Cloud Observability, they can transform them into Cloud Observability Metrics Dashboards.
Export Datadog dashboard JSON from GUI
You can follow these instructions to export an individual dashboard’s JSON.
Download and test the script
-
Set your Datadog APP and API keys as environment variables.
Replace<YOUR-APPLICATION-KEY>and<YOUR-API-KEY>with your values.1 2
export DD_CLIENT_APP_KEY=<YOUR-APPLICATION-KEY> export DD_CLIENT_API_KEY=<YOUR-API-KEY>
You will need organization-level app and API keys from Datadog.
-
Navigate to the directory where you downloaded the import script, then make the script executable.
1
2
3
 cd ~/Downloads/

 chmod +x ./datadog-fetch.sh
-
To confirm the script is working, run:
./datadog-fetch.sh helpThe script is successful if you see this message:
1
 preflight checks passed
Run the script
You can export all your dashboards and metrics or pick a subset. Both dashboards and metrics are saved to their own file named after the ID (for example, datadog/dashboards/$DASHBOARD_ID.json or datadog/metrics/$METRIC_NAME.json) in the directory where you ran the script.
Fetch all dashboards and metric data
Run this in your terminal to fetch all dashboards:
./datadog-fetch.sh -all dashboards
Run the following in your terminal to fetch all metric metadata. There is no bulk API endpoint so this will make an API call for every active metric that reported during the last 2 weeks. Expect that this will take awhile and grab a cup of tea!
./datadog-fetch.sh -all metrics
Fetch a selection of dashboards and metrics by ID
To export dashboards correctly Cloud Observability needs to fetch not only the dashboards, but also the metric kinds associated with the queries.
Identify the the IDs of dashboards you are interested in exporting. You can find these in the URL when viewing the dashboard in the DataDog UI, for example app.datadog.com/dashboard/DASHBOARD_ID/DASHBOARD_TITLE.
Run the script to export by ID in your terminal:
./datadog-fetch.sh -dashboard-ids DASHBOARD_ID, DASHBOARD_ID...
The ID of a metric is the metric name. For each metric that is charted on your dashboards find the metric name which you can find by looking at Metric Explorer, Metric Summary, or reviewing the query fields for your dashboards. For example, for avg:kubernetes.memory.limits{$kube_environment,kube_app:api-gateway} the metric ID is kubernetes_memory_limits.
Run the script to export by ID in your terminal:
./datadog-fetch.sh -metric-ids METRIC_NAME, METRIC_NAME...
Fetch a selection based on other criteria
If you don’t want to click through to find all the IDs of the dashboards, you can use other filter criteria.
To do that, run the script and export all dashboards and then use a JSON parsing tool to filter what you want to keep. You can filter by the presence of a word in a title, a tag, or any of the fields present on a dashboard.
Dashboards by title:
1
2
3
4
5
6
7
8
#!/bin/bash
for file in ./datadog/dashboards/*
do
 if [[ $(cat $file | jq '. | select(.title | contains("WORD-TO-MATCH")) | .id') ]]
   then echo "keeping ${file}"
   else echo rm $file && rm $file
fi
done
Confirm the export was successful
You can spot check the individual dashboard and metric files to ensure the export was successful or run these commands.
Confirm the dashboard export was successful
Confirm the export worked by running this command:
ls ./datadog/dashboards
This command outputs the files that were exported, for example, $DASHBOARD_ID.json.
Confirm the metric metadata export was successful
Confirm the export was successful by running this command. It should output several files named like $METRIC_NAME.json.
ls ./datadog/metrics
Send Cloud Observability exported dashboards
Compress and save the exported directory by running this command:
tar -czvf CUSTOMER_NAME_metadata.tar.gz ./datadog/
Email the file to your technical account manager or contact Customer Success.
Cloud Observability will turn eligible dashboards into Cloud Observability metrics dashboards. You’ll be notified when the migration is complete and you can start experimenting with them.
Send only Datadog metrics just to Cloud Observability
If you just want to send metrics to Cloud Observability, and not import any dashboards or also send metrics to Datadog, you need to replace the default Datadog configuration.
In your Datadog configuration file, replace api_key and dd_url with the following in the Basic Configuration section of the datadog.yaml file:
1
2
3
4
5
6
7
#########################
## Basic Configuration ##
#########################

api_key: <LIGHTSTEP_ACCESS_TOKEN>
dd_url: "https://metricingest.lightstep.com" #US data center
#dd_url: "https://metricingest.lightstep.com" #US data center #EU data center
Redeploy the configuration file and restart the Datadog agent.
You can validate that metrics are reporting to Cloud Observability on the Metrics details page in Settings.

See also
How Cloud Observability displays metrics
Updated Dec 1, 2022
